Hello Folks
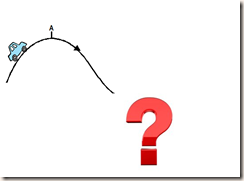
Well, the markets continue to display weakness and low volumes, albeit their arrival to All-Time-Highs in prior days. It is almost as if they have coasted uphill, with no engine power, and are slowing down, running out of speed and momentum. Yes, the powerless car has coasted up the hill and has travelled a pretty good distance, but what is under the hood ? Is the engine still functioning properly? Do we want to get into this car and trust that it can transport us somewhere ?
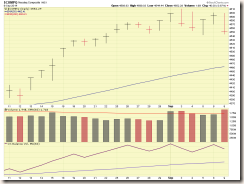
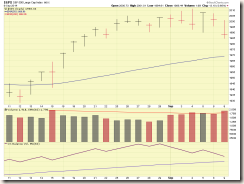
Above are the the most recent charts of the NASDAQ Index and SP 500 Index.
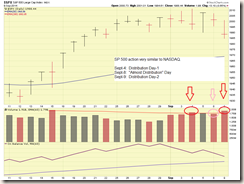
Scrutiny of these charts will reveal the obvious “All-Time-Highs” achieved on Sept-4 for the NASDAQ and Sept-3 for the SP 500, however on both dates the indexed opened “up” in the morning and closed lower than the open price, on above average volume. So while yes, a new “High” was achieved, it was in the initial opening stages and the markets sold off both days after the high was attained.
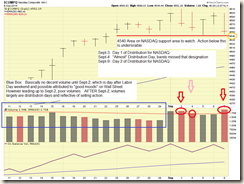
Also note on Sept-2, the first day after the Labor Day weekend (Monday Sept-1 the markets were closed), Wall Street appeared to be in good spirits, with decent uptick and buying on the NASDAQ. The SP 500 was ho-hum on Sept-2, not hugely up, and not down. However since Sept-2, the markets have seen some “Distribution Days” (discussed in depth on this site previously) which are undesired. My own studies, combined with research and studies performed by the folks at Investors Business Daily, reflect that after four or five days of Distribution over a span of four to five weeks, the markets almost always turn down. We have had two days of distribution and one day of “almost distribution”, on both indexes. The clock has started on Sept-3 (Distribution Day-1), and we need to monitor additional distribution days thru Oct-3 (four weeks minimum). Lets take a look at the charts again, but with my comments on them:
It is also apparent that the new support level for the NASDAQ is 4540 area, anything below that is undesirable. The support level for the SP 500 will be 1983 area. More important, well, just as important, is volume action. If we hit say 1975, on low volume, ok, I am not losing sleep, although that is undesired action. But if we hit 1975 on huge volume, major red flag.
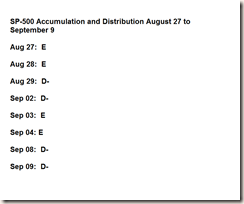
To supplement my chart analysis is the Accumulation and Distribution Ratings from the folks at Investors Business Daily. Basically, A is “good” and E is “poor”, with “A” representing huge institutional money in-flows to stocks, while “E” is heavy selling by institutional money (aka mutual funds, pension plans, hedge funds, etc.). Lets take a look at the ratings for the SP 500 Index since Aug 27 (about two weeks ago)
So, going back two weeks, we don’t really see any huge changes in these ratings. No major improvements to “justify” the recent uptrend which indeed has occurred. I have been a skeptic of this uptrend, and chosen to pass on possible gains (those that remained in stocks did, indeed, achieve some gains) to instead monitor things a little longer.
To recap:
- We have two distribution days since Sept-3.
- Volumes have been light until Sept-3, indicating a prior lack of interest by major money managers in accumulating additional stocks.
- Yes, the index has climbed upward, however this is on low volume (#2) and my opinion is the “new uptrend” is suspect
- 4540 NASDAQ and 1983 SP 500 are the levels to keep an eye on.
- I am personally 100% G-Fund
As stated previously, I am tweaking my system somewhat (not hugely, however) as many have emailed me seeking a little more risk (and possible gains) instead of being conservative. Not everybody mind you, some appreciate the conservative approach, but there exists a clear “fan base” if you will, that has voiced a tolerance for more risk. This modified system is still in beta-testing and is almost worthy of a patent, but since my system is largely math-based, I doubt that a patent will happen (can’t put a patent on math). It is also primarily NASDAQ based, versus SP 500 based, which arguably is becoming “Dow-Like” (Dow Jones Index is only 30 stocks). The inclusion of the NASDAQ as a data source is showing promise. Expect a “roll out” of this system in another month or two.
Please continue to encourage your colleagues to subscribe to this free site, and thank you for the great emails and the interest. As a fellow TSP Participant, I have “skin in the game” and I put my name after every post. If a similar site (and there are many) is not putting their personal name behind their product, what does that say about the product ?
For those who view the site via the web (versus subscribe for email updates), I would encourage you to sign up for an email subscription. This does a few things, 1) you get the updates mere seconds after I publish them 2) once received via email, you can refer back to it without having to rely on an internet connection. 3) Emails can also be printed and thrown in your briefcase etc. Some of the updates reflect time critical information- email subscribers get the update immediately.
Again, I am 100% G-Fund for the present time.
Thank You for reading…
– Bill Pritchard
* This update published 09-09-14 at 11:30 PM CDT

