Happy belated New Year 2025 – Dow rises 700 points on Jan 15, 2025


Happy Belated New Year 2025 everybody

As today Jan 15 2025, closes out, we now have two weeks of “market action” behind us.    My last post dated in November discussed the election and obviously we know the winner is Mr. Trump.  Politics aside, I see GOOD THINGS happening as they directly relate to the economy.    Some of which are deregulation, revised tax policy, and (all indications…) a pro-business administration.   ALL of this should propel the stock market higher.

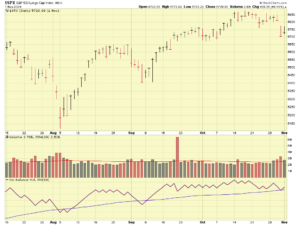
In my October 22, 2024 post, I discussed my move the the S-Fund.   I remain committed to those reasons, and expect small cap stocks to perform well in 2025, consistent with historical patterns associated to elections.

The market does have some concerns:   Tariffs, “Trade Wars”, and of course the ongoing good news-is-bad news, such as improving inflation numbers, which of course “means” (does it?) the Federal Reserve will not lower interest rates much further.   Lets look at some charts:

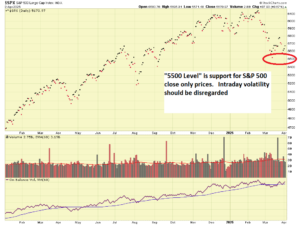
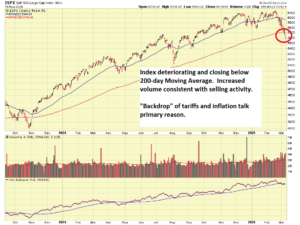
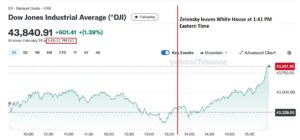
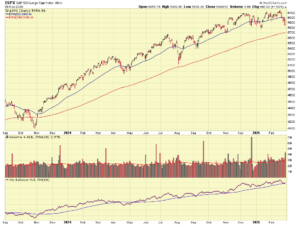
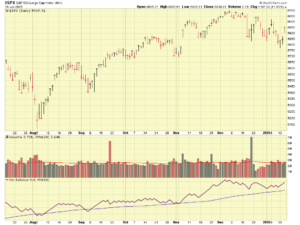
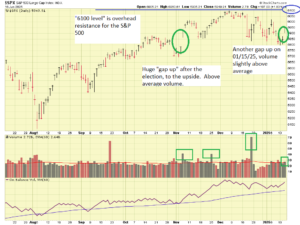
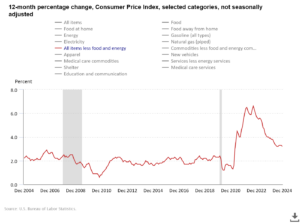
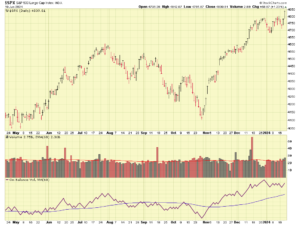
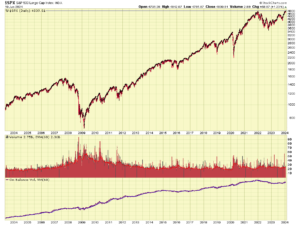
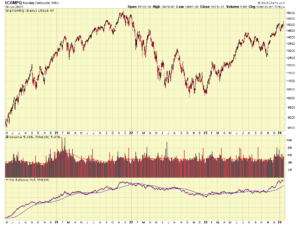
As noted on the chart, is the huge “upside move” on 11/06/2024, once we had a known winner of the election.   The market likes certainty.   Then, traders went home for Thanksgiving and Christmas, and the index drifted downward, with no volume to prop it up.  Normal behavior.   We saw some “sell off” action on or about 12/18/2024, likely to exit positions before the holidays.   Normal behavior.   On 01/15/2025 (date of this post), the Dow Jones (NOT a small cap index, I know….) rose 700 points, arguably based on the fact that inflation indeed is improving.  Lets look at that, Core CPI:

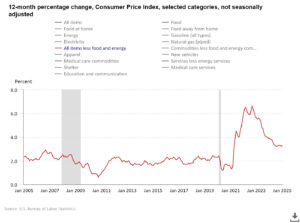
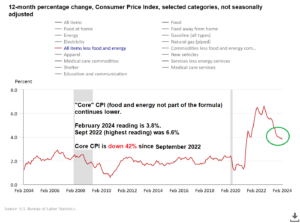
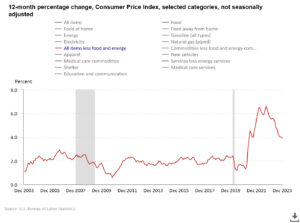
As indicated, Core CPI is improving, much improved from its peak of 6.6% in September 2022.  This has allowed the market to breath a sigh of relief in regards to interest rates.

The way I see the world, the fundamental and economic “story” supports the charts, and thus I remain committed to my position in the S-Fund.   My personal TSP is 100% S-Fund, however I would be probably just as happy being 50% S-Fund and 50% C-Fund.

With that said, this concludes the first post of 2025.   As things warrant, I will post again in the upcoming weeks.   I hope everyone has a great year.   Please continue to share this website with your colleagues and friends.

Direct link to this post, if the above images do not come through your email, is at this link:  https://www.thefedtrader.com/

Thank you again

-Bill Pritchard


My 2024 Predictions – Well almost…


Howdy folks.  I am not stupid enough to try to predict this very tight election, but I will offer some thinking points, something to add to your already overwhelmed sensory system with polls, surveys, rumors, podcasts, etc that are all covering this election.   Not sure I am believing the polls, so lets go back to some Investigator 101 stuff and reduce this all to human behavior.    At the end of the day, nobody knows how things will turn out.  But, as always, a “market angle” and “human angle” exists…

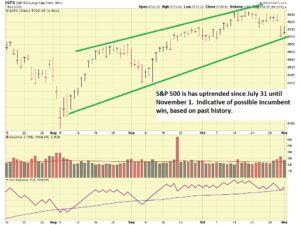
First, allow me to talk about the Presidential Prediction Indicator, developed by Sam Stovall.  Historical (documented, proven, etc…) past performance of this indicator reveals that when the S&P 500 Index is in an uptrend, between July 31 and November 1, the incumbent party in the White House will keep the White House.   Lets take a look at the chart:

Regarding the election itself, GOP strategist, Fox News contributor, and pollster Frank Luntz recently stated that 1) if Donald Trump wins either Pennsylvania or Michigan, he’ll win the election.  2) if Kamala Harris wins either Georgia or North Carolina, she’ll win the election.   Note that he says “or” not “and”.    So Trump needs PA or MI, Harris needs GA or NC.   Roger that.  

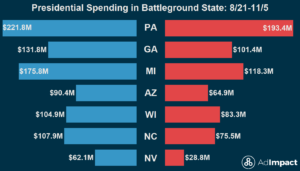
If we look at advertising spending by both campaigns, we see this, courtesy of Ad Impact Politics:

In this case, we see that spending is most in PA, GA, and MI.   So lets take a look at these (apparently) important states.

PA:

Picked a Democrat for the White House in every election since 1992, with the exception of 2016 (Trump).   Biden took PA back from Trump in 2020.    State votes chose current Governor Shapiro/member of Democratic Party, and largest city, Philadelphia, has had a Democrat mayor since 1952.   Current Mayor is a Democrat.    Next largest city, Pittsburgh, their mayor, elected by voters, is a Democrat.   Pittsburgh has had Democrat mayors since 1934.  Governors have bounced between Republicans and Democrats every few elections.   Demographics in PA have changed over recent decades, according to this 2020 article, Philadelphia itself is the second city with the largest Puerto Rican population, surpassed only by its neighbor New York City.

GA: 

Picked Republicans for the White House in every election but two, since 1992.  Governors have been reliably Republicans.   However, interestingly, every mayor of Atlanta, the states largest city, has been a Democrat.    The second largest city, Augusta, also has a Democrat mayor and a past history of electing local officials loyal to the Democrat party.

MI: 

Put a Democrat in the White House every year since 1988, except for 2016 (Trump).   Biden took the state back in 2020.   MI Governors tend to rotate from Democrat (current Governor is Democrat) to Republican and back to Democrat every other election.    Voters in the largest city of Detroit elected a Democrat mayor most recently, and that city has had Democrat mayors every election since 1962.  The next largest city, Grand Rapids, has historically been Democrat leaning.

NC:

Reliably puts Republicans in the White House every year since 1980, except for 2008 (Obama).  Interestingly, the current NC governor is a Democrat, however it appears historically both parties have occupied the governor’s house on a fairly equal basis since the 1970’s.  The current Mayor of Charlotte, the largest city, is a Democrat, as is the mayor of Raleigh, the second largest city.

In summary…

So that is a brief snapshot of the most important states in the election, in my opinion the hardest state for Harris to win will be GA.   In my opinion, the hardest state for Trump to win will be PA, due to strong Democrat-leaning metro areas historically, and prior patterns of sending Democrats to the White House.

Goldman Sachs researched prior elections and they say this:  First-term incumbency typically provides an advantage — unless there’s a recession during or just before the election. When there is no recession, the incumbent has always won in the post-World War II era.

Polls aside (who answers calls from unknown numbers, or actually responds to these texts?), past human behavior tends to be fairly predictive of future behavior.   By looking at state and local election activity, we are able to see how voters in those areas vote, not to mention State patterns of who they send to the White House.

With that said, I conclude tonight’s post….the most important poll of all, the election, is days away.

-Bill Pritchard


October Update – My TSP Allocation: changing to 100% S-Fund


Hello everyone

We went thru the entire summer with no updates from this free, no subscription-cost website, which was as planned.   I seek to not bombard everyone with excessive emails and updates, if there is no news, sometimes that is good news.  In addition, this reinforces my position that I do not “day trade” the TSP or jump in and out depending on the direction the wind is blowing, quite the contrary.   I simply seek to be in the best performing fund at all times, risk tolerance being a consideration.   Indeed sometimes that best performer is the G-Fund.

With that said, Bottom Line Up Front is that I am changing my TSP Allocation to 100% S-Fund.  My intent is to be “in position” into the S-Fund before the election.  I will skip discussion about the economy and interest rates and keep things focused on my S-Fund decision…

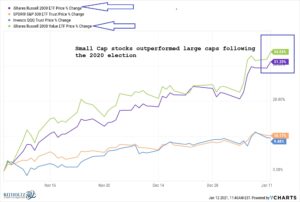
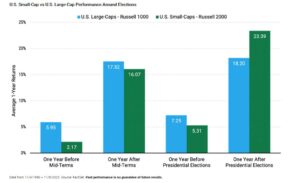
My move to the S-Fund is based on historical patterns that indicate small-cap stocks outperform other stocks in the months following a Presidential election (it does not matter what party wins).    We are obviously weeks away from arguably the most watched election in modern times- my general observations about elections are captured in my 2016 Election Post and my 2020 Election Post.

As such, it is not necessary to regurgitate the above posts; feel free to take a look at them.

Graphics courtesy of T Rowe Price, Ritholtz Wealth Management, and my own research, indicate that yes, the small-caps do well immediately after an election.  See attached graphics:

Based on these historical patterns, I am moving to 100% S-Fund.   Some have asked for my prediction of an election winner and I will stay away from that minefield.  My only comment is the election will come down to the swing states, and in those states themselves, the most populated counties, typically the metro areas.   One could argue that these swing states will be determined by about 10 or 15 metro areas:  Phoenix, Tucson, Las Vegas, Reno, Philadelphia, Atlanta, etc.   Complicating this is that some metro areas contain large numbers of residents not from (born and raised, etc.) that metro:  Las Vegas being one of them, it contains huge numbers of ex-California residents.  Also, I am not so sure if the polls are any more accurate this cycle than they were in past cycles.

Again, I am 100% S-Fund, which is my allocation, and not intended to be investment advice or suggest what your allocation should be.  Make your own decisions based on what is best for you.

Thank you for reading and talk to you soon…

-Bill Pritchard


Summer Update and Allocation Change – 100% C-Fund


Howdy Folks (Texas A&M-speak for “hello”)

First post in a few months, however in the “no news is good news” category, we have had no bad news to report.   I will state that I am changing my personal TSP Allocation (standard disclaimers:  this is not investment advice, etc.) to 100% C-Fund.     

I will offer my analysis and opinion (did I say the standard disclaimer applies?) regarding the “why” behind this and what is fueling things in the markets.   First off, my mantra is “price knows all” and at the end of the day, no matter what expert on TV, financial commentator, or FedTrader amateur stock guy says, we never want to try to outsmart the market.   If you go rafting on the river, you can’t fight the current.   To that end (or beginning?), the SP 500 has been on a very strong uptrend all year long, and the recent developments in Artificial Intelligence (AI) will (my opinion) propel its many tech related stocks farther upward.

If we look at the SP 500 (technically, S and P, but…) index, it is now basically a big “tech index” – https://www.slickcharts.com/sp500

Outside of the obvious chip stocks, we see many companies loosely categorized in the “science” category, and then you have energy companies.   Arguably, this index has become a STEM (Science-Technology-Engineering-Math) Index.

My personal proprietary based system indicates that the top performer in coming months, out of the TSP funds, indeed will be the C-Fund.

Note that the SP 500 has hit new highs, hitting 5500 on the index:

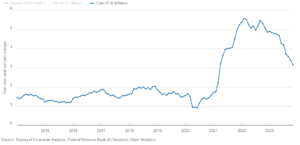
Fueling this is overall optimism in the economy, in which hard data indicates inflation (NOT COUNTING food and energy prices) is coming down.   This has led to warm feelings that the Federal Reserve will continue to lower interest rates.    Lets look at both PCE inflation and Core CPI inflation charts below:


Indeed, the summer has gotten off to a good start.   Being one to always try to stay educated on TSP matters, I came across this article, published at Federal News Network:  https://federalnewsnetwork.com/federal-insights/2024/05/how-to-maximize-your-tsp/

In it, they state:   How to make a customized & optimized L Fund: First off, only use the C & G Funds. These are the only two funds which are worth it. Secondly, keep it simple:. You don’t need to worry about adjusting your C/G asset allocation ratios every single year. Follow this simple risk tolerance chart of our recommended re-allocation strategy.

Gee, I thought moving funds around in your TSP was an evil and a felony act.  How many times was the flock told to “Ride it out” and “Set it and forget it.”    I have talked allocation (NOT market timing…) since I started this site.   Further unsavory was “using the G-Fund” as a tool in your tool box.  Again, something I have supported for many years.

The article indeed is informative, please take a look yourself if you wish.

That is all I have for now.  Again, I am personally 100% C-Fund until further advised.

Thank you for reading and please share with your friends and colleagues.   If the graphics in this post do not appear, please go directly to the site itself:  https://www.thefedtrader.com/

– Bill Pritchard


Spring update: Market continues to Perform


Hello folks

Bottom Line Up Front:  I remain 50% S-Fund, and 50% C-Fund, a position I have held since June 2023.   This is my personal TSP allocation- let’s talk about my view of the markets and my thought process behind my own personal TSP decisions.

Note:  If the graphics/images in this post to do make it past your email spam filters, please proceed directly to the website itself to view this update.  Link: https://www.thefedtrader.com/

Also, to help reduce the chances of these updates being sent to you spam folder, please adjust your email settings (Outlook:  Rules Wizard, Yahoo/others:  “create a filter”) to send all email from The Fed Trader to your inbox.  If you need help, some articles exist via google search that explain how to do this.

Ok, moving forward…as stated in the title of this post, the markets are doing outstanding as we close out the first quarter of the year.   Some may recall my prior January post, in which I discussed above average volume.   This continues, carrying the trend of the market upward.   (We will get into “why” shortly)

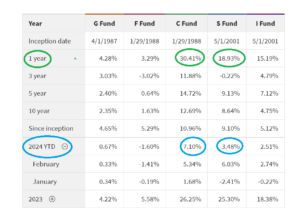
Since June, I have been 50% S-Fund and 50% C-Fund, and most followers of this free site are in a similar allocation.   Which is great, as (drum roll…) out of the “core” TSP stock funds, the C and S funds happen to be the top two performers:

I performed an analysis of the multiple funds, and my conclusion is that for the next three to six months, the S-Fund and C-Fund will be the best choice.   The I-Fund has shown some positive signs also, however I think domestically (at least for now) is where the action is at.   Hence, I continue to be in the S-Fund and C-Fund.

Driving all of this are the same, familiar themes: The economy, inflation, and interest rates.   Any political instability we may see towards the end of the year indeed may impact the markets, but until my technical and chart analysis tells me otherwise, I am remaining fully invested.

Inflation data, Core CPI notably, is down 42% from its 2022 highs.   “Wait, what?”   Yes, that is correct.   Core CPI is down 42%.   See chart:

The Federal Reserve’s goal is to see inflation fall to 2%, at which point, interest rate hikes will be halted completely, even lowered.   A review of data from the March 20, 2024 FOMC meeting (link:  https://www.federalreserve.gov/monetarypolicy/fomcprojtabl20240320.htm) it appears they feel Core PCE (another inflation measure) will be achieved in 2026.  Not an entirely bad thing, as “mid-2024” is rapidly approaching.   However if this is like any other federal agency I am familiar with, public statements are usually very conservative and aligned with the concept of under-promise/over-deliver.   By my estimates, using Core CPI as the benchmark, at its current rate of improvement, using Sept 2022 as the starting point, I estimate 2.0% Core CPI to be achieved by early 2025. 

In summary, so far this year, we have seen positive economic progress, with the markets resoundingly voting its satisfaction via the strong uptrend see in large cap and small cap stocks.

With that, I will conclude this update.   Again, I am 50% S-Fund and 50% C-fund.

If you know someone who may benefit from being subscriber to my updates, please share my website with them.

Thank you….

-Bill Pritchard
2024 begins – S&P 500 hits record High


Hello folks and Happy (belated) New Year

Bottom Line Up Front:  I remain 50% S-Fund, and 50% C-Fund, a position I have held since June 2023.   This is my personal TSP allocation- let’s talk about my view of the markets and my thought process behind my own personal TSP decisions.

Note:  If the graphics/images in this post to do make it past your email spam filters, please proceed directly to the website itself to view this update.  Link: https://www.thefedtrader.com/

2024 is off to quite the start.  Not sure how you feel but I can’t believe it is already time to take down the Christmas tree and keep those HOA letters at bay, those Christmas lights must come down.    The markets apparently feel the same way, it wasted no time to put December in the past.  By mid-January, it had reached new highs and demonstrated impressive gains.   Let me share some personal opinion regarding what I see happening…

Stock Market:

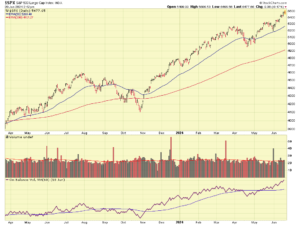
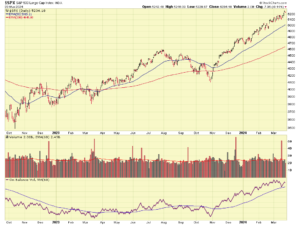
The S&P 500 recently hit a new 52-week high, on January 19, 2024, reaching 4842.07.   A closer look reveals that the market has recently gone higher than it has been in over 20 years.  The NASDAQ, primarily tech companies and smaller capitalization companies (S-Fund members) hit a new two-year high.    Lets take a look at some charts:

Apparent in the charts is the strong price action, and volume action, in both indexes.   Apparently the institutional money feels good about the investing climate right now.

Inflation:

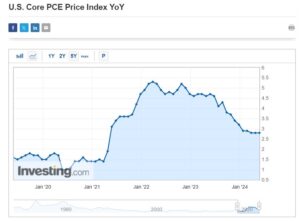
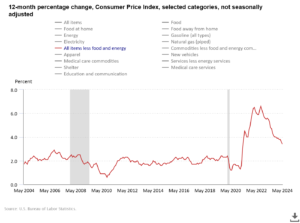
Both Core CPI, and Core PCE inflation data (the definition of which has been discussed numerous times on this site) reflect a downward trajectory for inflation:

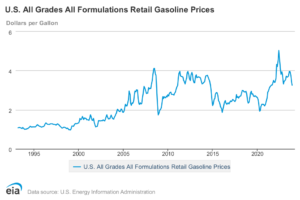
Both “Core” measurements discard the prices of Food and Energy, which are both volatile and change quickly.  The famous “Egg Inflation” situation in 2022, avian flu outbreak, which killed millions of chickens, is one example.   With that said, lets go ahead and look at nationwide gasoline prices, arguably a commodity the majority of American consumers directly pay for:

As can be seen, after peaking in summer 2022, prices have come back down, almost to 2008 levels.  This is even with the tensions in the middle east and other places.

Overall sentiment and mood of the consumer:

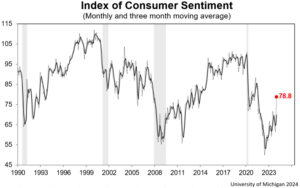
Consumer sentiment increased (improved) 13% in January to reach its highest level since 2021.   Consumer sentiment has been improving since late 2022.  Consumer’s apparently believe that inflation has turned a corner and have recently improved income expectations.   University of Michigan (who compiles this data) Chart:

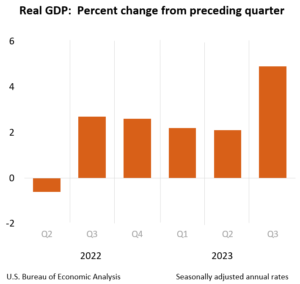
Gross Domestic Product (GDP) data is also improving.  GDP measures the value of the final goods and services produced in the United States (without double counting the intermediate goods and services used up to produce them). Changes in GDP are the most popular indicator of the nation’s overall economic health.  Chart:

So in light of the above data, I feel confident to continue my allocation of 50% S-Fund and 50% C-Fund.  This “early” into the year, I feel this is the right balance.   In a few months I may modify my allocations but until then, I am in the S and C-Funds.   Note that this is an election year, as we get into mid-2024, the market behavior may change (or not).   An interesting indicator, with a record of being correct 85% of the time, is the Presidential Predictor, developed by Sam Stovall:  2012 article:  https://www.businessinsider.com/stovall-stocks-predicted-president-with-88-accuracy-2012-11

According to this indicator, a S&P 500 rise from July 31 to October 31 traditionally has predicted the reelection of the incumbent person or party, while a price decline during this period has pointed to a replacement.  Again, this indicator has an 85% accuracy record, so it bears paying (some) attention to.

Thank you for reading…I will keep the updates coming when significant events warrant them.   Please continue to share this website/email blast with your friends and colleagues.

-Bill Pritchard
Website main link:  https://www.thefedtrader.com/

November 16 Update – Markets continue to improve


Hello Everybody

I remain 50% S-Fund and 50% C-Fund.

I wanted to go ahead and update things, as the markets have been seeing great performance since late October.    This serves as another reminder that the TSP is not for “trading” but indeed, my opinion, and how I handle my own account, is I try to be aware of what economic changes and market forces exist that may tend to create the best chances of success for a particular fund.   With that said, anyone who “threw in the towel” and went to the G-Fund after the very unfortunate Hamas attacks on Israel, on October 7, has missed quite a few positive days in the markets.   This event, what I could call a “Black Swan”, is not something I personally change TSP allocations for.

Additionally, contrary to belief, inflation is ticking down, and the data supports that thesis.  Average national gasoline prices are back down to 2012 levels.  See chart:

This should serve the travel industry favorably:   Lower fuel prices encourage budget conscious travelers to travel, which then helps hotels sell rooms.  Airlines also of course benefit from lower fuel:  this holiday travel season is reported to be the biggest in many years.

“Core CPI”, which is inflation data without food or fuel, is down also.   Again, this is cold hard data and hard to refute.   See chart:

“It is not at 2020 levels (1.2%)”   Of course not.  In 2020 the entire planet was shut down due to COVID, and nobody was out consuming or spending much.   When things opened back up, a sudden demand-spike on existing stockpiles hit, all at the same time.  2020 is nobody’s “fault” but from an economic standpoint, we cannot compare today’s environment to 2020.   The FOMC wants to drive inflation back down to 2% which is a normalized and accepted level.   So far, with inflation in a downtrend, the sentiment on Wall Street is that further interest rate hikes are paused or even cancelled.  

Lets take a look at the final, and most important, barometer of all, the market itself.  I use the S&P 500 as my benchmark index.   Lets look at a 1.5 year chart, then a 3-month chart, then a 3-month chart with my annotations made to it.

As can be seen, the index has seen numerous “Gap Up” days, indicating strength and bullishness.   Also note that accumulation or money inflows, by major institutions, is likely underway, reflected by the above average volume starting in late October.   The 52-week high, 4607, attained July 27, 2023, is possibly “within reach” as the index currently sits at the 4500 level.   4550 is the next hurdle, then 4600.

For the above reasons, I feel very confident in my current TSP allocation of 50% C-Fund and 50% S-Fund.

Thank you for reading and I hope everyone has a great Thanksgiving holiday.

If the graphics in this post do not appear (likely due to email systems blocking images or HTML), please click on this link and just read the post from the website itself: https://www.thefedtrader.com/

Thank you again

-Bill Pritchard


Fall 2023 Update – Are we in a recession yet ? POLL at end…


Howdy Folks (that is Texas A&M-speak for Hello…)

No, not many posts from me over the summer, my “second job” / retirement job had me busier than I anticipated, and just could not devote the required time for quality posts here.   I did indeed watch the markets daily, and have made no changes to my current TSP Allocation of 50% C-Fund and 50% S-Fund. 

“Bill, the world is ending, and things are spiraling out of control.   Are you sure about this investment allocation?”

Good (and frequent) question, one I get posed to me in person, email, or via social media.   I too am guilty of worrying, to a degree, about world, and domestic, events.   However, Black Swan events are something I do not respond to, discussed in these prior posts, dating back to 2013 (gee, feeling old, ten years ago…):   https://www.thefedtrader.com/?s=%22black+swan%22

For quick reference, a Black Swan event, is defined by the CFI Institute as being is an extremely negative event or occurrence that is impossibly difficult to predict. In other words, black swan events are events that are unexpected and unknowable. The term was popularized by former Wall Street trader Nassim Nicholas Taleb, who wrote about the concept in his 2001 book Fooled by Randomness.

I do not change investment allocations in a reactionary move to these events.   Post-event, economic and financial market deterioration- sure, I might.   Event-itself ?  No changes.   This is a great time to remind the readership that contrary to (some) popular belief, no, I do not “day trade” my TSP.   General reminder that I simply seek the best performance at all times.   Sometimes “zero return” is indeed a better performance than -10% (negative ten percent).

With that said, this year (2023) has been the longest not-happened-yet recession that has ever been predicted.  I too, am guilty of quasi-predicting the “looming recession.”   I spoke of recession-like environment in prior posts.   Yes, gas is high.  Yes, true, inflation is upon us.   But– COVID is in the past (shocker, contrary to the doomsayers on some media outlets), in many industries, people are back at work, if not 5 days a week, at least via hybrid schedules, Zoom stock is at all time lows, roads and highways are witnessing traffic like never before, airports and TSA lines are crowded, and any given weekend, you can drive past a soccer field and games and kids are out and active.    So, me, myself ?  I am not so sure “the world is ending” or that financial doom is lurking around the next corner, like an evil bogeyman.   Lets back my opinion up with some data…

Inflation – Yes it is up, but…

Inflation is indeed up, but it is coming down, however so slightly.   If we look at recent “Core CPI” (food and energy prices removed from the data, due to its volatility), the Core CPI is coming down:

Most recent Core CPI reading comes in at 4.1%, much lower than peak readings in late 2022 above 6%.   Indeed, some of these higher readings in 2021 and 2022 were likely downstream by products of COVID:  closed factories, supply chain issues, resource scarcity (and higher prices).   Flash forward to late 2023, and inflation is coming down, on a downward trend since Sept 2022 peak.   So we are headed in the right direction, inflation-wise.

Oil Prices:

Related to inflation, but not counted in Core CPI, but yes still important, are oil prices.   “Gas prices” impact just about every American who has to drive to school or to work or to the store to buy milk.   Oil prices, too, are down.   The sad and tragic recent terrorist attack on Israel by Hamas sent oil skyrocketing, but only briefly.   Lets take a look at recent Crude Oil prices:

Crude hit $95 a barrel on Sept 28, 2023. Previously it traded in the $70-$80 range, fairly reliably.   Yes, that is double the range it traded at in 2020, $30-$40.   But apples to apples.   In 2020, COVID hit-  schools closed, office workers stayed home, airliners got parked, cruise ships went to Port.    Did this result in a fuel shortage, or a fuel abundance?  COVID, hitting us in the Spring of 2020, didn’t even make us    Yes, gas got pretty cheap.   Will gas ever go back to 2020 levels?   What do you think?    In sum, I am not losing sleep over gas prices.   I, like everyone else, want it cheaper.   But will that happen?  Time will tell.    A good article about this is here:  https://read.oecd-ilibrary.org/view/?ref=136_136801-aw9nps8afk&title=The-impact-of-Coronavirus-COVID-19-and-the-global-oil-price-shock-on-the-fiscal-position-of-oil-exporting-developing-countries

The Stock Market

The ultimate barometer is the stock market.   “Price tells all” is a common Wall Street mantra, and it means the price of the underlying index or stock is the value of that stock, and includes all the information economic and otherwise that should influence the stock’s value.  Not future earnings, Forward P/E, forecasts, etc etc.   Right now, the price is X.   That is the value.     The value of 4200 on the SP 500 was an important overhead resistance level, the upward penetration of that back in June 2023 is what triggered my return to the S-Fund and C-Fund.   The markets then rallied, then dropped down some.  Important to be aware of is that per the Stock Traders Almanac, September is the worst month every year for the markets.   So September of 2023 was bad.   Do I panic and jump to G-Fund?   Or do I say, wait a minute, September is always bad, lets monitor things some more?    For me, I remain in the stock funds.   See chart:

We have another cool tool in the toolbox regarding recessions, produced by the St Louis Federal Reserve, titled  Smoothed US Recession Probabilities chart.   Smoothed recession probabilities for the United States are obtained from a model applied to four monthly variables: non-farm payroll employment, the index of industrial production, real personal income excluding transfer payments, and real manufacturing and trade.    When the chart value exceeds 1.5, it signals that recessionary conditions exist and a recession may be probable.   Going back 30 years, the following values existed prior to the subsequent recession a few months later:

November 2007:   1.78.    “Global Financial crisis” soon afterward, related to housing and banking.

October 2000:  3.52.   “NASDAQ crash” aka “Dot Com crash” soon after.

June 1990:  2.68  “Slow growth” recession after this- the country was still trying to regain footing after the 1987 stock market crash, Gulf War, Keating Five and Savings and Loan scandal

The current reading as of now?   0.20 (zero point two zero).  See chart:

With that said, I remain 50% S-Fund and 50% C-Fund.

POLL:

Is a recession looming?   I don’t know.   What do you think?   Please share your opinion in this Poll:   https://poll-maker.com/poll4965833x9bF3452D-152

Thank you for reading and talk to you soon.

-Bill Pritchard


Returning to S-Fund and C-Fund


Hello Folks

Preparing this post from my MacBook, so please forgive any font or graphics issues, the interface is slightly different from the Windows PC that I typically use.

On June 13, 2023, I submitted my request to the TSP site, leaving the G-Fund, and requesting a new allocation of 50% S-Fund, and 50% C-Fund.   This is my first TSP fund change since 2021 (so much for those who claim that this site advocates “day trading” your TSP).   A few reasons exist for this change, outlined below.  Note that at all times I try to remove emotion from investment decisions, and use data and facts to guide me.   This is harder than it seems at times…

-Inflation is subsiding, albeit slowly.  The Core CPI data (discussed in last month’s post) reflects that inflation is indeed coming down:

We have another inflation report coming out on June 30, 2023, the Personal Consumption Expenditures (PCE),  however I believe that it too, will reflect that inflation is subsiding, or at least not increasing.    Inflation is important, because the Federal Open Markets Committee uses inflation as a primary decision trigger for raising interest rates.

– “Implied Five Year Inflation Rate” as measured by TIPS or Treasury Inflation Protected Securities reflects that future inflation is expected to be lower:

– “Secondary indicator” of Gold (I always keep an eye on this) reflects that Gold prices are coming down from May 2023 highs, which (not coincidentally) is when stocks began to rally higher.   This is possibly reflective of major institutions re-allocating investments back into stocks, versus gold.  Again, “secondary indicator” sort of an back up to the back up kind of thing.

The markets themselves are rallying.   While I would prefer a more “broad based” rally, since about ten stocks are currently responsible for 90% of the S&P 500’s move upward, I must remind myself that it is a move nonetheless.   These same stocks are also members of the NASDAQ, so surprise:  The NASDAQ also goes up, and now we have a self-licking ice cream cone:  The S&P 500 goes up, then the NASDAQ goes up, people then celebrate the market is going up and start to move into stocks, sending the markets up even more.   At the end of the day however, the major indexes are up, and this is a positive:

You may recall earlier posts where I mentioned that “4200” was an important overhead resistance level for the S&P 500.  Indeed it was/is, and the index broke thru this on May 26, 2023 (see Gold comment above).   However I wanted to “monitor things” and ensure this was not a one-off boost of energy by the index.  It was not:  The index continues higher and has hit 4375.

Furthermore, the 50-day and 200-day moving averages have performed a “cross over”, a very time tested “bull market signal”.   This has occurred on the Dow Jones Index, the NASDAQ, and the S&P 500 (see comments above about S&P 500 components also residing on the NASDAQ).

In conclusion, to reiterate, I am returning to the stock funds, 50% C-Fund and 50% S-Fund.  This is what I am doing for my account, and is not investment advice.

Most healthy new bull markets last for years, so I am not losing sleep over the “timing” of this move.  This new rally only really got started in mid-May.  If my TSP request is activated tomorrow, or next week, I am not really concerned.   My point is to capture long term trends.

FYI that some important dates ahead that may move the markets include:

June 14:  FOMC Meeting concludes, interest rate decision.  Most believe a “pause’ will occur.

June 29:  GDP Report, this reflects measures the value of the final goods and services produced in the United States.

June 30:  PCE inflation data is released.   This, along with CPI, is used by economists to assess inflation.

Everyone have a great day.  Remember, if you feel this site (or the emails…) help you understand the markets, please pass it to a friend or colleague and encourage them to sign up.   Also, please use the TSP Help Line if you need help navigating the new TSP site.

-Bill Pritchard
CPI report out on May 10


As mentioned in my prior post, the “CPI Report” will be released at 8:30 AM Eastern Time on May 10, 2023.   The important data we are concerned with is the “Core CPI”, which is defined as the change in prices excluding food and energy prices, which tend to be volatile. While food and energy are, of course, major parts of any household’s budget, core inflation is often seen as a better indicator of the underlying pace of price changes.

The number tomorrow, representing April data.   The various economic experts from the below institutions predict the following for April:

Comerica:  5.4%

Bloomberg:  5.5%

Cleveland Fed:  5.6%

Chart of prior reports:

Note that the lowest number this year was in February, coming in at 5.5%.   In my opinion, if April is not 5.5% or below, then the argument that inflation is subsiding, and thus interest rate hikes should slow, is out the window.   In other words, a Core CPI above 5.5% will in most probability send the markets further down.    Perfect world, we see 5.4% or lower. 

The link for the official release is here:  https://www.bls.gov/news.release/cpi.toc.htm

Here is where to look for the Core CPI number (it will also be the hot topic all day long on CNBC….) :

Hope everyone is doing well- lets pray for a solid uptrend in the markets later this year.

-Bill Pritchard