This past week in the markets was very good, with the S-Fund outperforming all funds, and C-Fund taking second place. There are no indications that this performance will change anytime soon. As we enter Christmas week, trading will be light, as the U.S. securities markets will be closed at noon CT on Tuesday, Dec. 24, closed on Wednesday, Dec. 25 for Christmas and closed on Jan. 1 2014 for New Years. I personally don’t see any huge market volume or activity coming back until Monday, January 6, 2014. In other words, December’s action, for all intents and purposes, is “over.”
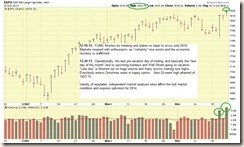
On Friday, Dec 20, the SP 500 index closed up on huge volume, hitting a new 52 week high of 1823.75. See Chart:
As reported in my November 5, 2013 post, December is historically the best performing month out of the year, and while it got off to a rough start, I am quite pleased on how things have turned out (again, December is basically done now, trading-wise).
It should be noted that on Sunday, Dec 22, the International Monetary Fund (IMF) made news by stating that it believes that the US economy is expanding faster than previously thought, and expressed a positive outlook for 2014. This news was via statements by IMF Director Lagarde, and not in the form of an official press release/etc. However, this has the potential of lifting the markets even further. Readers will recall my prior hospital patient analogy, regarding the recovering US economy, and not shocking is the fact that we are starting to see independent reports and data confirm my prior statements. I had the pleasure of eating breakfast recently with a Regional VP (for my geographic area) of a major US shipping company (I won’t name it but they paint everything one color). This person reports directly to the HQ in USA. Sometimes field interviews are much better than fancy reports, charts, and economic theories, and being on the street is where you see what is really happening. I asked him “how did 2013 work out” and “are things coming back, from your point of view” and his response was overwhelmingly a “yes.”
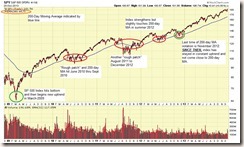
I have had some great reader mails, thank you, and a few have asked the legit question “is the market’s run is almost over.” This is based on the observation that the SP-500 Index has been in an uptrend since basically 2009. While true, it has only really taken off since November 2012. I base my opinion, on two things, the use of the 200-day Moving Average as a trend signal, and the price of gold. The financial industry typically views a penetration or “touching” of the 200-day MA as being a bearish signal, reflecting that the market/index is not fully healthy. As my chart (with comments) below shows, not until 2013, did the index NOT touch the 200-day MA the entire year. See chart:
In addition, I use the price of Gold as a secondary indicator (remember, the market itself is #1 indicator) as to how things are playing out. Gold, is the “safe haven” for major market players in times of economic turmoil, war, or when fear is in the air. Money is believed by some (me included) to be like fluids, and when fluid flows from one “container” (Gold, Bonds, Stocks, etc.) this means that it must flow to another container. Students of fluid dynamics and system dynamics believe that one component of a system affects other components, similar to a heart which determines how fast your legs can run. The heart may be more important than your leg muscle, and both need each other for a successful run. With that said, many believe that money (fluid) leaves Gold when equities/stock markets are recovering, and further invests in stocks, thus sending them higher, and when stocks are doing bad, money goes elsewhere, to other investments such as Gold. Gold is also important as it is the “default” currency, worldwide.
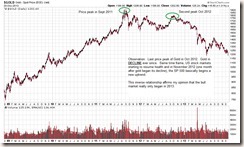
The last major price peak of Gold occurred in October, 2012, and its price has been on a decline since, reflecting money outflows, and inflows into something else. Note that since 2009 until October 2012, while the markets, yes, were up, Gold, also, was up, indicating that the world was not quite ready to dive head first into the stock markets. In addition, 2009 up until Nov 2012, the SP 500 index had a couple of “rough patches” and violated the 200-day MA. See Gold chart:
However this apparently changed in November 2012 (one month after the peak in Gold prices), as this was the start of a new uptrend in the SP 500 index, and in January 2013, after assessing the November and December behavior, and post-Fiscal Cliff resolution, I made the decision to return to the S-Fund. Many of my readers have mirrored my TSP moves, and we all enjoyed a great 2013. It is my opinion that the current bull market only “really” began in November 2012, and that 2014 is likely going to be a good year.
My TSP Allocation remains 50% S-Fund and 50% C-Fund. I hope everyone has a Merry Christmas and Happy New Year, and I will see everybody after the holidays. Thanks
– Bill Pritchard


