Good evening folks
Today, Jan 15, was a very good day in the markets, as was yesterday Jan 14. Monday Jan 13 was pretty dismal, with a large sell off on above average volume. Jan 13 was clearly a “red flag” day and not something we want to see occur often. As can be expected, many naysayers and market bears came out taking credit for predicting the “coming crash” etc. nonsense, only to have things rebound the next day. Aforementioned naysayers then disappeared back into the shadows. The market continues to turn on a dime from one day to the next, so it is helpful to analyze things not only from a daily view, but zoom out to a weekly-monthly-quarterly view, to get a better snapshot of behavior. For additional understanding of this, take a look at my March 1 2013 post, regarding “report cards.”
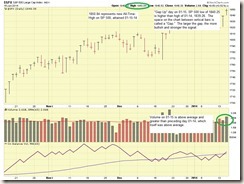
Volume on Jan 14 was above average, with the index closing up for the day, then on Jan 15, volume was even greater than Jan 14 volume, with another close up. This behavior is consistent with institutional money flowing into stocks, such as money managed by mutual fund managers, hedge funds, retirement programs such as the TSP and state employee pension plans. This is the money that moves markets and “primes the pump” for continued upward action, so it is critical that we monitor volume and price action in the markets.
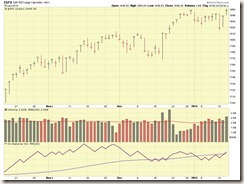
With that said, on Jan 15, the SP 500 index (my default index for monitoring the health of the market) had a “Gap Up Day” in which the low price of Jan 15, 1840.25, was higher than the high price of the prior Jan 14 trading day, 1839.26. This causes a “gap” to appear on the price chart. This is a very bullish signal, and if the fundamental and economic factors are bullish (they are, things are recovering), this in almost all cases is a “buy signal” or at least a huge vote of confidence for bullish market conditions. See charts below, one without comments, one with comments:
As a result of the prior two day’s action, my concerns which existed on Jan 13 have subsided to some extent, but not completely. This is due to the “January Barometer”, a concept developed by Jeffrey Hirsch and discussed in his book The Almanac Investor, of which I have copy (now worn out). The January Barometer, with an accuracy rate of 90%, is an indicator in which every “down January” precedes the rest of the year going down, or flat, for stocks. An “up January” precedes an up year. Down or flat is not good, and so far this January has been mostly flat. We are only two weeks into the month, so lets keep our fingers crossed. The action on Jan 14 and Jan 15 may be what we need to light the firewood.
Regarding the TSP Funds, the S-Fund and I-Fund are the top performers right now, with the I-Fund outperforming all the other funds (so far) this month. Before anyone is quick to pull the trigger on fund changes, my opinion is lets allow January to close out and then assess things. My personal TSP Allocation remains 50% S-Fund and 50% C-Fund. EDITED on 01-15-14 9PM
Once again, “thank you” for all the great emails, and please continue to share this site with anyone who will benefit.
Thanks guys
Bill Pritchard


