Hello Folks
As most are aware, Friday April 4, and Monday April 7, were challenging days in the markets. The tech-heavy NASDAQ was hit hardest, due to weakness in Biotechnology and Internet related companies. That is why I utilize the SP 500 to assess market health, it is a broader picture of the market, across numerous sectors. However, to be clear, all indexes saw above average volume, and downward price action, which is something we do not want to see. For a variety of reasons, outlined in this post, I am remaining 100% S-Fund (for now).
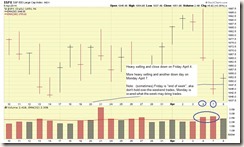
Observe that April got started on a great note, making new highs every day of the month, up until Friday April 4. Also observe that Friday and Monday arguably carry some additional psychological weight to them, Friday is the “pre-weekend” day, as in, “lets sell our holdings, I want to sleep easy over the weekend” and Monday is the “pre-rest of the week day”, as in, “I am worried about the week, I am selling everything on Monday.” If this does not make sense, let me explain it another way: I would be more concerned if we had down days on above average volume had they occurred Tuesday, Weds, or Thursday. We have heard “totality of the circumstances”….I apply it to trading also. If a down day or days occur, I step back, and try to see a bigger picture before I panic.
Lets take a look at a chart of the SP 500, with daily volume and price action, along with my comments on the chart:
This “close up” view of the SP 500 clearly shows the downward price action on Friday and on Monday. However, it also shows that the Tuesday April 8 action “found support” basically at the 50-day Moving Average, an important trend indicator. Support found at this indicator is a positive sign, and reason to not completely panic yet.
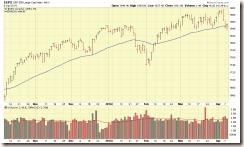
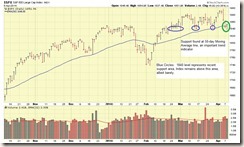
Lets take a look at a longer term chart:
Observe in the above chart that the 1840 area on the SP 500 is clearly an important support level, and bears watching, as does the 50-day moving average.
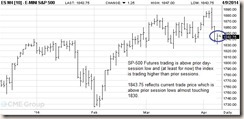
After the daytime session closes on the markets at 4PM Eastern Time, I tend to seek out additional “intel” on how the next session will trade. One great tool I use are the SP 500 futures, which trade almost 24 hours, electronically, and are frequently indicative of sentiment and how the stock markets will trade the next day. Fortunately for the TSP participants, tonight’s SP 500 session is trading positively. See chart:
My explanations above reflect why I am remaining 100% S-Fund. Allow me to be clear: All the indexes (and funds) took a beating over that last few days. I can’t sugar coat that or spin the news, it is what it is. This site is about facts and analysis, and I am required to report accordingly. The S-Fund got hit pretty hard, due to small-cap and NASDAQ exposure. However, the overall trend is still intact (for now). The market itself is our ultimate indicator, and I try not to crystal-ball or offer theories on why or what is happening. If the market continues down, on high volume, then we need to evaluate a move to G-Fund.
However, I am not there, yet, and remain 100% in S-Fund.
Thank You for reading and talk to everyone soon…
– Bill Pritchard


