Hello everyone
I am changing my TSP to 100% G-Fund. I wanted to be optimistic and look for some rays of sunshine behind last week’s market storm, however I (sadly) cannot find any. The market is our ultimate indicator- theories, crystal-balls, opinions, or for that matter emotion, should not drive our investment decisions or strategy. Allow me to post some charts and share my opinions behind my move to 100% G-Fund.
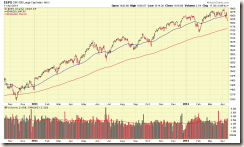
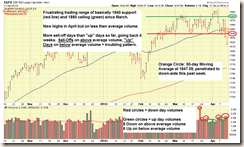
Lets take a look at the 18 month view of the SP 500, below, then a 6 month chart along with my comments below (and on the chart).
As can be seen, we have been in a trading range since basically late March, on the SP 500, with 1840 being the bottom or support level, and 1880 area being the overhead resistance level or ceiling. Any penetrations of these levels are important to look at. We had some new highs established on the SP 500 early this month, however this was on below average volume. I mentioned this activity in my April 3 posting.
With that said (and by now, most everyone has an understanding of why volume is so important…) , the new highs were on below average volume, and then things broke down and deteriorated. The SP 500 then broke down thru its support level of 1840, on above average volume, something clearly not desirable. I counted 8 days of selling in recent weeks, on above average volume, with 6 days of buying, on below average volume.
In addition, the SP 500 failed to find support at the 50-day Moving Average, an important short-term trend indicator, and activity below this level is not desired. It is still however a healthy distance from the 200-day Moving Average indicator, which is a longer term indicator that major institutions sometimes make buying or selling decisions at. Ideally, it stays away from the 200-day and finds support somewhere.
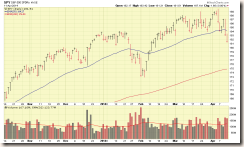
Sometimes the volumes on the index are hard to “decipher” so allow me to insert a chart of the ETF (Exchange Traded Fund) ticker symbol SPY, which “tracks” the SP 500 index and can be actually traded back and forth by investors. It is one of the largest holdings in many big-name mutual funds. I will not post comments, as nothing is changed from my discussion of the SP 500 Index. However take a look at the volume behavior going back a couple weeks.
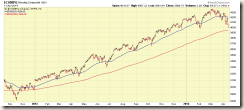
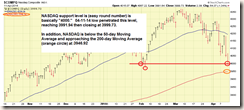
Now, with my primary market indicator, the SP 500, having been addressed, lets take a look at the NASDAQ Index. As I have mentioned before, the NASDAQ tends to be tech-heavy, and if Apple Computer reports losing market share to Android, this can drive the NASDAQ lower. Does this mean the world is ending and the market is crashing ? No. However one must be cognizant that the NASDAQ is heavily weighted towards tech companies. With that said, the S-Fund has a lot of NASDAQ exposure, as most smaller companies are listed on the NASDAQ versus the NYSE exchange. Therefore, the NASDAQ cannot be ignored completely. Lets take a look at the NASDAQ 18 month chart and a closer 6-month chart with my comments.
As can be seen, the NASDAQ is below its 50-day Moving Average and close to its 200-day Moving Average, which is an important long term trend indicator and where many institutions and financial media tend to announce “bear market” territory for the respective index or stock. This can be dangerous, as some market prophecies can then become self-fulfilling. The market reaches bear market territory, and everyone then proclaims “yes, it’s a bear market” , and then everyone gets out of the market, thus pushing it down further. Then soon after, people say “I told you so, it’s a bear market” and the fear and panic feeds on itself. So the 200-day Moving Average bears monitoring.
The NASDAQ’s support level is basically “4000”, and on April 11, we saw a low of 3991.64 on the NASDAQ, penetrating this level to the downside, which is troubling.
For the reasons outlined above, I am moving to 100% G-Fund in my TSP. I might add these turning points in the markets are also periods of “increased” reader email. For every email I get saying “gee thanks, yes I feel better being out right now” I tend to get three that say “man, I sure don’t want to miss a good up day, I am going to wait a little longer” or “bro, we just missed a 200 point gain on the Dow, and we are in G-Fund, are you confident in your analysis” etc. Or variations of those. Sometimes people email me that “we are already down quite a bit, getting out now seems silly. Lets just monitor things.” Well, if you are #1 on the entry team, and Mr. Bad Guy puts one round (of many more soon to come) into your ballistic vest, are you staying in the same position ? I mean, your vest already stopped one round, why not “stay in place and monitor things.” I doubt anybody would really do that.
I appreciate the feedback, but remember it is not chasing gains that makes us money, it is minimizing losses. Minimize losses and errors, and the scoreboard will take care of itself. The TSP is not something to gamble with, it is the primary source of retirement income for FERS’s participants. Hence I have no issue sliding over to G-Fund when I see trouble brewing.
Some theories and opinions abound as to why the market is going down, some say QE Program being cut back, some say Congressional Mid-Term elections, I have heard numerous theories/etc. At the end of the day, evaporative water science, meteorology, rain fall statistics, etc., do not dictate whether I am using an umbrella. I am using one if I start to feel raindrops physically hit my skin and I see rain clouds overhead. The market itself, not theory, is the ultimate indicator.
Again, I am 100% G-Fund. Hopefully not for long…..
Take care folks
– Bill Pritchard

