Monthly Archives: May 2015

Markets rally higher on May 14

Hello Everybody

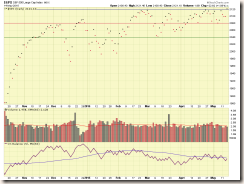
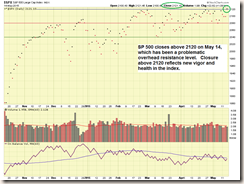
Continuing my current 100% S-Fund TSP Allocation, I am happy to report that for the first time ever, the SP-500 Index has finally closed above 2120, versus just break thru it, and settle lower, which it did on May 4.   A “close price” is the final price that market participants have “settled on” by the time the markets closed for business, which is important for determination of sentiment.    Lets take a look at two charts, showing “close only prices” reflected by dots.   This is a less common method of displaying market activity, but still very useful.   Observe my previously and often discussed levels at 2040/2080/2120.

SP-500-05.14.15-CLOSE-ONLYSP-500-05.14.15-CLOSE-ONLY-comments

The markets appear to be embracing the fact that the economy, while doing well, is not doing so well as to warrant interest rate hikes soon.  Remember the public declarations made in front of Congress and in published policy statements by the FOMC, focused on both PCE Inflation data and Unemployment/Jobs data.  Also remember Presidential elections are coming sooner and not later.  I doubt any major deviations from these public statements will be occurring any time soon.   Maybe, not impossible, but my opinion is we probably won’t see any rate hikes soon.

In my May 7 post, I opined on the pending May 8 jobs report:  My opinion, the desired numbers are 225,000 to 250,000 jobs added and unemployment rate of 5.5 to 5.7%.    The market should react very positively to those numbers.

The May 8 report was then released and reflected 223,000 jobs added, and an unemployment rate of 5.4%, very close to my personal estimates published prior to the report.   As previously stated, the market has indeed embraced this data, resulting (finally) in a closure above 2120.   NOTE:  May and June historically are frustrating months, the kind where you pull your hair out, due to erratic price action.   Knowing that indeed, this is “typical” behavior, I typically remain fully invested (versus “Sell in May” strategy).   Unless of course additional red flags or storm clouds are observed.   But a “rainy month” does not mean necessarily that a Hurricane is about to hit us, if one has historical patterns and data on hand.   Some additional trivia is Aug/Sept/Oct are the markets worst performing months, historically.   

On May 12, Greece adhered to their repayment schedule and made a payment to the IMF.   While it is still questionable whether they will be able to make additional repayments, this May 12 payment was at least reassuring.  In addition, Asian stocks have rallied, resulting in the first weekly advance in three weeks.   This will likely benefit the I-Fund, which has exposure to Asian markets.

I may make a TSP Allocation change later this month to reflect 100% I-Fund or 50% I-Fund and 50% C-Fund.   I will post any such change on this site.  

At the present time, I remain 100% S-Fund.  Thank you for reading and please continue to share this site with your friends and colleagues.    Again, May (and June) are frustrating months, lets “hang in there” barring red flags or abnormal and negative market action.

Talk to you soon….

– Bill Pritchard

May 7 PM update / Sideways action Continues

Hello everybody !

My current TSP Allocation of 100% S-Fund may change later this month of May, probably the third or fourth week of the month.    

It should be noted that the large cap stocks (represented by the C-Fund) are starting to outperform rather consistently the small and mid-cap stocks, on a domestic (non-international) basis.   When this occurs, it is important to look at other technical and fundamental indicators to get a “big picture” outlook on the markets.  Long story short, at the end of a bull market cycle, in almost all cases, the large caps are the “last to die”, and in many professional money management circles, this therefore is an important indicator of weakening bull market.   Why does this happen ?   One reason is large cap stocks are the inhabitants of thousands of mutual funds, pension plans, and hedge funds, these funds have literally billions of dollars invested.   These large funds, akin to cruise ships in the ocean, cannot “turn on a dime” and dump shares immediately.

Exiting holdings by these major players will occur over many month’s time, not one day or one week.   Some other reasons exist as to why this indicator is accurate, but I will save you the boredom, suffice to say that we need to keep an eye on this six-year old bull market, as it may be running out of steam soon.

Some other topics, are Greece and the Friday May 8 Jobs Report.

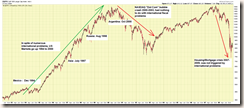
I won’t spend much time on Greece, as it is the same song: they owe money, they won’t pay under previously agreed to parameters, and they want to change the rules.   This has turned into a political mud wrestling match, with Greece, Germany, and the IMF all in the ring.    On May 12, Greece is required to make a payment to the IMF.  This is not contested and is without doubt, a payment is due on May 12.  Missing this payment, is considered in most circles, to put Greece into “default” status.   What will happen ?   As a trained investigator, I prefer to go to hard evidence, and historical patterns, versus just try to guess or crystal-ball things.    I went back to all the major, headline-issue, international financial crisis situations, all of which the US either paid money to help bail them out, or had our necks exposed due to US investment and business interests in those regions.   From the Mexico Peso devaluation, to Argentina, I analyzed SP 500 index “behavior” (remember, behind the markets are people) during the times of the above events.  Our crashes of 2000-2003 and 2007-2009 had no international triggers.  See chart:

SP-500-CRISIS

So, how much damage did these prior international fiscal crisis/scandals/events do to our markets ?  Very little.

With that said, the Greece issue is a hot topic.  Some argue that the interconnectivity, post-internet, of world markets, makes this situation “different.”   Others say nothing will happen.   Me?  I don’t know.   To be honest I am not so sure a default in Greece really “matters”, but the markets are going to do what they are going to do.    The I-Fund is starting to do very well, and the impact of a default in Greece, which will clearly hurt Europe,  on the I-Fund, is not known.   Contrary to what some erroneously believe, even if you are not in the driver’s seat in a car crash, you can still be hurt.  Heck, you don’t even need to be in the car.   Secondary crashes, flying debris, can hurt you also.  So, no, the I-Fund has no Greece holdings, but ripple effects and chain reaction events in the close proximity can still reach out and touch us.   The I-Fund could be impacted by deteriorating markets in France and Germany, both of which have large exposure to the Greek debt situation. 

Regarding the jobs report, due to be released at 8:30 AM Eastern Time on Friday May 8, we are looking at jobs being added, and at the unemployment rate percentage.   If we see 300,000 jobs added, that is very good news and reflects a very healthy economy.   If the percentage data for unemployment is 5.4% or less, that also is good.   However, good news increases the probability of an interest rate hike this calendar year.   Nobody wants bad news either, as employment is indeed a large engine of the economy, therefore 250,000 jobs added is being considered the “ideal amount” to reflect a healthy economy, while not prompting a rate hike.   The “preferred” unemployment rate is 5.5%, as this indeed reflects a good economy, but will likely not spur interest rate hikes by the FOMC.   My opinion is that getting 300,000 jobs added will be almost impossible, in light of the massive layoffs in the oil sector.    The oil sector, will be the hot topic regarding the jobs report.  My opinion, the desired numbers are 225,000 to 250,000 jobs added and unemployment rate of 5.5 to 5.7%.    The market should react very positively to those numbers.  325,000 jobs added and unemployment rate of 4.5% (the chance that the numbers on Friday are close to those is nil) will result in an almost guaranteed rate hike this calendar year, along with a market downturn. 

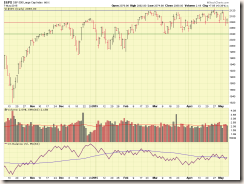
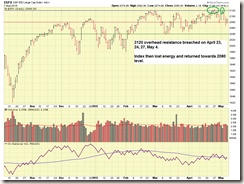
With that discussion behind us, how are the markets doing ?   The SP 500 showed some strength as April finished, breaking the 2120 overhead resistance level on April 23, 24, 27, and on May 4.   Since then, it resumed downward.   See charts:

SP500-05.07.15  SP500-05.07.15.-comments

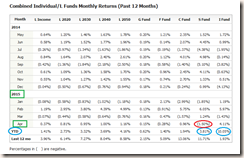
April TSP data has come in, and as expected and discussed on this site numerous times, resulting in yet another accurate Fed Trader prediction, the I-Fund outperformed in April.  The S-Fund, was negative, but we are looking at longer term, behavioral, trends, in order to determine appropriate fund allocations, and not single month numbers.  The I-Fund is overall YTD performer but some risk comes with those gains.  See graphic:

TSP-FUND-RETURNS

With that said, I may be moving 50% C-Fund and 50% I-Fund in late May or possibly 100% C-Fund.  At the present time, I remain 100% S-Fund.

Thank you for reading and please continue to share this site with your friends and colleagues.   I continue to be surprised by the huge numbers of new subscribers each month, and enjoy the emails that I get from the readership.   Thank You ! 

– Bill Pritchard