
Good Evening
We are now sufficiently into January 2019, with 2.5 weeks of trading action behind us, enough time for an assessment of the action. A development since my last post on December 22, 2018: the still unresolved government shutdown, a situation impacting almost all of the subscriber-ship to this website. For me (and speaking only for me, myself, and I…) the concept of “protect what you have” aka including the G-Fund in your toolbox of tools, rings loudly. Unless I missed a memo, folks are not receiving paychecks, nor are they making any TSP contributions, nor receiving agency matching. This is also why I advocate pushing the gas pedal all the way to the floor, when the conditions warrant, and pulling off the road when too many hazards are in the path ahead. Indeed this may not work for all, but it helps me sleep at night: having left the stock funds back in October, my TSP is largely intact as we enter government shutdown Day #32.
Indeed the markets rallied (some) since December 26, 2018. Many messaged me on Twitter or LinkedIn and asked if we are “missing out” on gains etc, but as I have discussed in the past, I am not day-trading my TSP, I am looking at larger trends, both on an economic basis (“backdrop” or the “climate”) and on a technical basis (chart patterns, trends, etc.). My usually broken crystal ball looks at 90-day to annual trends, not one day to the next. If the Dow drops 1,000 points in one day, sure that is an “attention-getter” but it only prompts me to look at larger scale action.
Moving forward, lets bring up some charts of the SPY Exchange Traded Fund (ETF). This ETF is a very popular “proxy” investment vehicle to the S&P 500 Index, my default market barometer, and provides excellent volume and trend analysis of things. Almost every mutual fund on the planet owns some SPY shares. Note that the Dow Jones Index is heavily watched by the financial press, but it is only 30 stocks and does not represent the overall market.
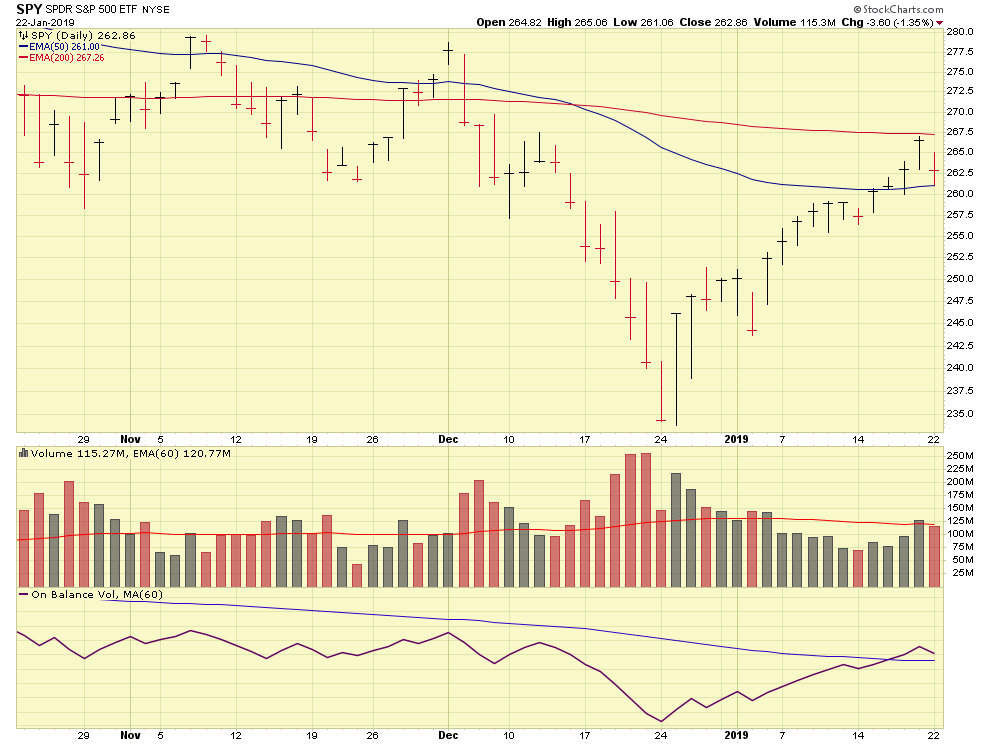
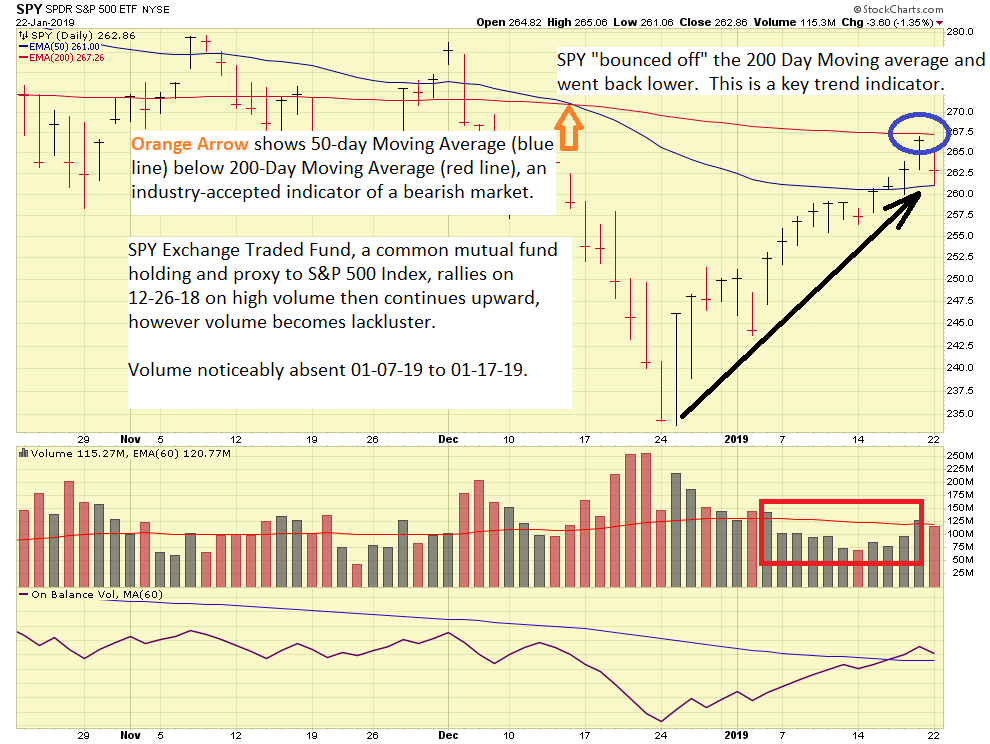
As can be seen above, there is a lack of trading volume from January 7, 2019 thru January 17, 2019. While markets can go down on their own (on low volume), they need volume to sustain vertical movement. Volume has deteriorated since the rally on December 26, 2018. Some have questioned “who” was behind the December 26 move, as most of Wall Street was out on Christmas break. One thing is certain, since returning from break, volumes have not picked up.
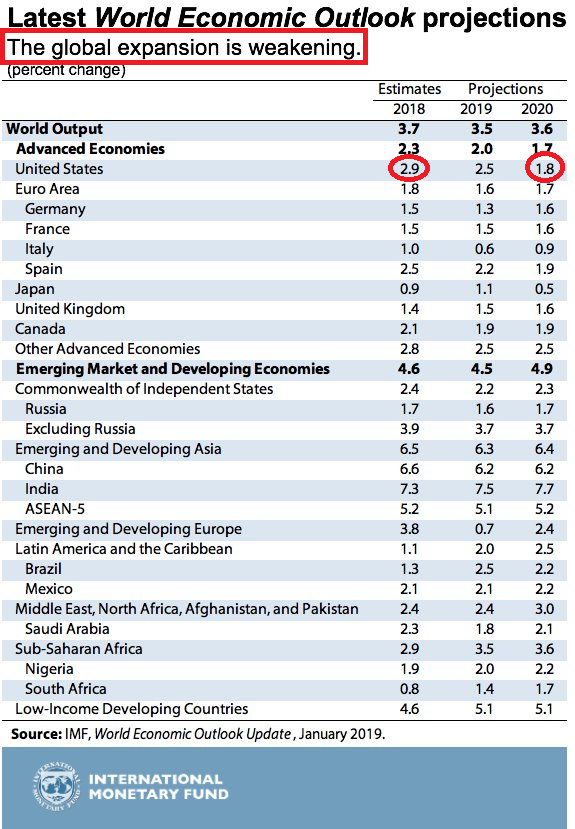
On the economic front, a few events have occurred since January 1, 2019. We are currently in the middle of the World Economic Forum, held each year in Davos, Switzerland. The largest concern appears to be a believed global economic slowdown, with a slowdown forecasted in United States, amongst other countries. The International Monetary Fund (IMF) recently released its World Economic Outlook, and stated that “…the global expansion is weakening and at a rate that is somewhat faster than expected.”
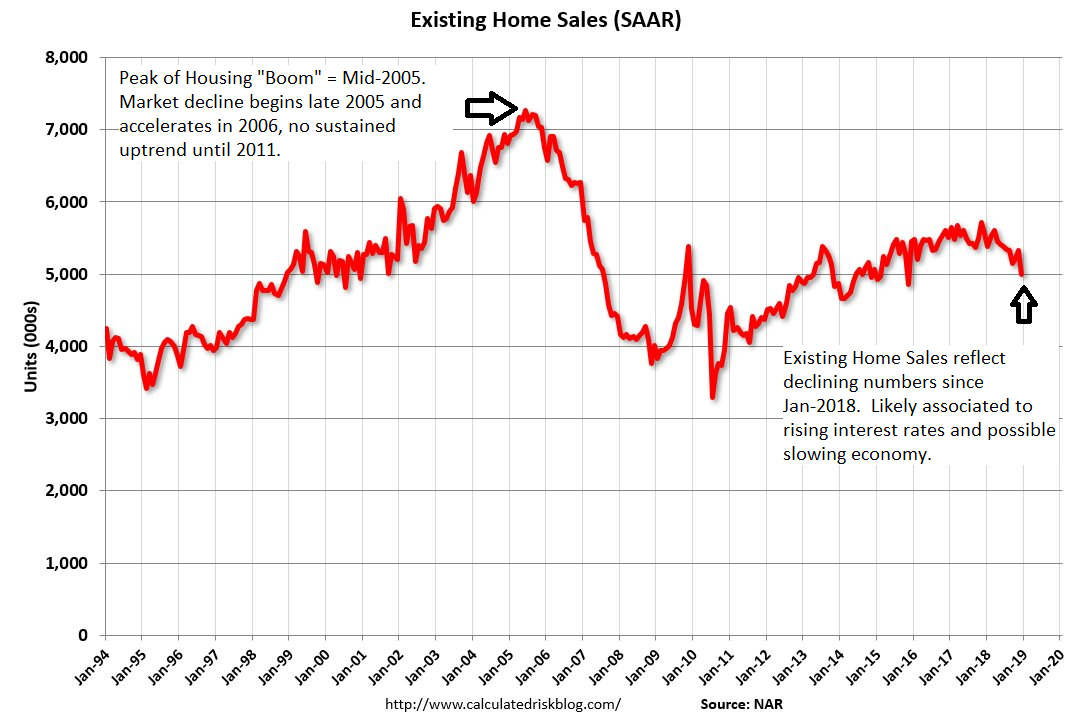
Additional negative signals exist, notably weaker housing data, with slowing home sales as reported by the National Association of Realtors (NAR) and a weakening in housing sentiment, as measured by the Housing Market Index, published by the NAHB, the National Association of Home Builders. My point: Two different real estate groups are both reporting a slowdown. Charts/Graphics below, including of the screenshot of my excel file.
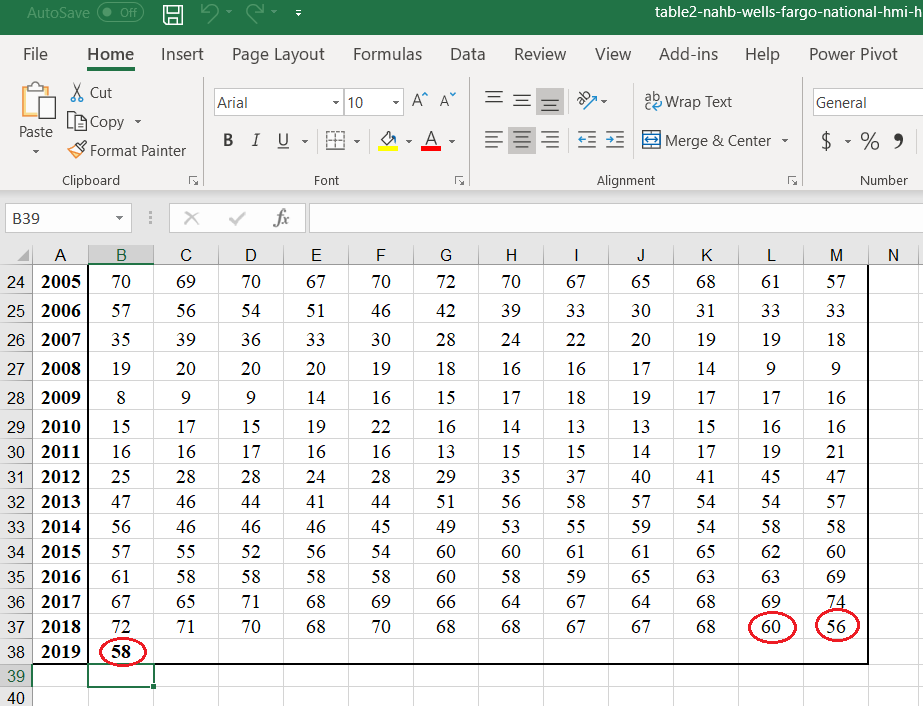
The excel file reflects deteriorating sentiment (scale from 1-100, the higher the more positive the sentiment) which began in November 2018.
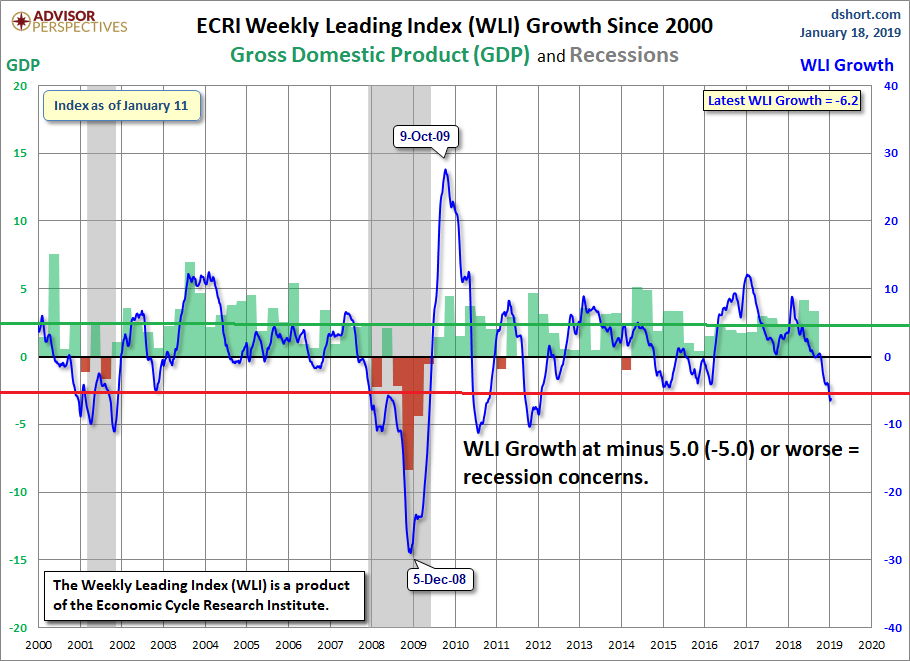
An additional tool that I have begun to embrace (never stop learning…) is called the Economic Cycle Research Institute (ECRI) Weekly Leading Index. This is a proprietary chart which has proven to be highly accurate at forecasting recessions. Note, historically the stock market will crash before a recession is declared, the declaration being the responsibility of the National Bureau of Economic Research. A primary component of a recession is negative GDP, which we do not have. Based on the behavior of the Weekly Leading Index, some concerns for a recession do exist.
Finally, political tensions continue to play a role in the mood of the markets. For the purpose of this category, I will include trade wars/tariffs. I will attempt to remain agnostic, however suffice it to say that grown adults (we are talking age 65+), from both parties, need to come together and work out a solution. A closed government, with employees literally “paying the price” for elected officials who cannot reach an agreement, is not the solution. I simply cannot see how a closed government solves anything. How are we expected to negotiate trade deals with China and make peacekeeping strides with hostile nations if we cannot even agree with each other in our Capitol ?
Some economists believe the shutdown costs the economy $1 Billion a day. Marriott International recently stated that they are seeing “double-digit declines” in occupancy rates in their hotels, and Delta Airlines stated (on Jan 15) that the shutdown had cost the airline $25M in lost revenue. This figure will likely be $50M+ if the shutdown continues. The human cost to employees and their families cannot be measured…I hope and pray that the shutdown is resolved soon.
In summary, my TSP remains 100% G-Fund.
Thank you for reading- if you find value and have benefited from my analysis of things, please share my site with your friends, coworkers, and colleagues.
-Bill Pritchard
