Hello Everybody
My last update was January 22, 2019, which means that we are more than one month (my average update time) between updates…my sincere apologies.
I am inclined to provide the “Sir Sandwich” answer (with “No Excuse” in the middle) which I learned as a young cadet at Texas A&M, 30 years ago (ouch), however I will add that my “off duty life” at this stage is pretty darn busy- I might as well put an Uber driver sticker on the family SUV. As such, some time has elapsed between updates.
Moving forward, my personal TSP Allocation is shockingly not any different from the last update. I remain 100% G-Fund. Before I share my opinion on what is driving the markets, let me say that my entry and exit criteria for the markets is largely summed up into a few simple concepts, one of which is “Has the condition/situation that prompted you to move [Into/Out of] stocks reversed?” Being able to clearly answer that question is important. This situation is assessed using both technical (chart) data and economic (fundamental) data, with the weighting towards the charts. Recall the market sell-off in February 2018, discussed in a prior post.
Back in February 2018, some asked me “why don’t you get out” or “isn’t it time for the G Fund.” As you may recall, I remained in stock funds due to my assessment of the backdrop, the bigger picture. The momentary crash in Feb 2018 subsequently reversed itself. The inverse question, and situation happening now (in my opinion) is (interestingly enough, one year later) that the markets are rallying. Now the questions I get are “Shouldn’t you get back in” and “Isn’t it time for stock funds.” However, now, like back in February, my opinion is that my current TSP Allocation should remain, for now, unchanged. Clear as mud ? Let’s talk about this and clear up some mud…
As discussed in prior posts, the major challenges to the markets right now (indeed, they are going higher: Elon Musk’s Falcon 9 rocket blasted off the pad pretty nicely also, but I am glad I didn’t hitch a ride) include the following:
Rising Interest Rates: a necessary evil when the economy is recovering
Trade Wars/Tariff Disputes with China: March-1 agreement “hard deadline” is now deleted, and progress is not clear
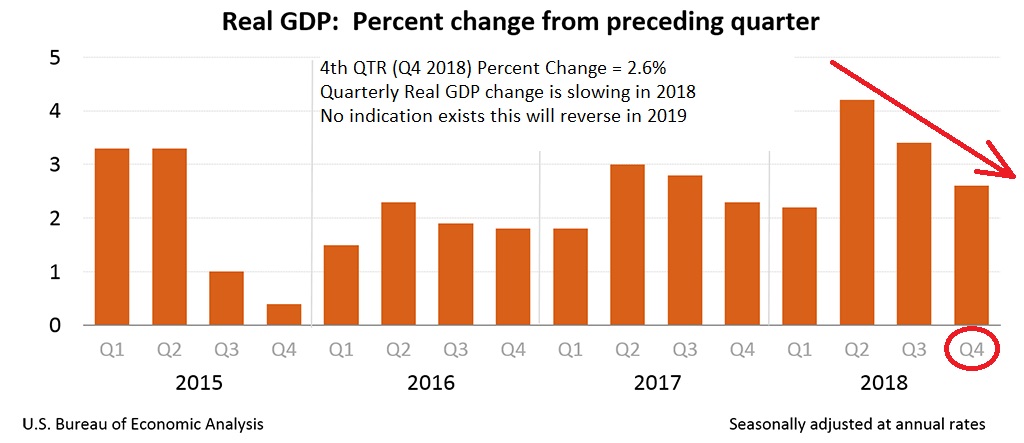
Slowing US Economy: Some data, specifically GDP and Housing data, reflects a slowing economy
Political infighting at all levels: “Just do your job” seems to be forgotten.
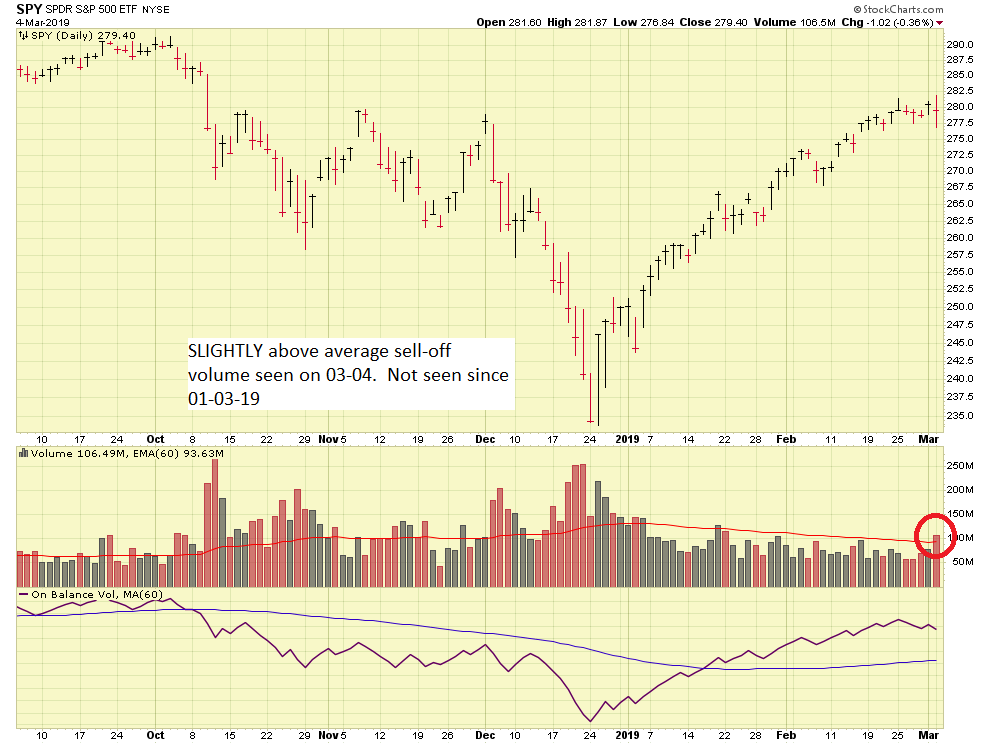
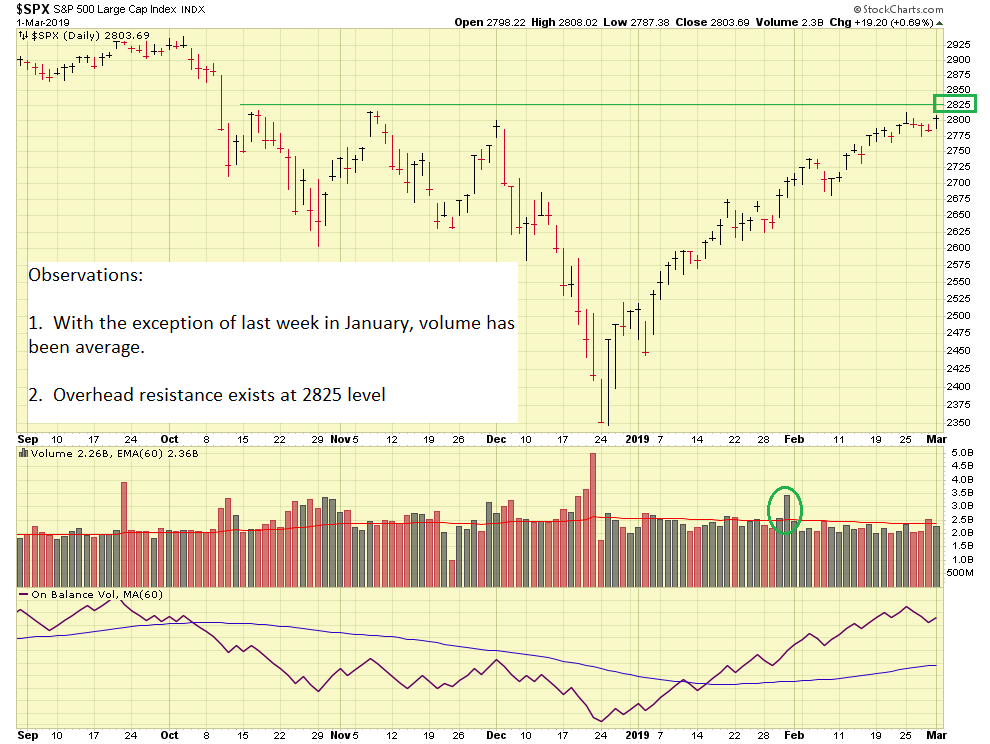
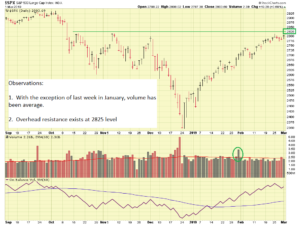
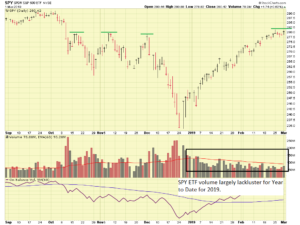
Let’s look at recent S&P 500 action, my benchmark barometer for the markets. This index contains 500 companies, both from the NASDAQ and NYSE, in a variety of industries, to include technology, energy, healthcare, and others. Here is a chart of the S&P 500 and the SPY ETF, which “tracks” the S&P 500 index.
“Bill, you sure are becoming a chicken, can’t you see the markets are up” a coworker grumbles to me as I reach for the coffee pot in the break room.
Plain as day is the fact that yes, the index is up. Also apparent, to me at least, is that volume is average. Without volume to sustain the action, things can fall apart. What Mr. Market gives, Mr. Market can very quickly take, if the volume is not there. Important to note is that the 2825 level is a key overhead resistance level. This level was approached in 2018 on October 17, November 7, December 3, and in 2019 on February 25 thru present. In all cases, the level was approached but not penetrated, with the index falling back lower. A positive, convincing penetration of this level, with a closing price at or above 2825 would do a lot for my confidence.
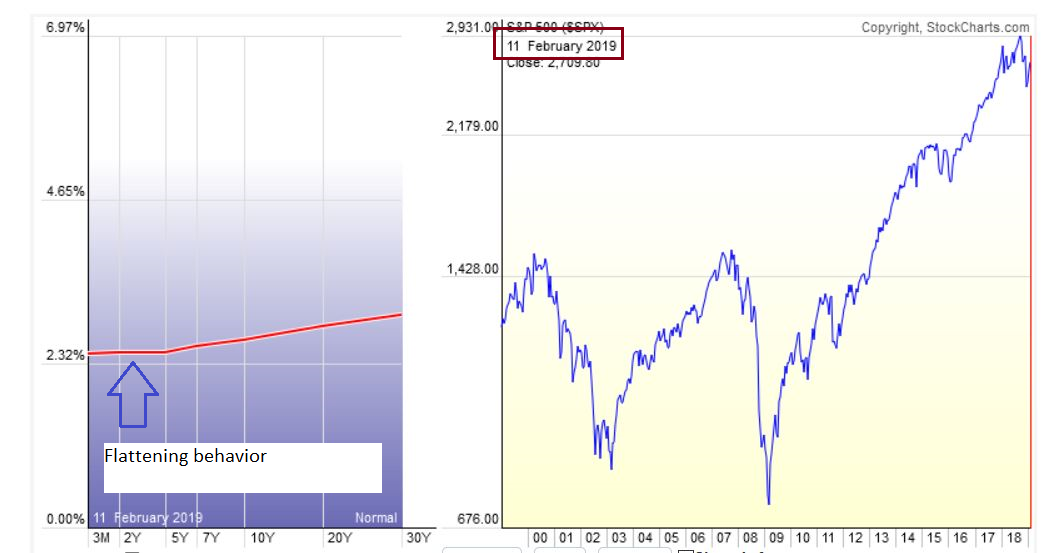
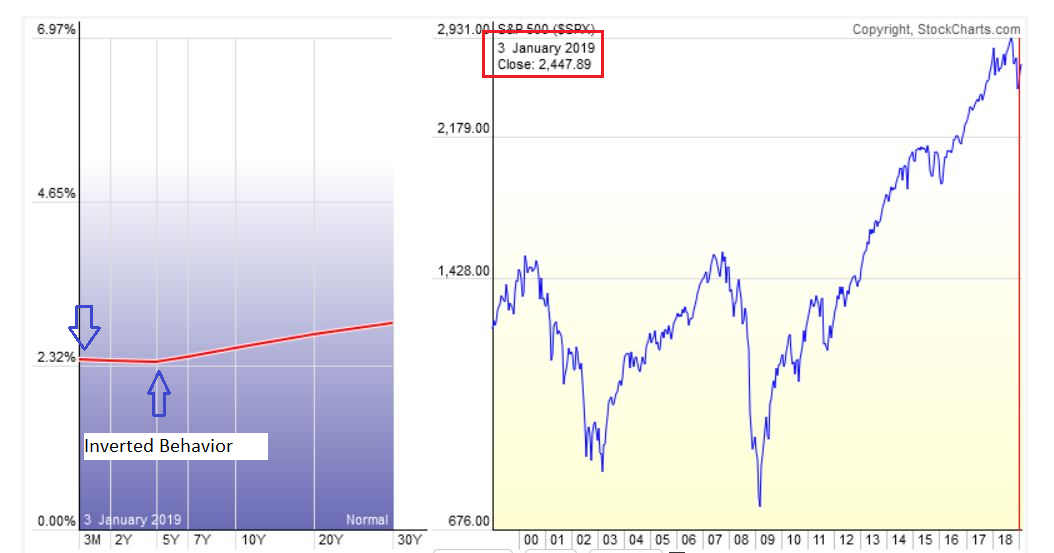
Let’s talk about some “backdrop” and “structural stuff”. The Yield Curve has displayed a tendency to “go flat” and “inverted” which is one in which the shorter-term bond yields are higher than the longer-term yields, which can be (not always) a sign of upcoming recession. Some recent images below:


For a pretty good unbiased explanation of this behavior, the Wall Street Journal has a video at this link
Moving beyond yield curves, less cryptic indicators include GDP and Housing data:
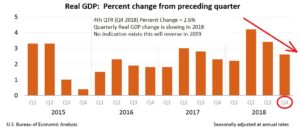
Due to the government shutdown, GDP data was delayed, however Fourth Quarter 2018 (4Q) GDP came in at 2.6% percent change, reflecting a slowing GDP growth for 2018, and ostensibly, a slowing economy.
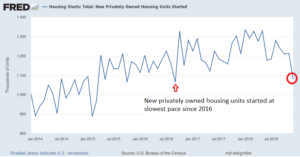
Moving into housing, home building starts fell to a more than two-year low in December as construction of new homes declined, the latest indication that economy may be losing momentum:
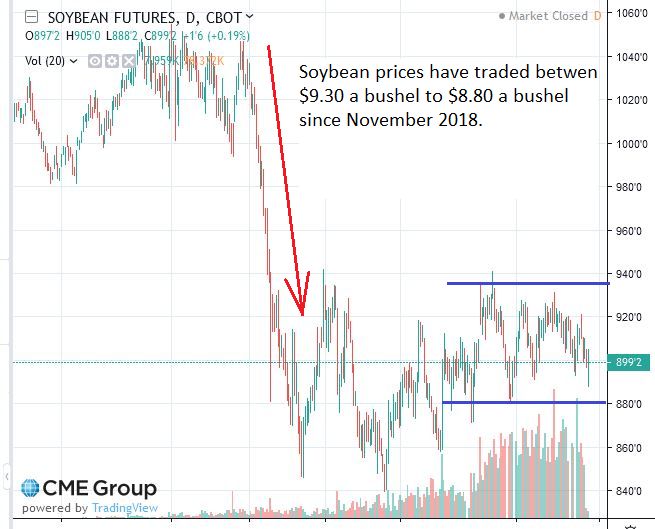
Now that I have touched on some economic red flags, let me discuss the US/China Tariff situation. As many know, some of the things President Trump wants is to stop intellectual property theft, prevent technology transfer, and desires additional US investment to be permitted inside of China. China’s only response so far is an agreement to buy more soybeans. This is being “presented” by politicians as a “good faith effort” by China but the fact remains that this was not part of the original proposal, nor is it known if US farmers can even produce the soybeans soon to be requested by China. “Hey we asked, they couldn’t deliver” may be soon heard inside China’s Presidential Palace. One would think credible pending orders and demand may impact prices- this “huge breakthrough” is being trumpeted as being good for the US farmer, but impact on soybean prices has been minimal:

Note that the previously discussed “hard date” of March 1 as a Chinese trade deadline is now two days into the past; missing a deadline is not a positive sign. The next round of talks is a reported “US-China Summit” on March 27, 2019, to occur in Washington DC.
In summary, I remain 100% G-Fund in my TSP. As a friendly reminder, what you do with your TSP is your business, if you feel you are “missing gains” or believe in your heart that G-Fund is not appropriate for you, that is entirely understandable. This free site represents my opinion and personal analysis of things. With that said, if the S&P 500 breaks 2825, and we have a US/China trade agreement finalized, and economic data does not worsen, I will most likely return to stock funds. I can almost guarantee you that over a hundred professional investment managers, controlling mutual funds, hedge funds, and large accounts, are thinking exactly the same thing. This may explain the lackluster volume in the markets. The year has started well, but I believe some bona-fide “other stuff” exists which may impact things. For those captivated by “strong lift-offs”, please look at Elon Musk’s Falcon 9 rocket lift off video and Super Bowl LI, when the Atlanta Falcons started very strong. In both stories, the start did not write the ending.
I am 100% G-Fund in my personal TSP. Thanks for reading, and please share with your friends and colleagues. Next post hopefully sooner than five weeks away….
Thank you
-Bill Pritchard