
Hello Everybody
Bottom Line Up Front: I remain 100% G-Fund in my personal TSP. To say I have not had any gains this year is indeed an accurate statement. Arguably, more importantly, I have not had any losses, which if anything, makes me feel good, as I enter “the last quarter” of my 25-30 year federal career. Some may state “you are actually losing money in the G-Fund, if you consider inflation.” While technically correct, this is more of an impact if you are in the G-Fund for 20 years: a 1-year sabbatical in the G-Fund is easily recovered when conditions are favorable.
With that said, the risk-tolerant may research an allocation of 50% G-Fund and 50% C-Fund for their personal TSP accounts. This is not advice or a recommendation.
Let me quickly identify that the C-Fund has been, and likely will remain, the top performing TSP stock fund in the coming 30-90 days. The I-Fund (shockingly), will likely be the next best performer for the same time period. I am in neither fund, for a variety of reasons. I maybe delusional, but I am going to claim that I am being disciplined in my approach, and refuse to succumb to emotion in my trading (watching the indexes climb higher indeed generates emotion). However, the charts (volume primarily) and economic data, political climate, and other things, cause me to remain out of stocks. Let’s talk a little bit about some things on my mind…
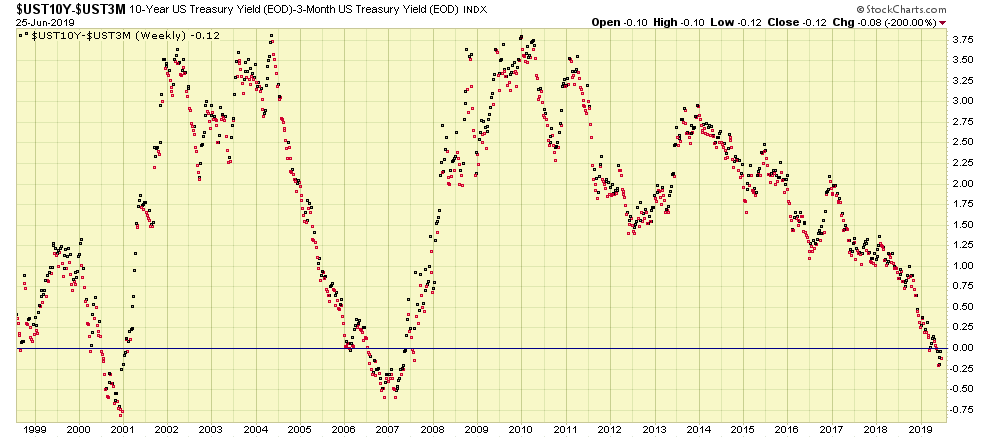
The Yield Curve, discussed in my July 15, 2018 post , is now “inverted” which historically has been a predictor of recessions. The prediction is not overnight: It is usually months away (rarely more than one year) before a recession is declared. Consulting the website InvestoPedia tells us that an inverted yield curve is an interest rate environment in which long-term debt instruments have a lower yield than short-term debt instruments of the same credit quality. This type of yield curve is the rarest of the three main curve types and is considered to be a predictor of economic recession.
Fancy definitions aside, this is a rare event, but it is happening now, evident via the below chart. A “spread” between he 10-Year Treasury Bond over 3-Month Treasury Bill of below zero gives us the graphical negative or inversional behavior on the chart:
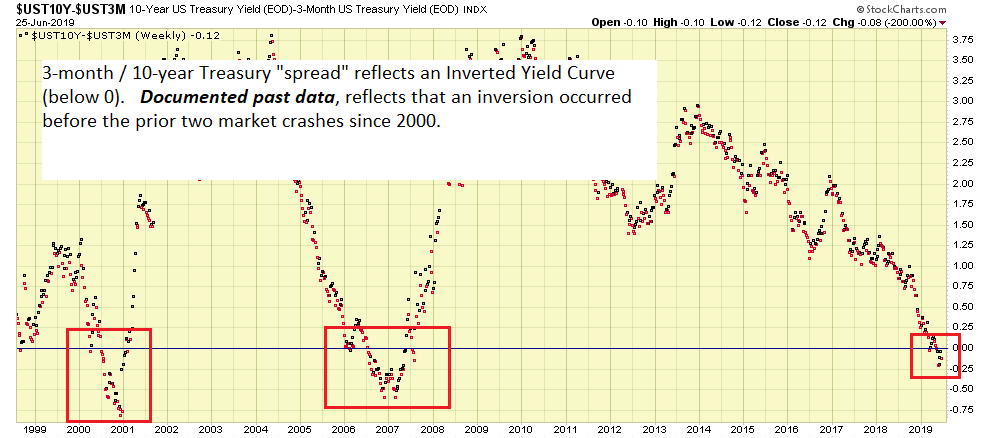
In the second chart, I have included my comments. The red boxes show prior inversions, student of market history will observe that the stock market, and economy, indeed performed poorly subsequent to the yield curve inversions. Is it different this time ? I don’t know.
Gold Prices, often mentioned on this site, is frequently used by me as an analysis tool. It proved extremely useful when Argentina was having yet another financial crisis, discussed in my July 31, 2014 post.
In sum, the safe haven of Gold tends to rise in times of economic uncertainty, which exists now due to tariffs and trade tensions. Lets take a look at the price of Gold, as it approaches a new high of $1,450 per ounce:
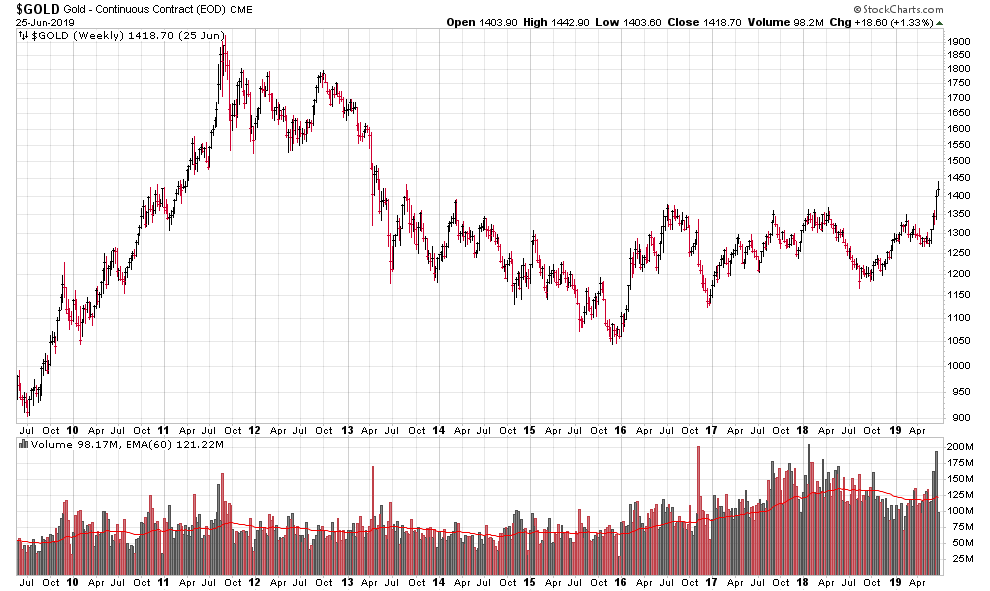
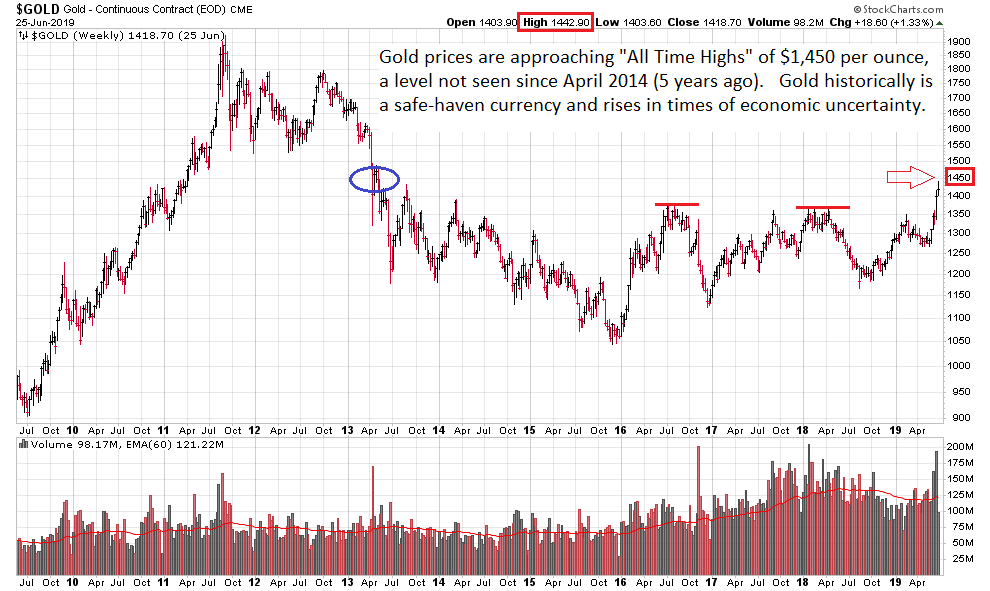
Also important is the volume action, as volume is the “credibility” or the “horsepower” behind the move. The most recent uptick in Gold prices has been accompanied with above average volume. Gold price does not move higher due to advertisements on cable news channels targeting senior citizens to buy Gold coins. It moves because countries themselves (via their central banks), financial institutions, and hedge funds (George Soros, etc) decide to buy it. Those investors aka “smart money” are worthwhile to monitor in respect to our own investing decisions. In sum, gold is moving higher, on volumes not seen before.
Interest Rates continue to be a hot topic, especially at the highest levels in government. Not seeking to stray into a political discussion, I will state that interest rates were at all-time-lows (near zero) subsequent to the global financial crisis of 2007-2009. This was done to “juice” the economy and encourage lending and investment. Basically, the economy was a “hospital patient” with low interest rates and Quantitative Easing being the life support system. Flash forward ten years later after 2007, and the patient has largely recovered from its condition back then. Indeed, employment is at all time highs, housing recovered, and spending came back. As the patient got healthier, the medical staff (in our case, the Federal Open Market Committee) decided it was time to come off life support, via the raising of interest rates. One particular sensitive sector to interest rates is real estate, higher rates may damper real estate investment (if your entire net worth and life story is tied to real estate, interest rates are a hot button for you).
To that end, I ask, what came first, the Chicken or the Egg ? Do higher rates cause recessions, or does the FOMC correctly cystal-ball looming recessions, and reduce rates ahead of time, in an attempt to soften the arrival of the recession ? The chart below may indicate the latter of the two:
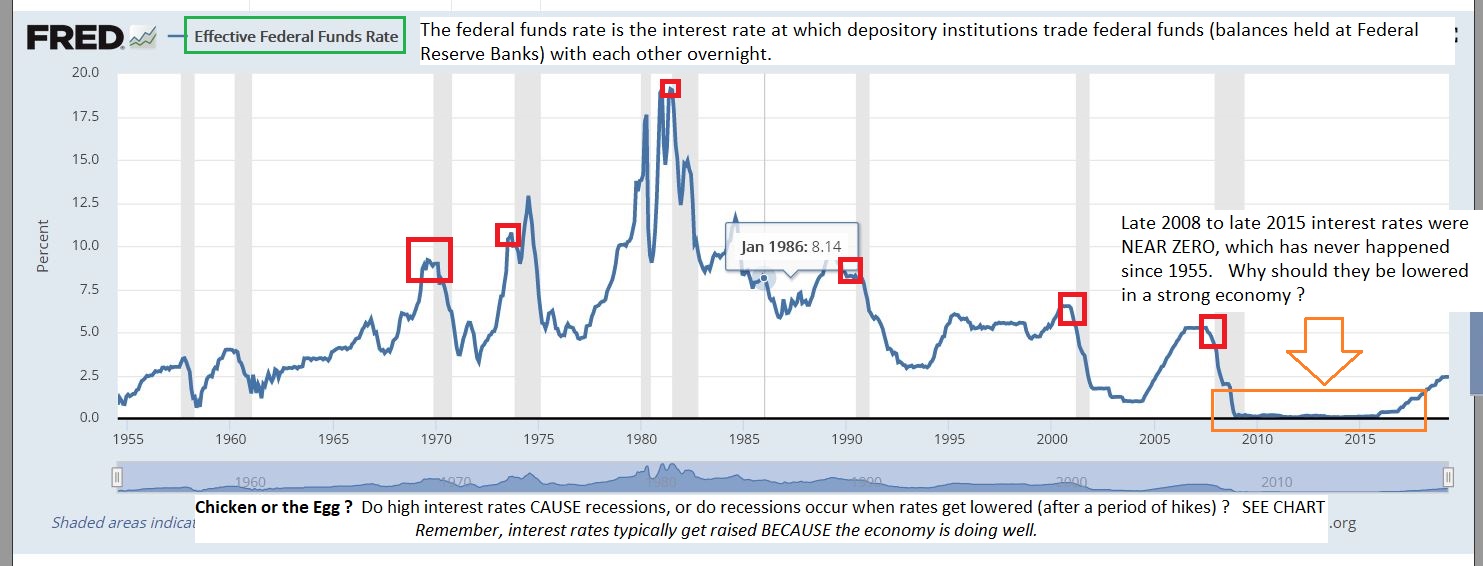
So what is the FOMC to do ? Lower rates (therefore basically acknowledging that a recession is on the horizon) or raise rates , because the economy “has never been better.” Which is it ? You do not lower rates because the economy is doing great.
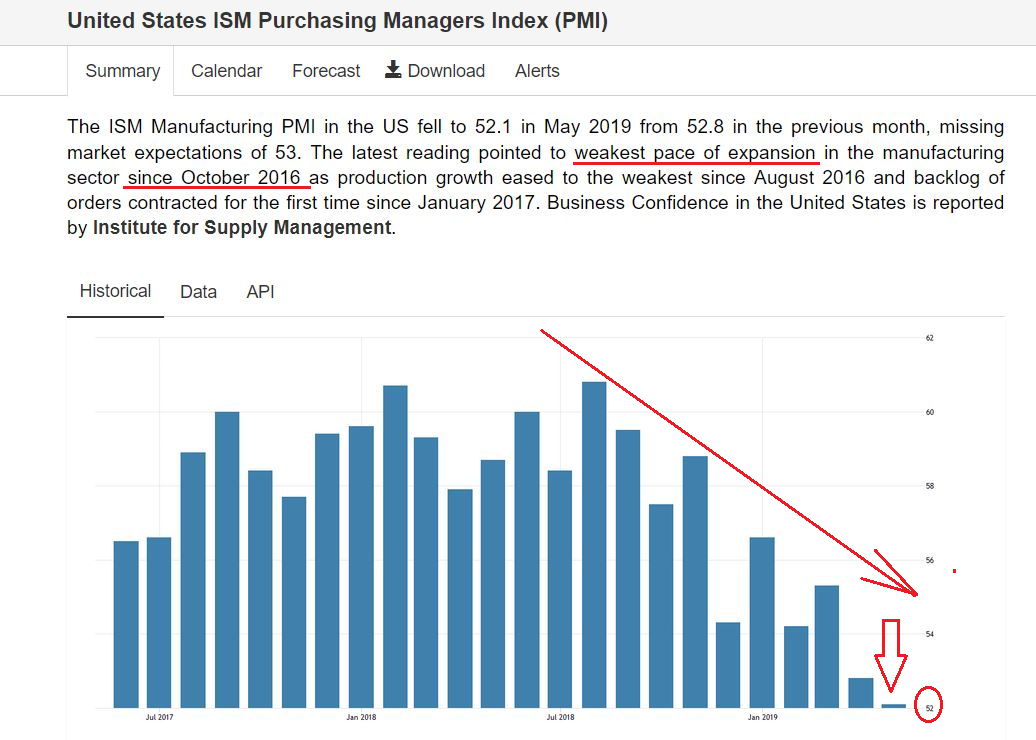
The ISM Manufacturing Index is another tool useful for determining “business confidence” of purchasing managers, and help measure production levels at manufacturing firms. The index is at all-time-lows, possibly associated to ongoing trade and tariff tensions:
The markets themselves are ultimately the final tool in my toolbox, and while they have rallied this year, volume has been poor. My affinity with volume analysis is should not be a surprise, I discussed the importance of volume, and included a “white board” in my house, in this August 29, 2014 post.
The chart of the SP-500 tracking ETF, “SPY”, is below:


Without the “vote” of volume, I rarely will buy or invest in a stock or fund. As such, while I have grown frustrated watching the indexes tick up, the volume action is lackluster, in my opinion.
Tariffs and Trade Tensions are the biggest obstacle facing the markets right now. President Trump and Chinese President Xi Jinping plan to meet at the June 28-29 G-20 Summit in Osaka, Japan this week. If a trade agreement is reached, the markets will rally strongly, likely prompting me to leave the G-Fund. However my confidence is not high. I believe no agreement will be reached, with President Xi positioning himself as a facilitator/negotiator to assist with US / North Korea tensions. There may be back-channel deals being made between those countries as we speak, resulting in a proposal that US stop tariffs now, due to President Xi’s purported value in the US/North Korea relationship. “Hurting china economically” may be sold as threat to “all the strides made” with US/North Korea relationship building, as “hurting China hurts the region.” Etc etc. In sum, I have zero confidence a trade deal will be made. If our trade representatives come back empty handed, the markets will likely crater. If the can is kicked down the road again, and/or we hear yet again that “significant progress has been made”, the markets will likely go down.
Noteworthy upcoming economic date include the next release of GDP data on June 27 and the ISM Index release on July 1.
That is all I have for now…I remain 100% G-Fund for now. This may change if we get some positive news from the G-20 summit.
Thank you and talk to you soon…
-Bill Pritchard
