The stock indexes have entered May on negative footing, the Dow Jones index trading 600 points to the negative on the first day of the month of May, with the losses on April 30 (Thursday) and May 1 (Friday) effectively erasing all gains during the week. Indeed, the last few weeks have been quite turbulent, with the market largely rebounding from the lows witnessed on March 23, 2020. This rebound has largely resulted from hope and stimulus and not on positive economic news, which is quite lacking. I will discuss all of the above. Unfortunately, the damage done by Coronavirus/COVID-19 has resulted in a negative TSP performance for all stock funds, both for the last 12 months, and Year to Date. My personal TSP Allocation of 75% G-Fund, and 25% C-Fund appears, in my opinion, to be the appropriate allocation for my account, offering me the ability to benefit from the “up days” in the market while still having some G-Fund protection. My allocation is very similar to the TSP L-Funds. For additional information on diversification, please visit the TSP site at: https://www.tsp.gov/PlanningTools/InvestmentStrategy/beforeyouinvest/diversification.html
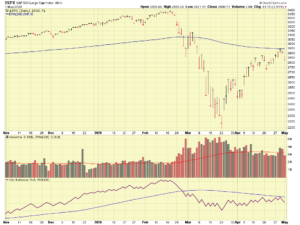
Lets take a look at the S&P 500 Index:
Evident in the chart is the rebound which started after March 23. This rebound witnessed headwinds on April 30 and on May 1, impacted by negative economic news which included jobless claims and poor corporate earnings.
A variety of events have spurred this rebound, notably hope and stimulus, in the form of fiscal “bail out” styled packages from our Treasury Department. Indeed some of these packages have strings attached, and must be paid back with interest, but if the receiving company goes bankrupt and liquidates, there will be no pay-back that I can see. Payroll protection, stimulus checks, loans and grants have been provided, and rightfully so. Clearly our leaders are looking out for America- the COVID-19 virus itself and the resultant federal response has brought us into uncharted territory in many ways.
A variety of vaccine and drug studies are underway, to include Remdesivir, a product used to treat Ebola, that first came into existence in 2009, and produced by Gilead Science, and Hydroxychloroquine, used to treat malaria and Lupus. These medicines appear to expedite the victim’s “return to service” and recovery, but do not appear to have vaccine properties or other preventative properties. They are possible treatment drugs. Remdesivir requires intravenous injection, aka IV-bag and hospital bed, etc. It does not align with mass applications to thousands of people in one setting. Hydroxychloroquine can be administered via a tablet. These drugs, and others, have provided people with hope, a necessary and desirable thing to have in times of despair and uncertainty.
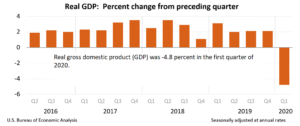
On the economic front, news is not good. Let me be clear: there are no fundamental/economic-based news to send the market higher. The April 29 Gross Domestic Product (GDP) release reflects that GDP decreased -4.8 percent in the first quarter of 2020, according to the “advance” estimate released by the Bureau of Economic Analysis:
In the event that next quarter’s GDP is negative, that will reflect the “official” start of a recession, which is a GDP decline in two consecutive quarters. Many economists are already saying a recession is here now, akin to a Category 5 hurricane offshore and declaring the beach house “destroyed”, even before the Hurricane arrives. In any event, next quarter’s GDP will be telling. Additional negative news includes 30 million jobless claimed filed in the last six weeks, and a reduction of housing market optimism as reflected in the Housing Market Index, a monthly poll of builders and construction professionals.
So what is going on with COVID, which caused this mayhem? Most experts agree that our economy was fine until COVID came along. COVID statistics and metrics are probably the most polarizing topic in modern times, aside from talking about religion and politics itself. How are death rates calculated ? Do people die of COPD, lung infections, or is it labeled “COVID?” If the medical examiner in NYC does things one way, does the medical examiner in Seattle do it the same way ? What about hospitalizations ? Reports exist that hospitals “want” COVID patients, to allegedly obtain high value reimbursements from the government. I doubt this is the case, nobody wants a walking HazMat case to coming into any building. Hospitals can make money in a lot of other ways anyway. Others report that this very reason is causing hospitals to turn away patients who are non-critical, thus resulting in a walk-up patient, indeed with COVID, who is sent home to recover. This is not a “hospitalization.” A very superficial assessment of Hospital ABC, with no COVID patients (they all got sent home at the door), will cause someone to believe that there is no COVID in that town. Also, as testing expands across the nation, case counts will naturally increase. One could spend hours reviewing COVID data and still not understand the scope of the problem. Sensationalist media (basically all channels besides the Food Network) does not help.
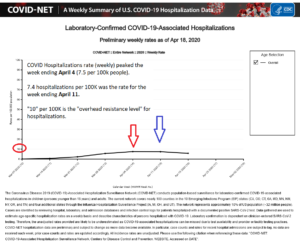
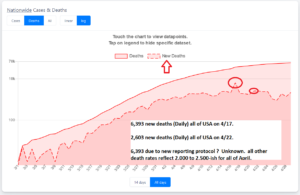
For me, all I care about is daily rates. Not cumulative. A graveyard is cumulative. Today it contains 50 deceased persons. Tomorrow, 3 graves become occupied and the graveyard now has 53 deceased. Naturally, over time, more people fill the graveyard. When sensationalist media claims two (2) COVID deaths in January, and 60,000 in April, well, yes, that is correct. As people die, the numbers increase (sadly). What I care about is daily rates, of hospitalizations, and of deaths (aforementioned date methods aside). See charts:
 For the weeks ending on April 4 and April 11, the weekly hospitalization rate (there is no daily rate from CDC) was 7.5 and 7.4 persons per 100,000 people. We obviously do not want that to increase. My personal “worry level” would be 10 persons per 100,000 people, as that is clearly abnormally high. Lets move on to death rates:
Evident in the cart is the fact that the daily new death rate (for April) is basically 2,000 to 2,500 a day. We had a spike of 2,603 a day on April 22, and a huge spike of 6,393 on April 17. I am not sure if the reporting criteria changed that day or what happened, but if we remove that from consideration, we are looking at 2,000 to 2,500 a day for new deaths. My “worry level” is if we see 3,000 a day for new deaths.
Which leads to the lock-down discussion. If we have no vaccine, no preventative medicines, and only via self-quarantine and social distancing, have we managed to reduce daily rates to the above levels, what happens when we “open back up.” More importantly, what will the decision makers do ? Hypothetically, lets say USA is “open” (albeit wearing masks, social distancing, etc) on June 1. Lets say masks and other measures indeed have some positive impact. However, new infections and new deaths are still bound to happen. Lets say we go all of June then we see hospitalizations and deaths spike in July, as a result of the May/June “re-open.” I am not being pessimistic here but it is what it is. School typically resumes late August. The decision to return to school will probably be mid-August. So in my opinion, July is a very important month. It may set the tone for a return to school and other things. Keep an eye on the above rates. Elected Governors and Mayors know that you can shut down testing and magically have “No COVID cases” and high five each other that the problem is solved. But if someone dies from COVID, or is hospitalized with COVID, that is hard to dispute. My worry levels are 10 hospitalized per 100,000, and 3,000 deaths daily. By the time July arrives, we should have the May and June data which will paint the picture of where COVID is headed.
Lets keep our fingers crossed as we begin the new trading month of May. My personal TSP Allocation remains 75% G-Fund, and 25% C-Fund.
Thank you for reading, please share this email with friends and colleagues who may find my opinion based analysis of the markets useful…the link to subscribe is: http://www.thefedtrader.com/contact-us/
Thank you
-Bill Pritchard


