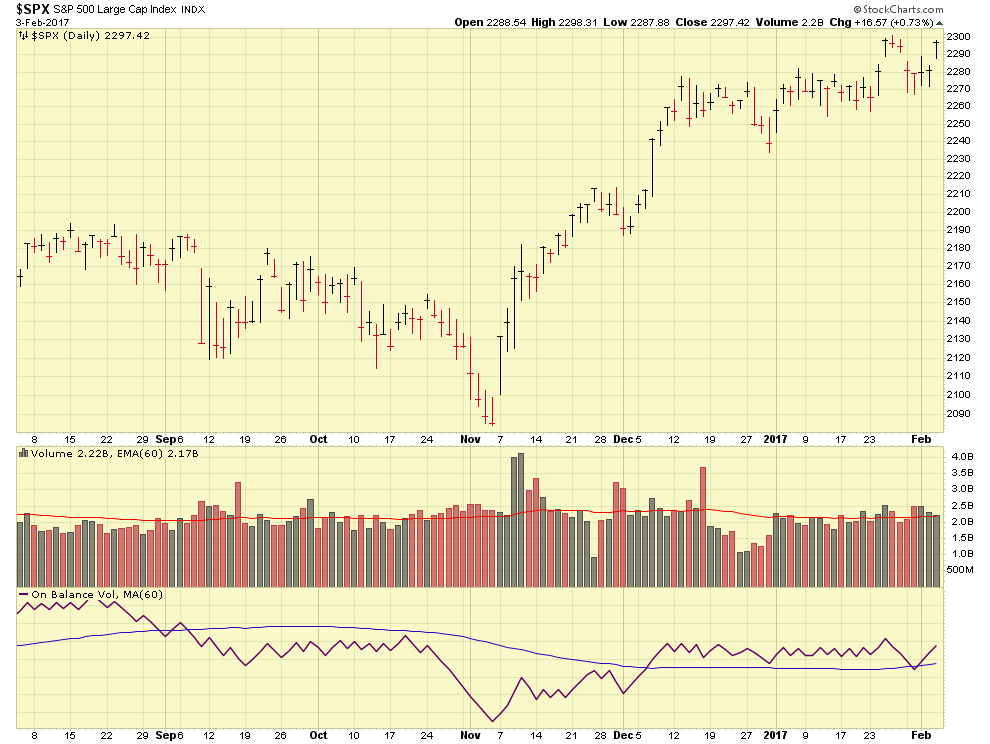
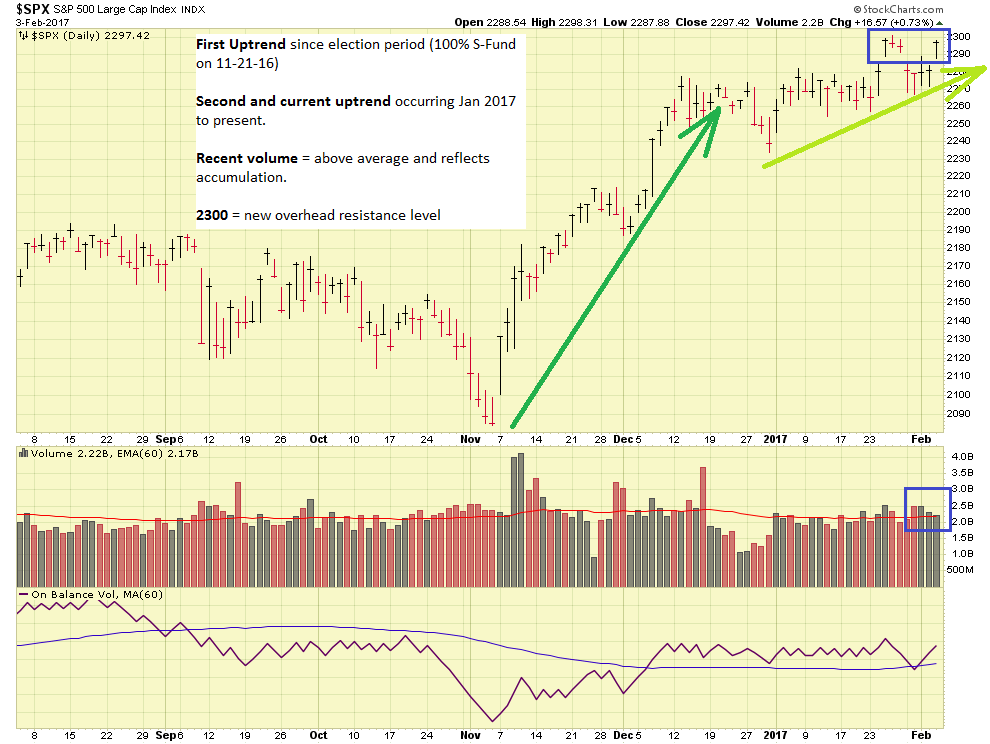
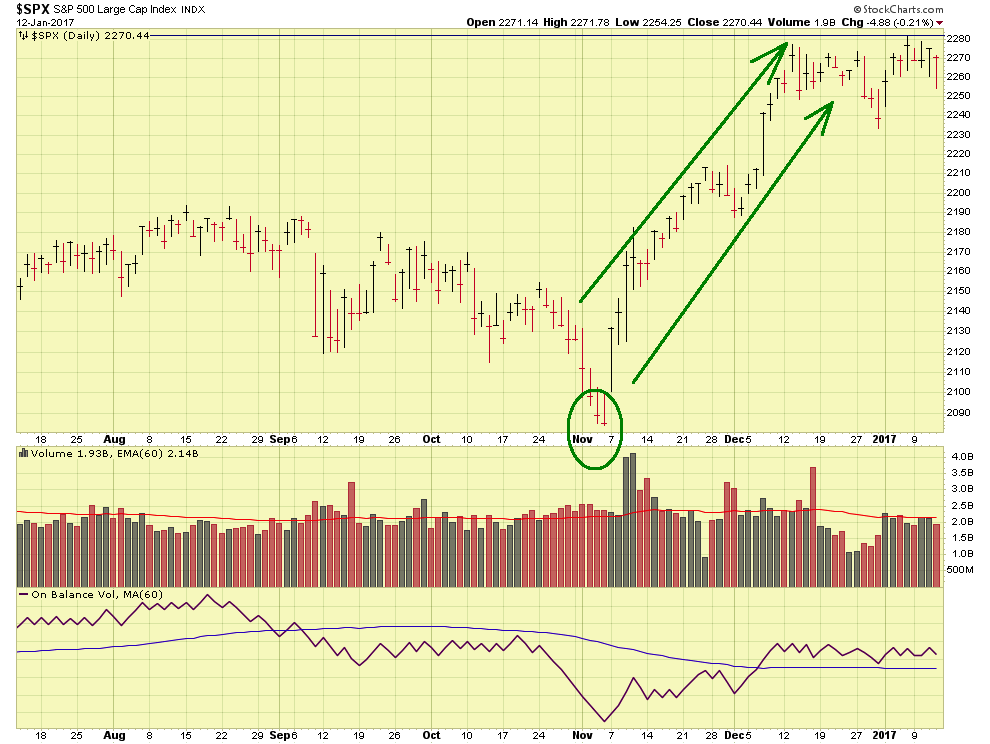
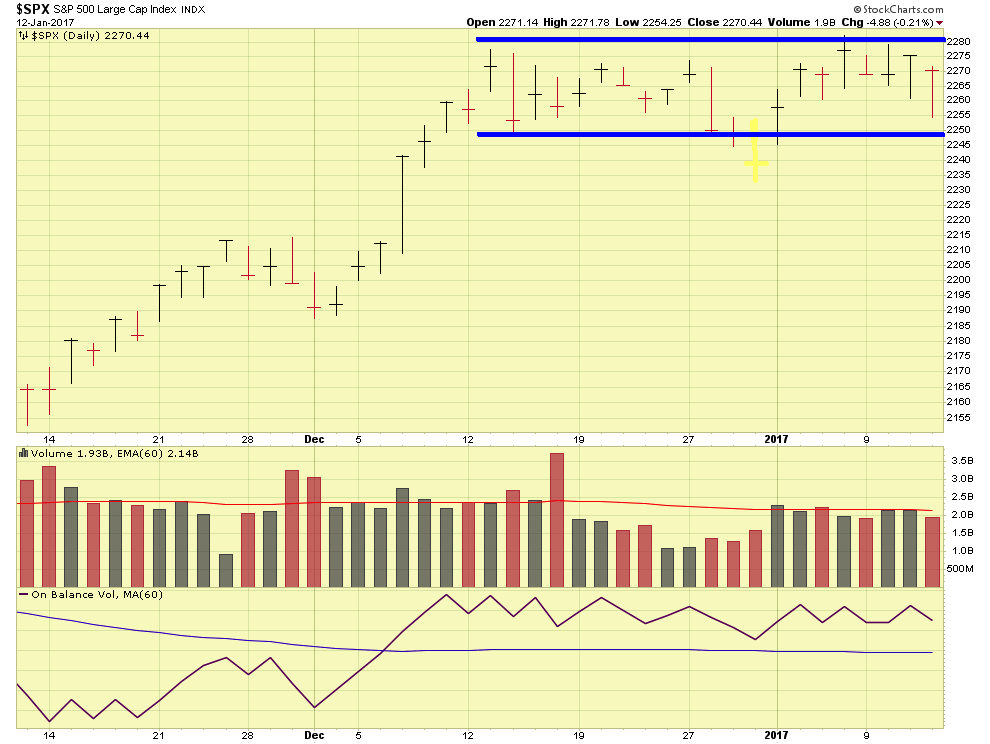
As most know, the stock markets rallied strongly on Wednesday March 1, the day after President Trump’s address to Congress – a performance which obtained positive reviews from CNN, The New York Times, and NBC, all media outlets not known to be cheerleaders for Mr. Trump. More importantly, the markets liked his performance, with overnight futures increasing by 100 points and a daytime trading session with a 1.5% to almost 2% gain across all indexes, a pretty big deal. (When you wake up at 5AM to check Dow Futures which you then send to your WhatsApp buddies, you realize you have no life…) The SP 500 “gapped higher” which is a very bullish behavior. Note that small caps stocks led the rally today, outperforming all other stocks. Lets take a look at some charts:
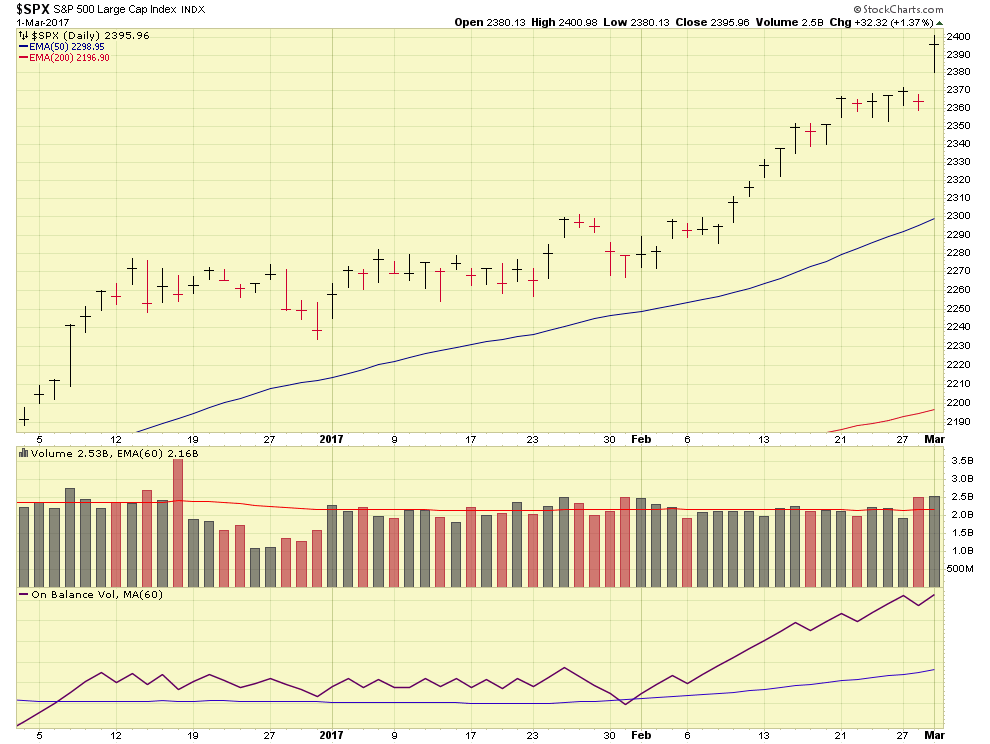
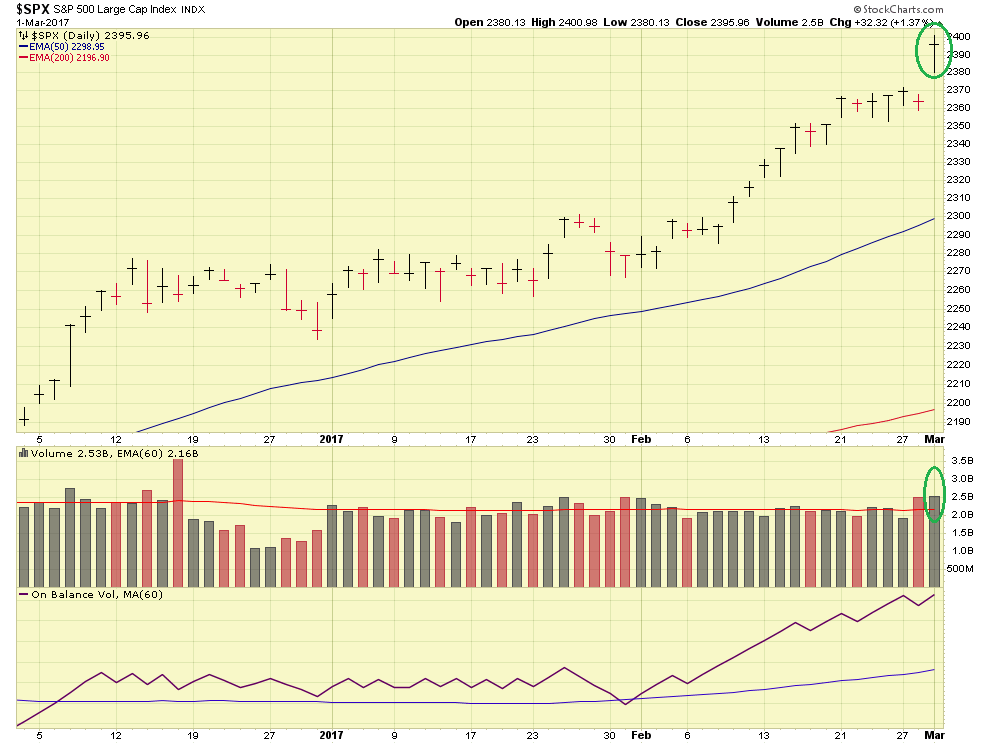
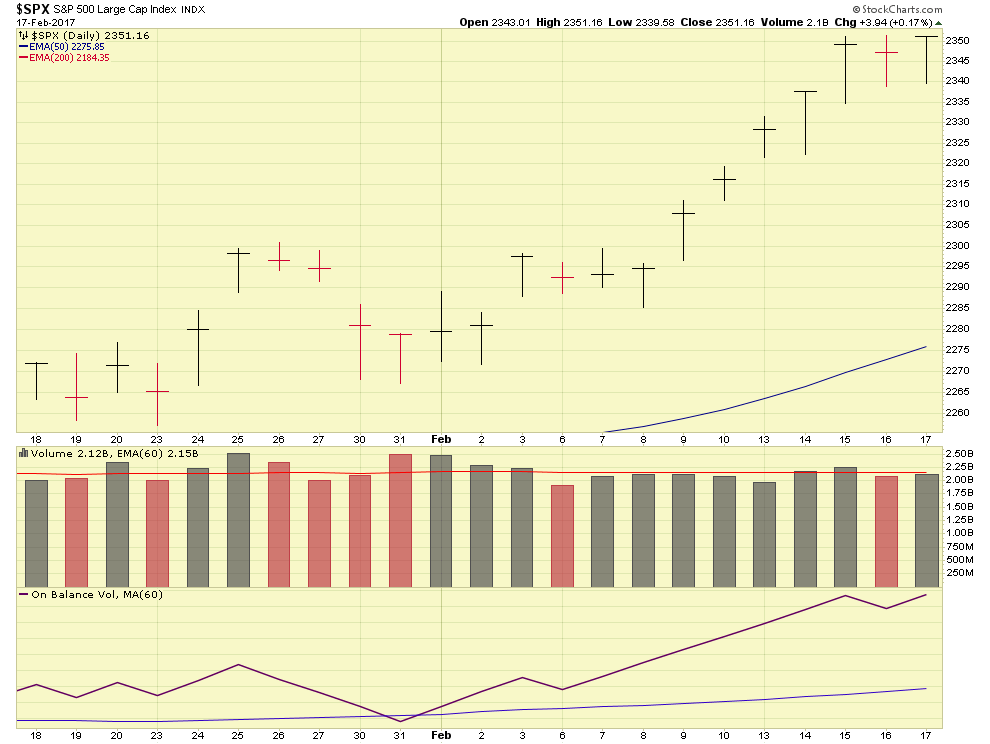
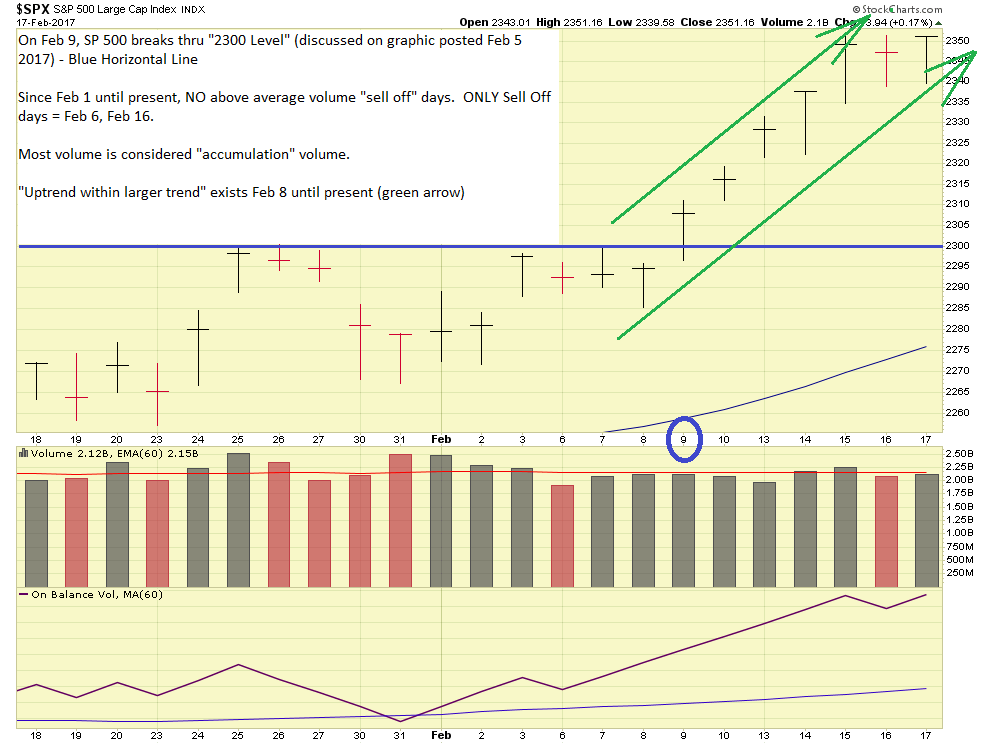
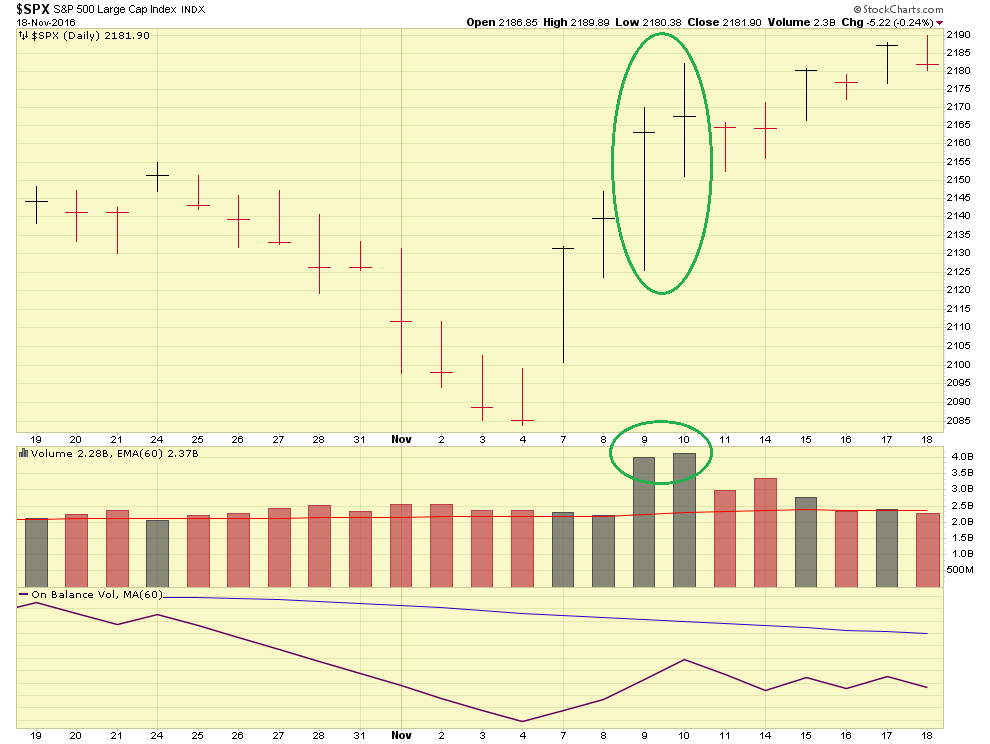
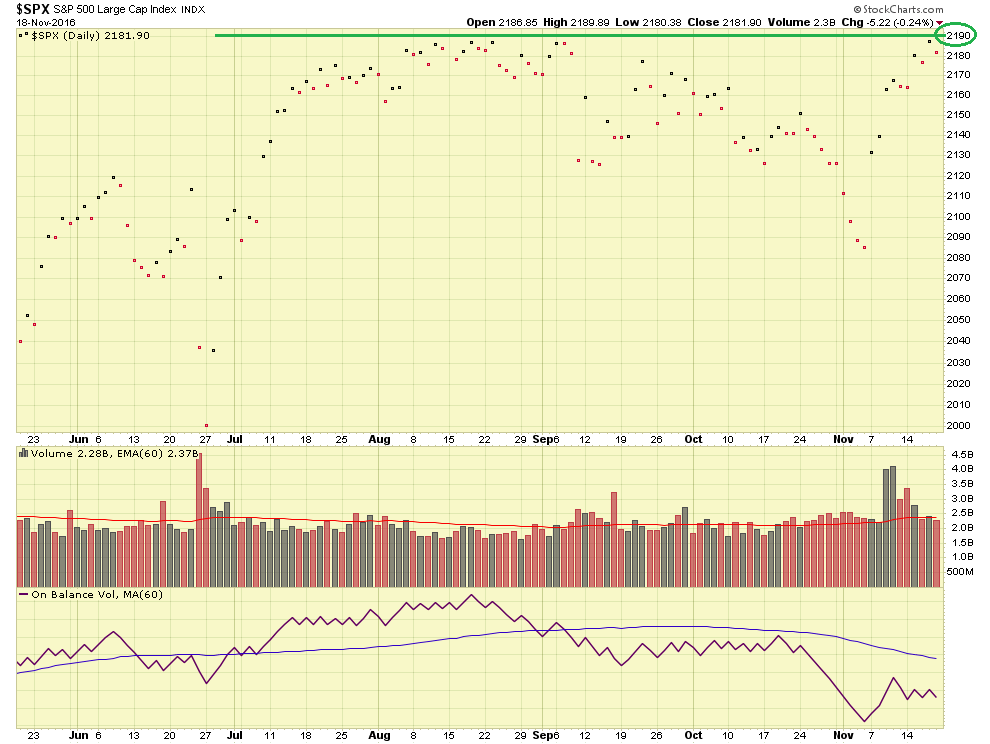
As can be observed, the SP 500 leaped above the prior day’s trading range, this is known as a Gap Up, observe also that the volume was above average, another positive sign. In sum, I see no indications of “danger ahead” (contrary to the majority of press reporting…) in the markets and hesitate to try to guess when the trend will stop. Unless the market tells me to get out, I am in.
This brings up another item, the monthly returns for the TSP Funds. As crystal-balled here before, the C-Fund indeed outperformed in February. See graphic:
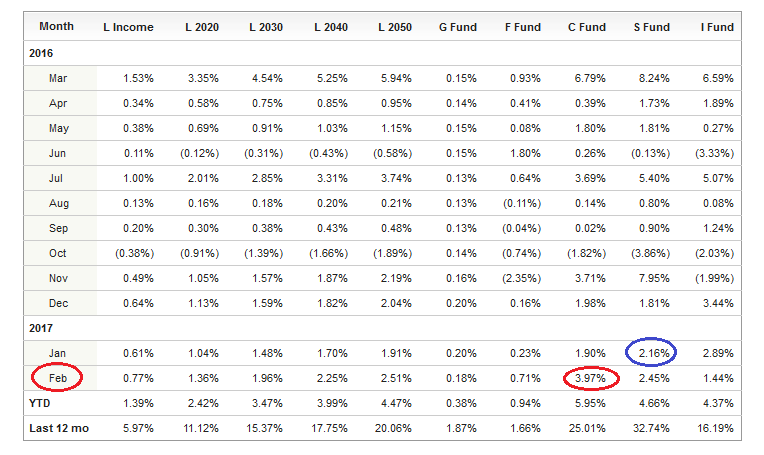
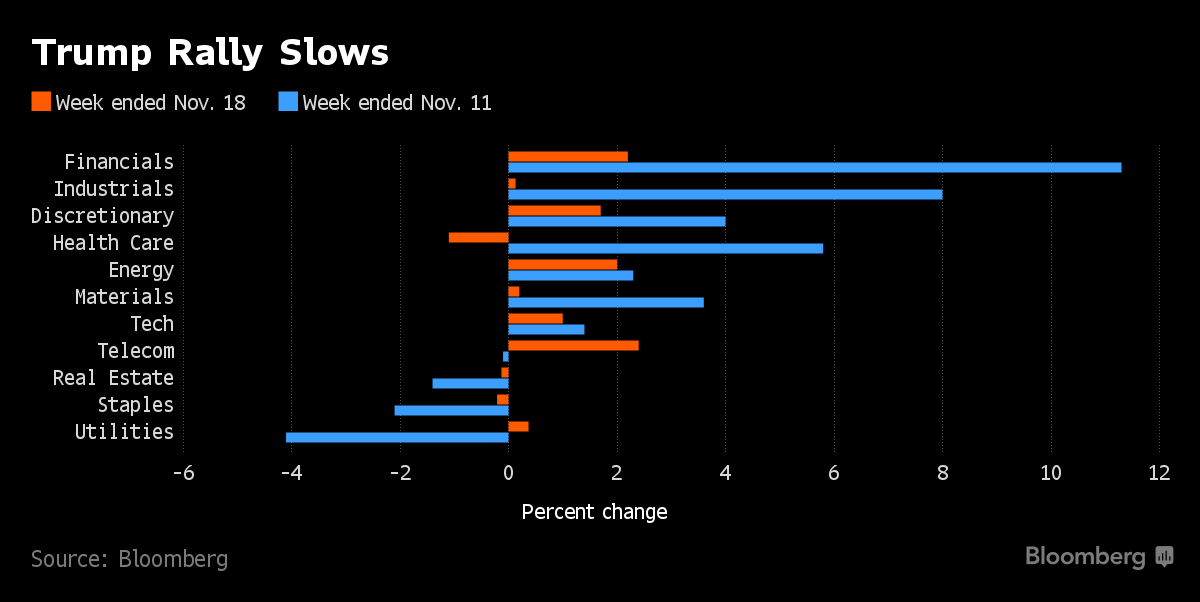
The C-Fund, composed of large cap stocks, and designed to replicate the SP-500 Index performance, responded very well to Mr. Trump’s policy statements and talking points about infrastructure, defense, and reducing regulation. Not surprisingly, large cap companies in the sectors of construction, defense/military, and financial/healthcare are the top performing stocks presently. The argument to move to C-Fund is somewhat stronger now, however I prefer to monitor things a bit longer. I still refrain from I-Fund due to unpredictability with the international markets. Add the fact that I believe institutional money will seek the best return- I believe this will be found in US stocks, not in international stocks. As more swimmers get confident about Swimming Pool USA, they will leave other pools and thus those stocks will see lower returns.
In sum, I remain 100% S-Fund until further notice. I may modify my TSP Allocation/Contributions to include, some, or all, C-Fund, in the next 30-90 days. Until then, I remain 100% S-Fund.
“Congrats” to my numerous subscribers who have crossed the $1M mark in the last month. While my site is not a money printer and I cannot take any credit for those TSP balances, the feedback received is that this site has raised general awareness of market events and many of the $1M folks have remained fully invested in stocks as a result- by doing so, they witnessed substantial gains in their accounts.
Thanks for reading and talk to you soon.
-Bill Pritchard