Hello (Nervous) Readers
I know it is time for an update when my page views hit record levels, the count has increased every day as we get closer to the election, as has my inability to sleep and an increase in blood pressure. I have said before, if you can’t sleep at night because of your investments, you need to “sell until you reach the sleeping point.” With that said, my personal stock choices have really done well, they are a few technology names which I will not mention here but I am quite happy with. I can also have them go to zero (while not desired…) and still pay my mortgage, so it is “hobby money.” Our TSP accounts, however, are critical, for retirement income and peace of mind, and we cannot roll the dice with those. So as my former Supervisor liked to say, BLUF (Bottom Line Up Front), I am moving my TSP to 100 % G-Fund, both Contribution Allocations and Interfund Transfer. Note that per the TSP Website, changes made on the TSP website or the ThriftLine before 12 noon Eastern time are generally processed on that business day. Requests made after 12 noon Eastern time are generally processed the next business day. In short, any change made on Thursday Nov-3 should be fully processed by close of business Monday Nov-7. The election is Nov-8.
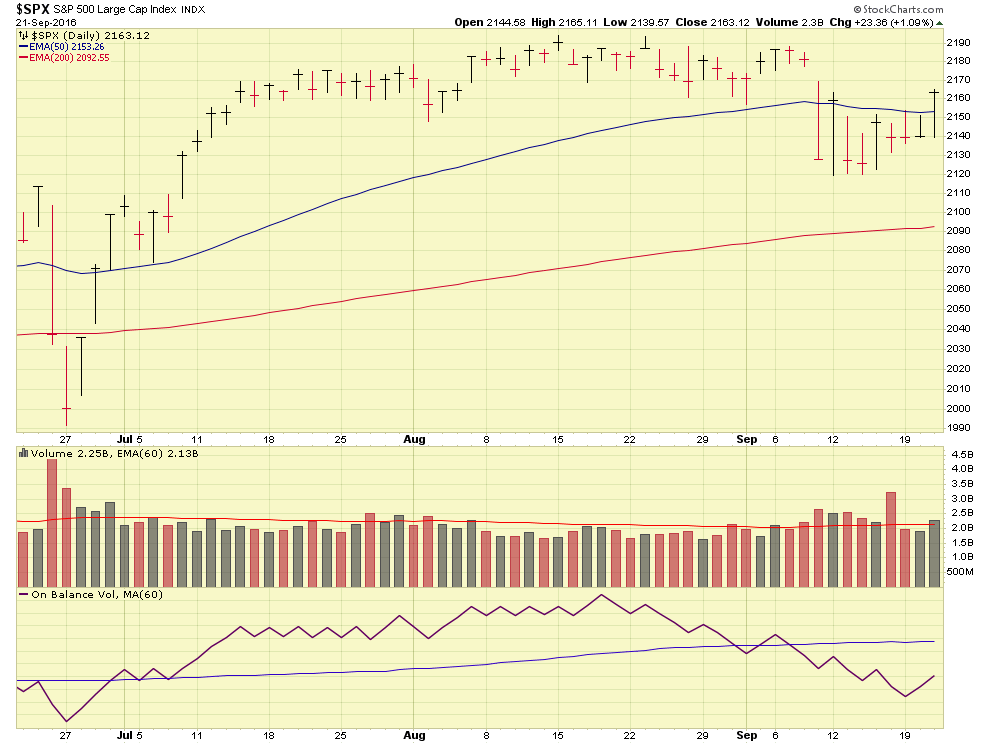
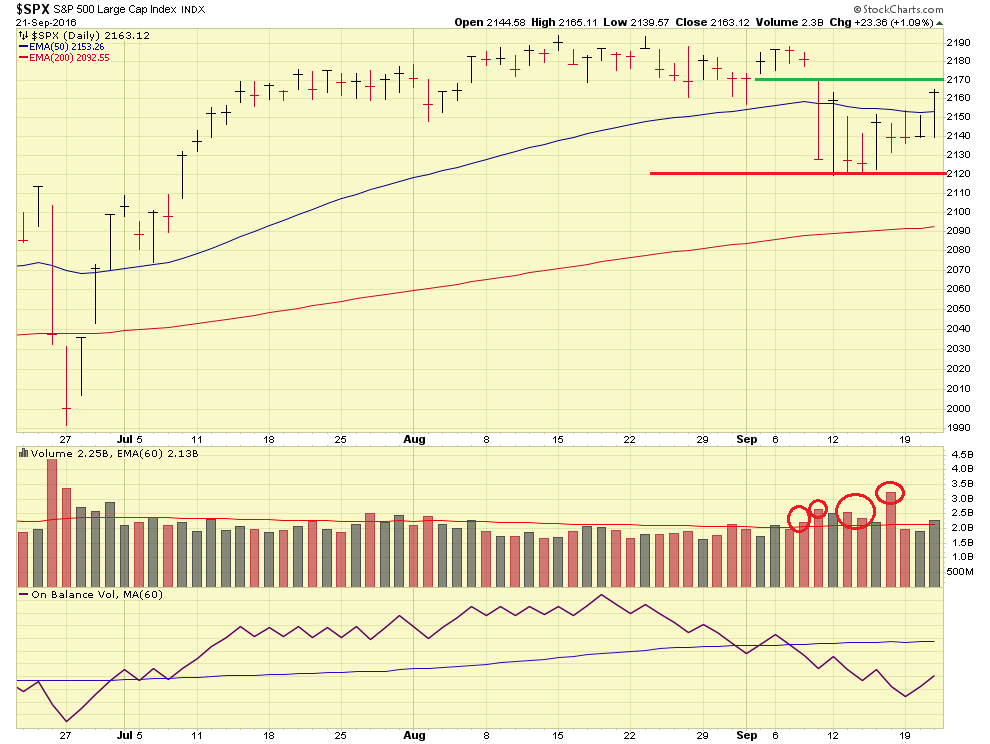
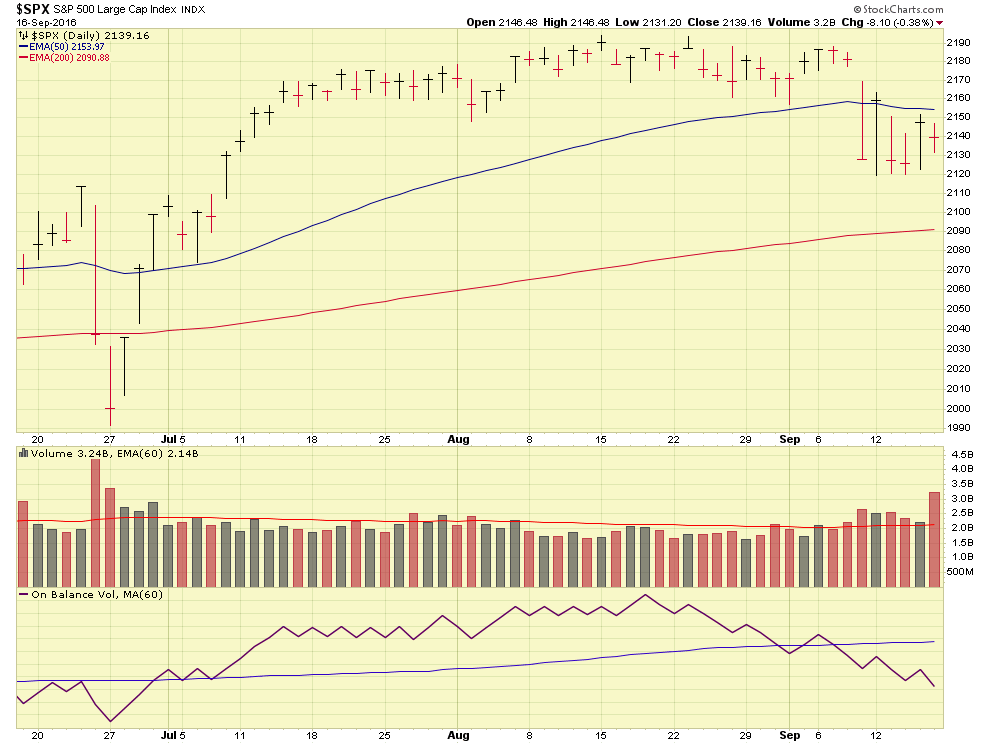
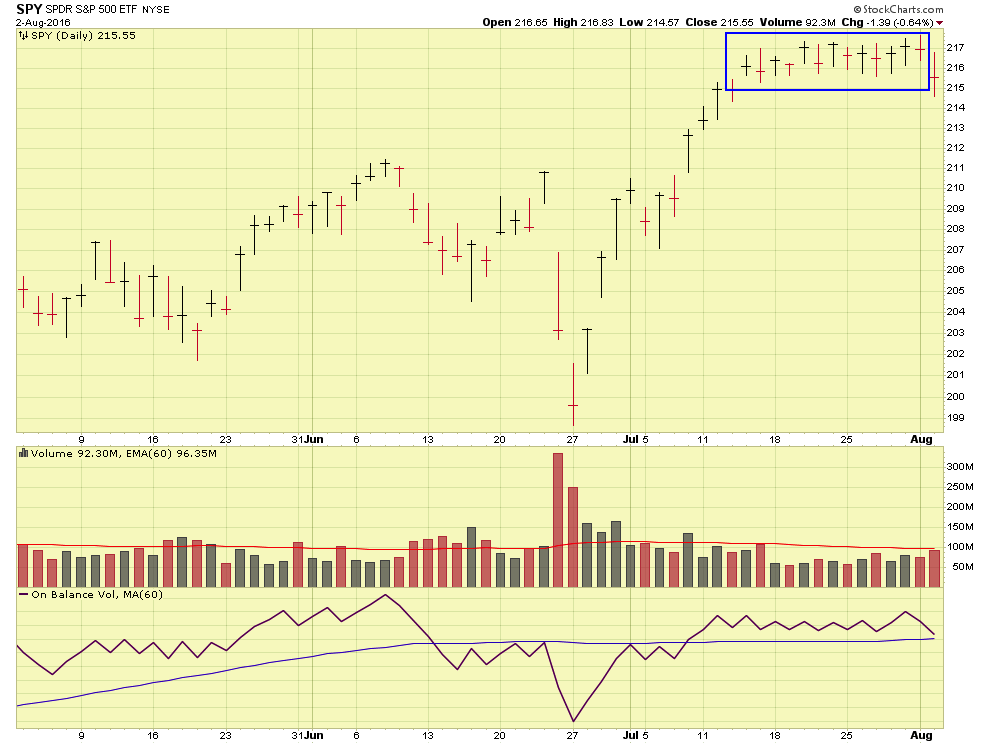
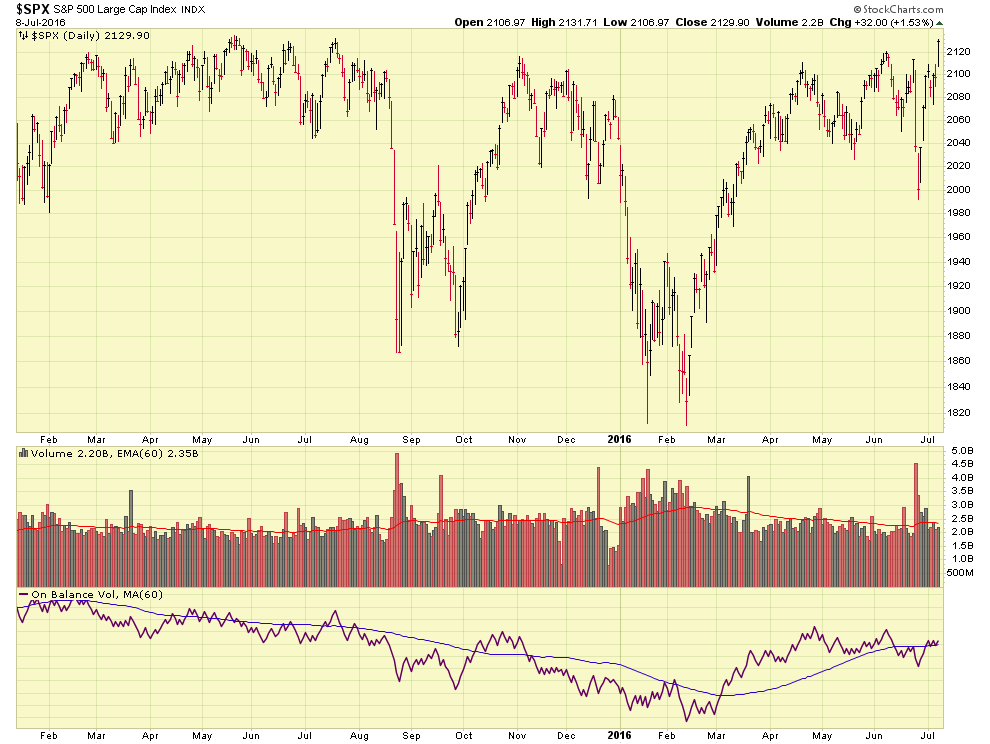
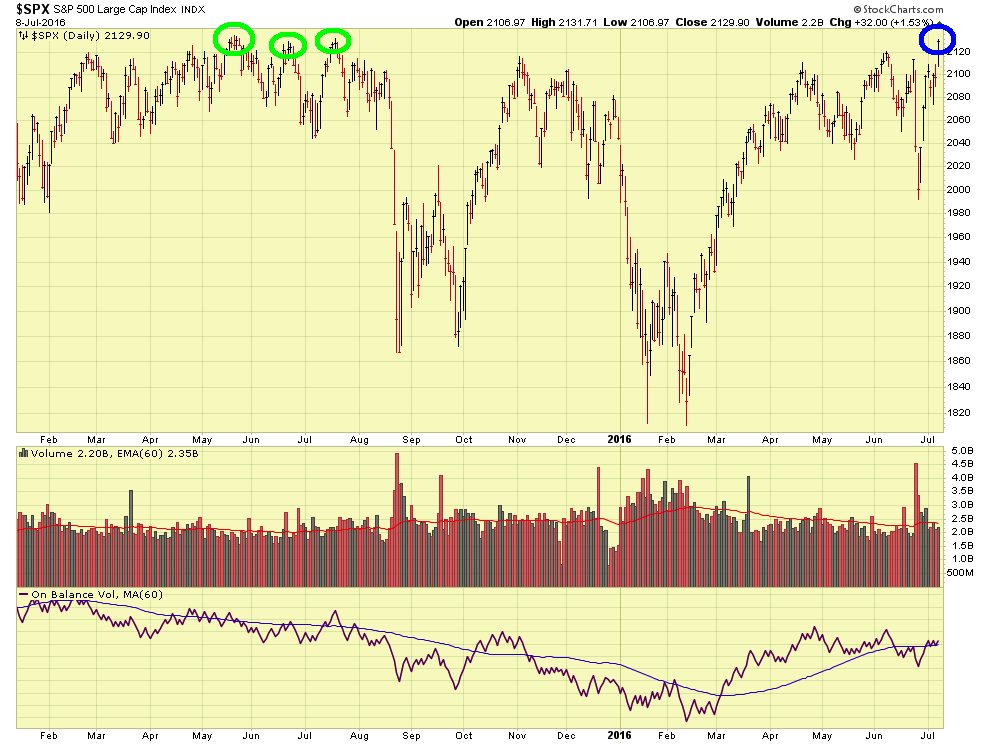
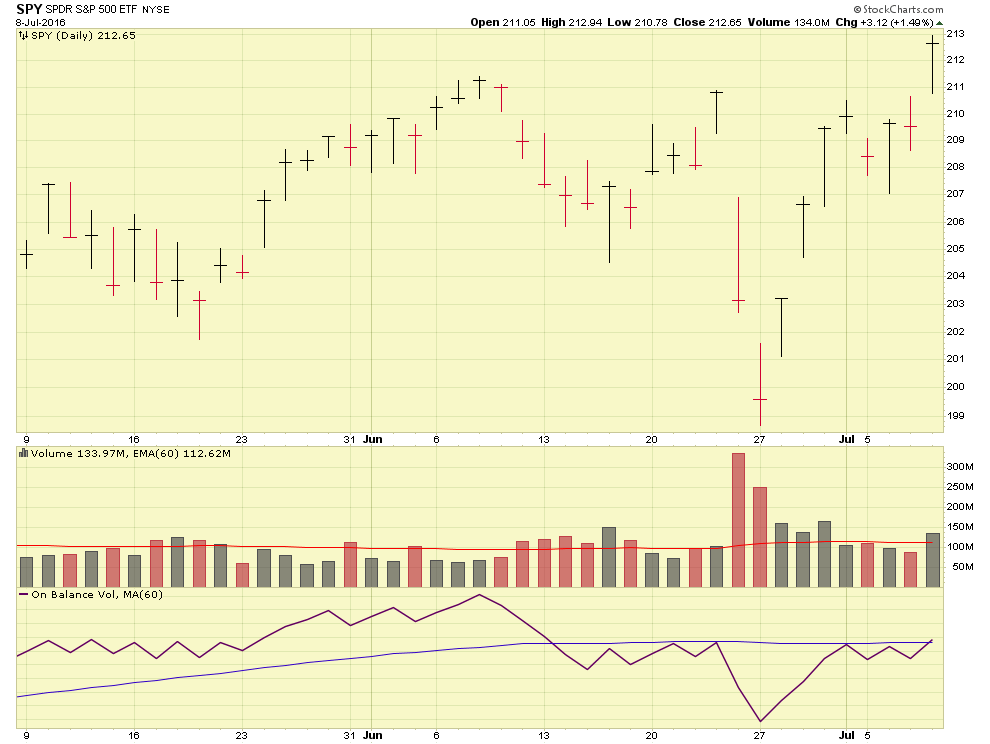
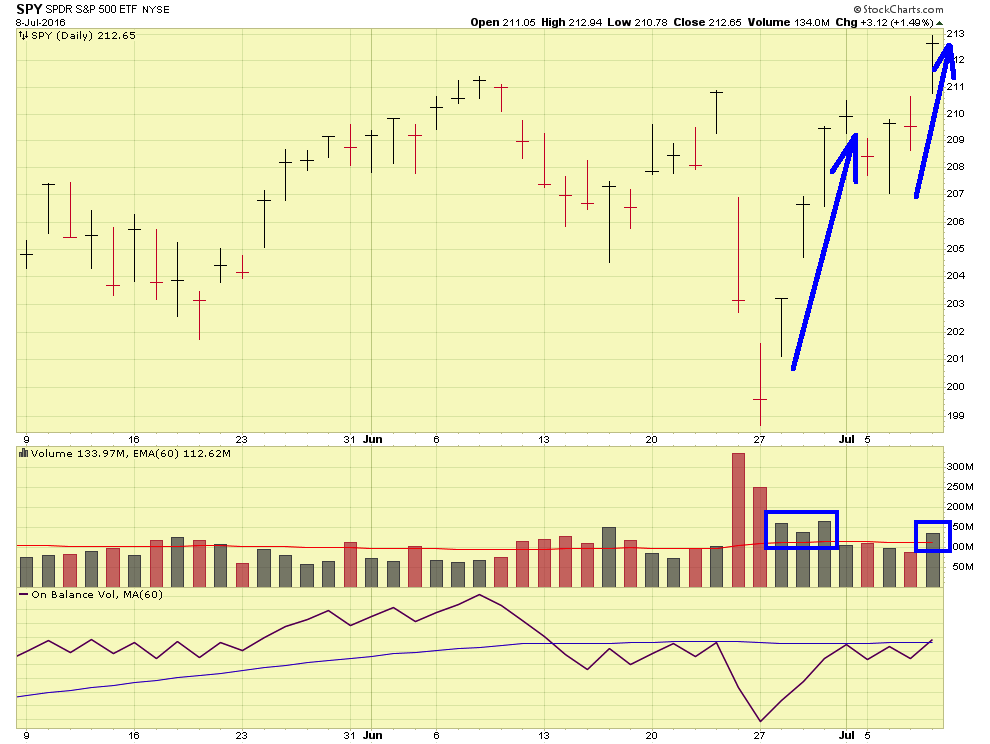
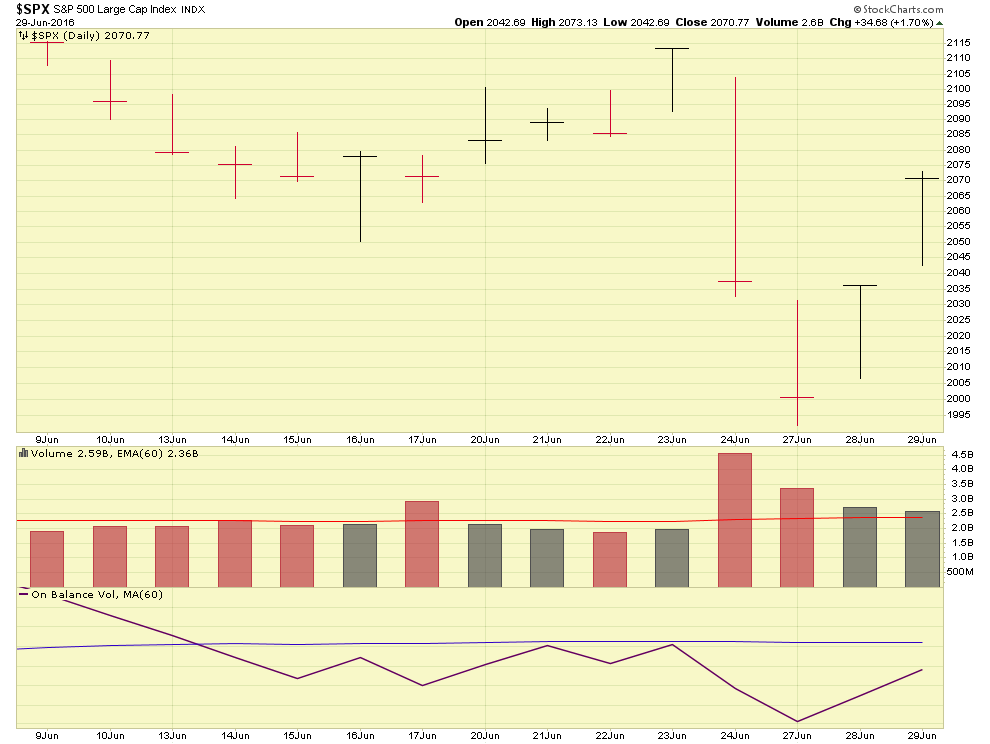
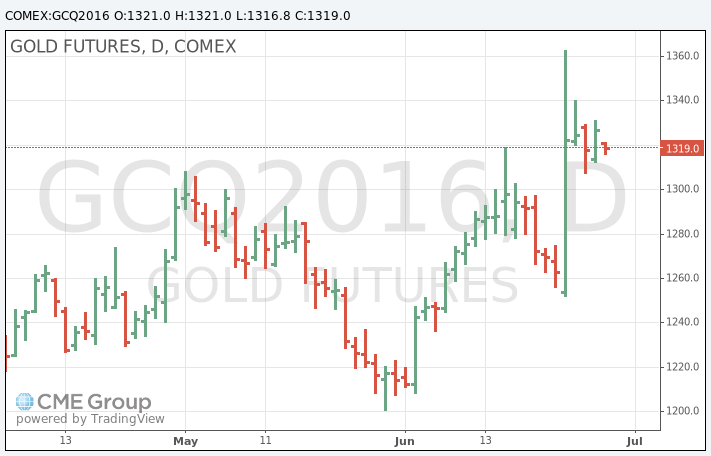
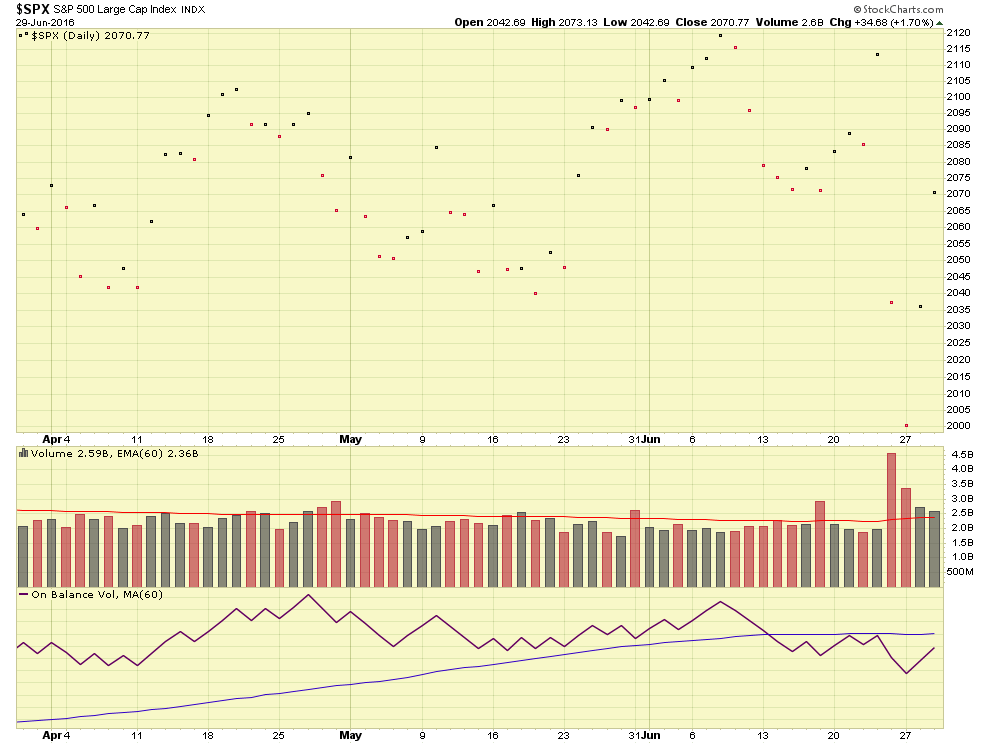
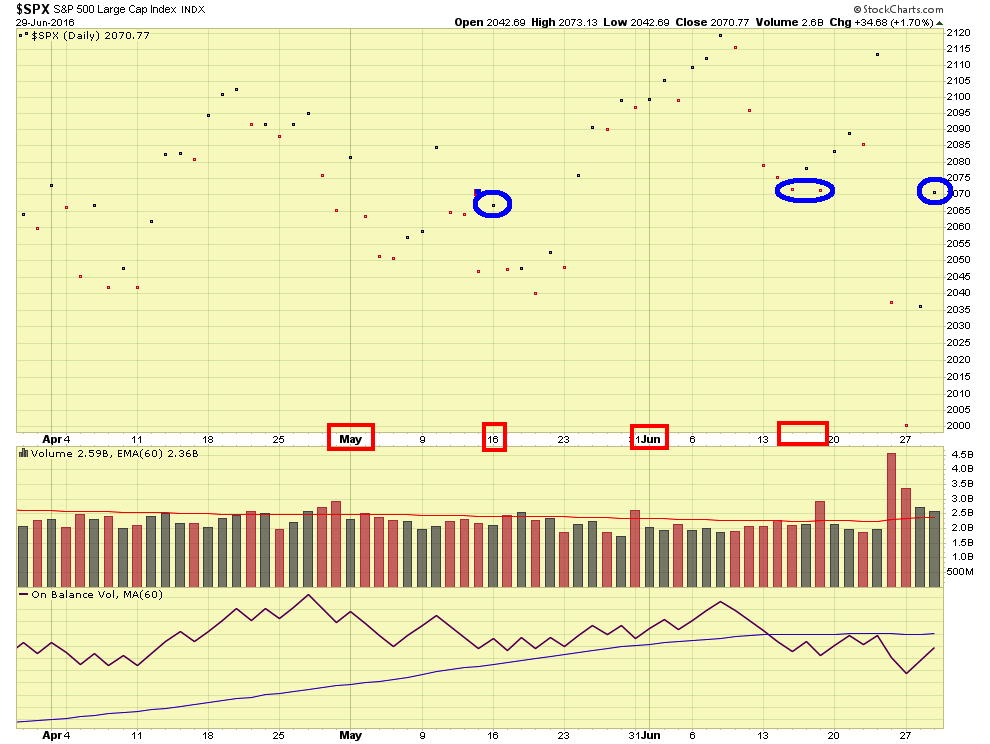
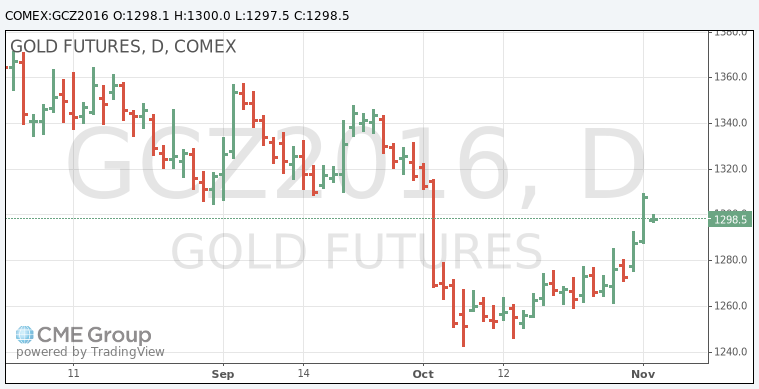
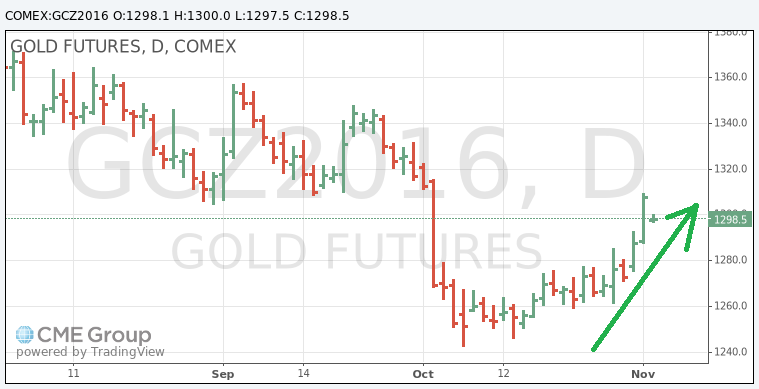
Allow me to discuss my views of the markets and shed some light into my decision. We are arguably in one of the most important elections in history, and clearly the broader markets, worldwide, are nervous. No matter what party the voter identifies with, or what candidate he/she favors, everyone agrees that this election is important, due to a variety of domestic and international issues not seen before. Gold Prices have recently ticked upward, which is consistent with “safe haven money flows” as major institutional investors exit equity/stock positions and seek “safe haven” for their money. Not everyone is moving to Gold, some are moving to other investments, investments which are not really possible to determine but there is no question that major investors are exiting stocks. As we know, “stocks” for TSP purposes are the C/S/I/some portion of L-Funds. This movement out of stocks creates additional supply of shares on the markets, and thus pushes prices down, as at the end of the day, the stock market is an auction market, and it is supply and demand driven. Yes, “earnings moves stocks” but earnings (good or bad) actually cause people to buy or sell stocks, and that action is what moves stock prices. But lets not get tripped up over semantics here. Visual explanations are always a good thing, so lets look at the SP-5oo Index charts:
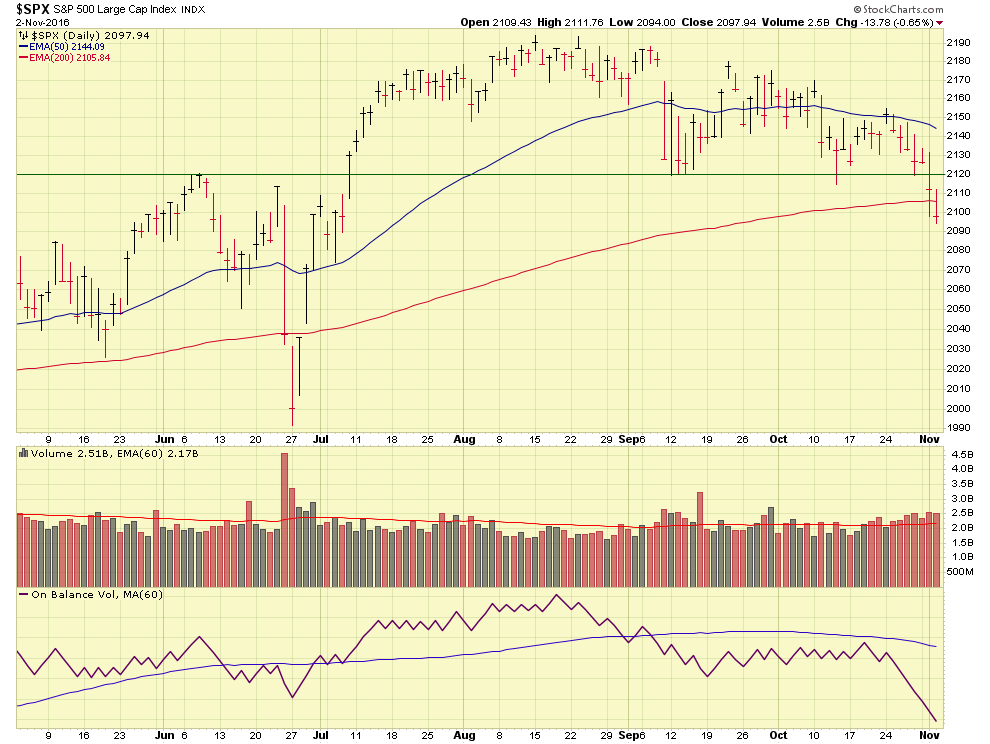
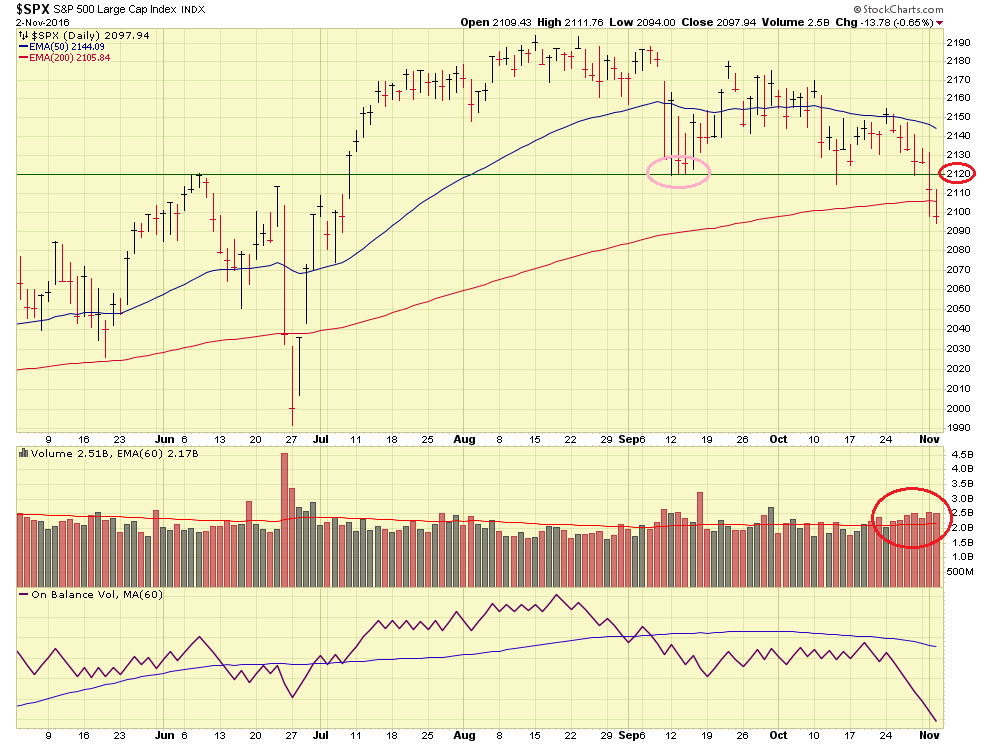
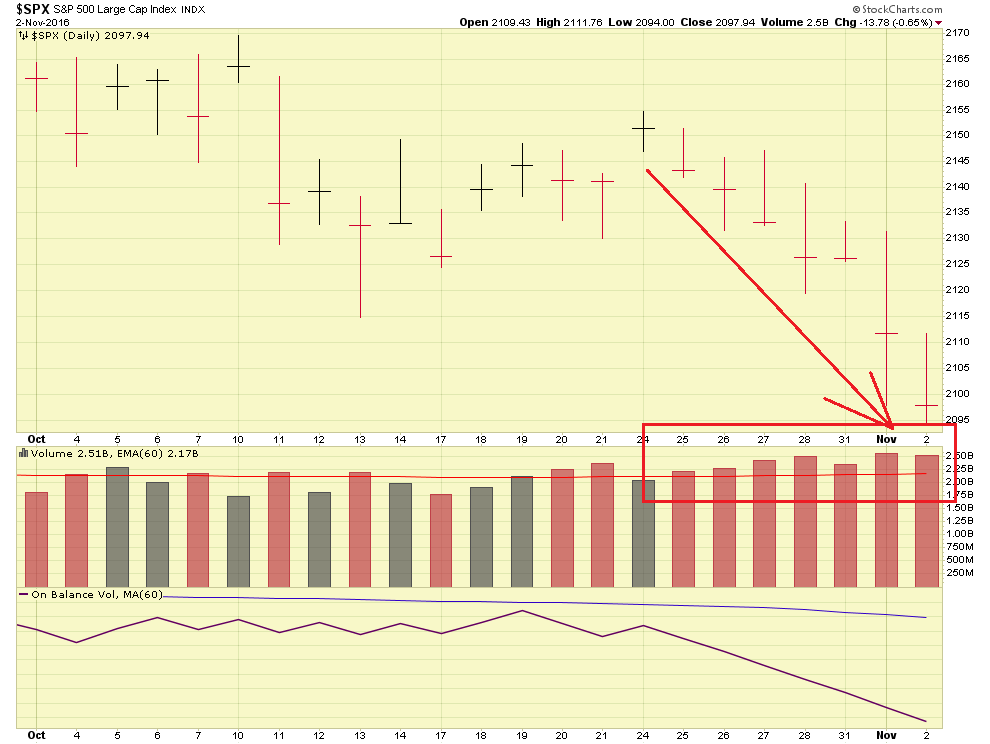
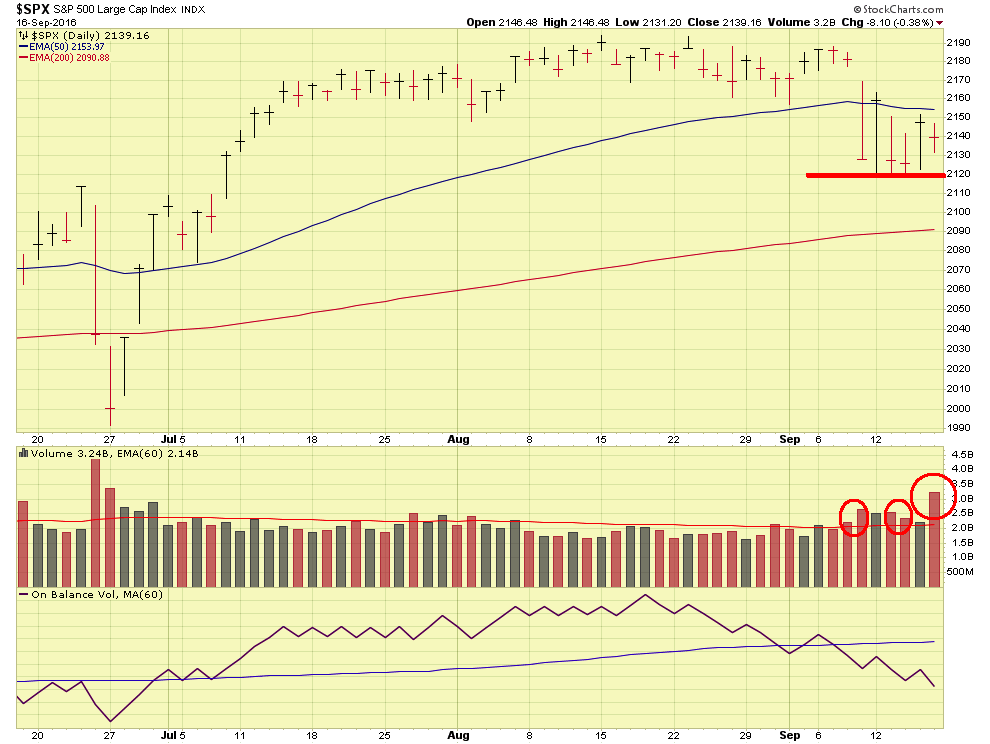
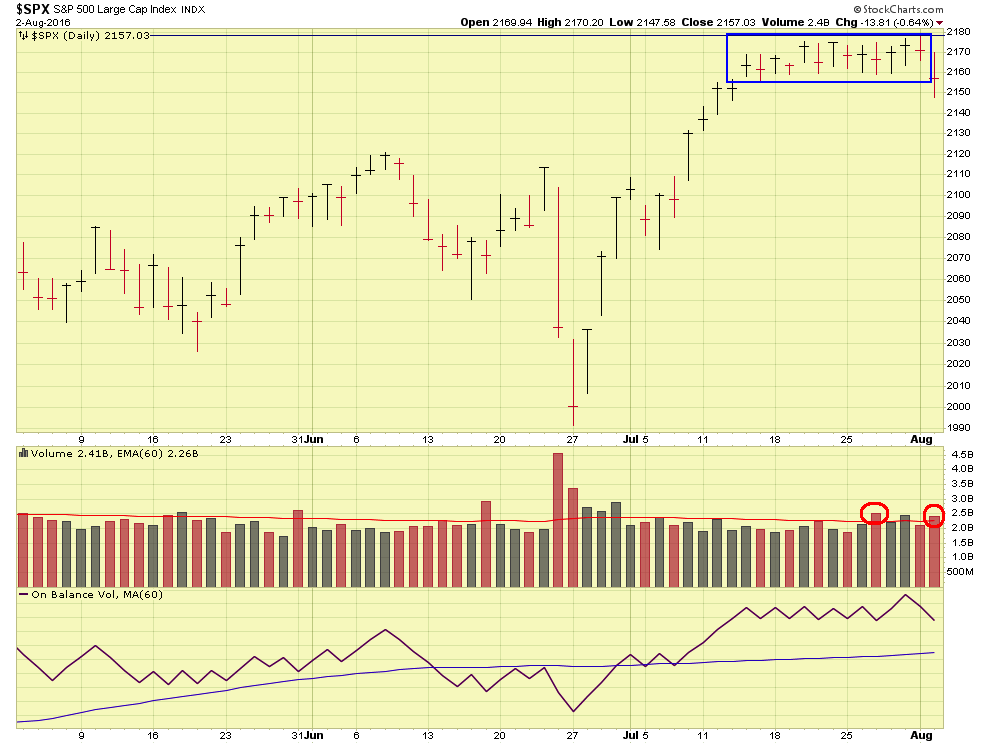
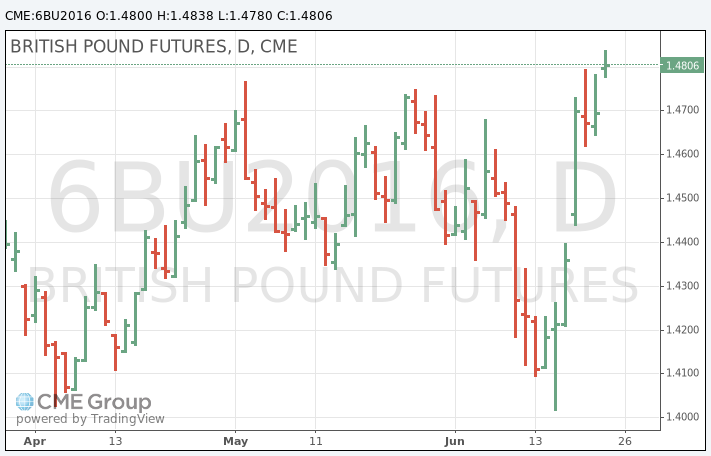
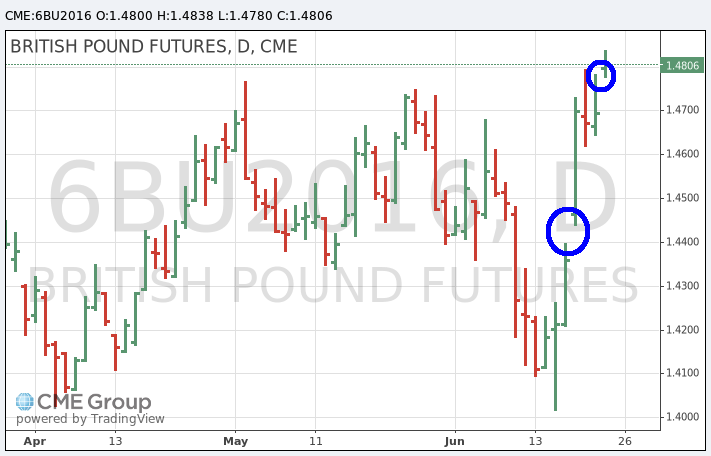
Evident in the above charts, is increased selling and downward trending action which began on Oct-25. This is the same date that some additional news associated to the Presidential race/election was released. Also evident is the index broke below its previously discussed 2120 level, and is now below lows established in mid-September. Since Oct-25, we have seen above average selling/distribution volume on the SP-500 Index, with a distribution day count of 8. Lets take a look at a chart of Gold Futures, you will see the sudden price uptick, commencing in late October.
Note that 4 to 7 Distribution Days in the stock indexes are enough to trigger concern, and any exceedence of that count (like now) is cause to ask “OK, why should I remain in stocks?”
As such, with a pretty major catalyst (political change, see my FAQ #6) in the works, an elevated distribution day count, and inflows to Gold (as demonstrated by its rising price), I will sleep much better right now if I move 100% G-Fund.
After the elections, stability may return to the markets, and I may return back to the stock funds. Any triple-digit gains the morning after elections (please don’t email me and lambast me about “missed gains”)- be careful and don’t count your chickens before they hatch, the markets have a unique ability to trick the investor into doing something he may regret. I am going to step back, monitor the situation, and will not return to stock funds unless I am comfortable.
All my opinion, and subject to being wrong, but right now I would like to catch up on some missed sleep. Thanks for reading and talk to you after the election !
-Bill Pritchard