Hello Everyone
Well, “as predicted” on this site, on May 18, 2016 and June 8, 2016, in which I spoke about the “expected” (by major financial press reporting) June interest rate hikes, and explained why I felt it would not happen, as I pat myself on the back, my contrary stance has yet again been correct: The Federal Open Market Committee (FOMC) did not raise interest rates on June 15. Their reasons echoed many of the same opinions expressed by me in my prior posts. With that speed bump behind us, lets move forward and try to explain away the recent market doldrums
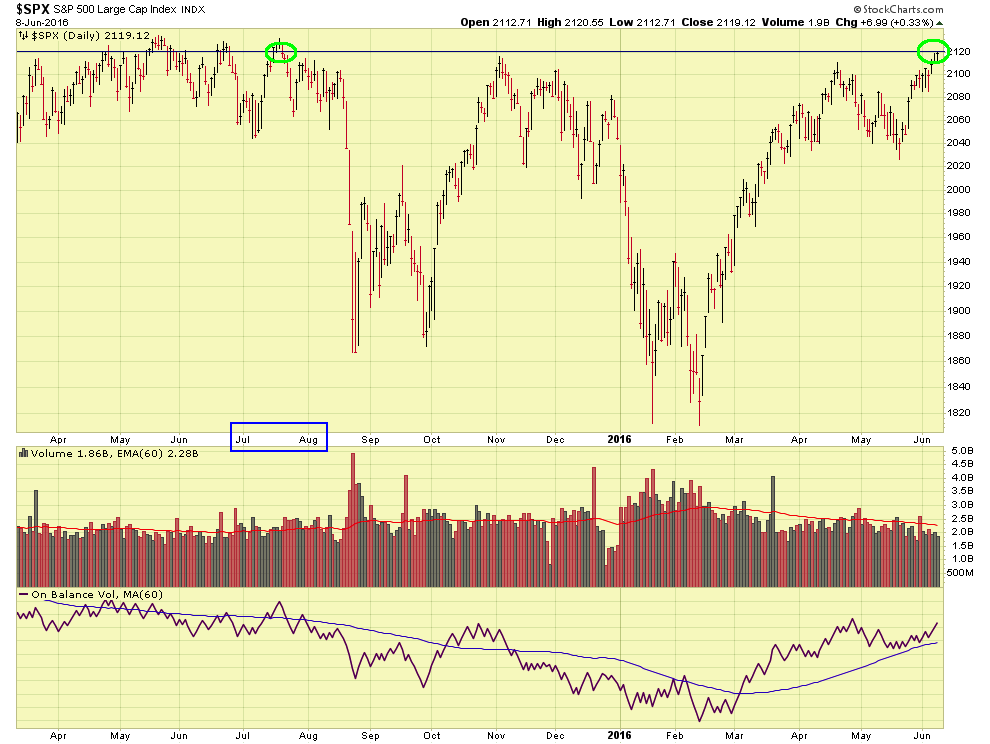
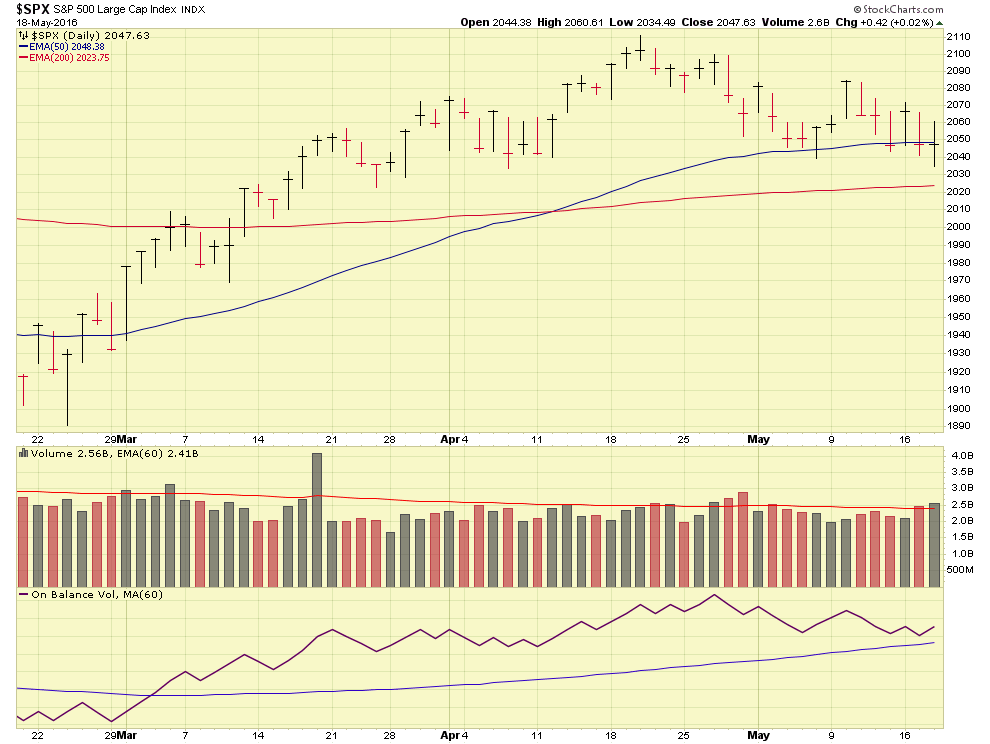
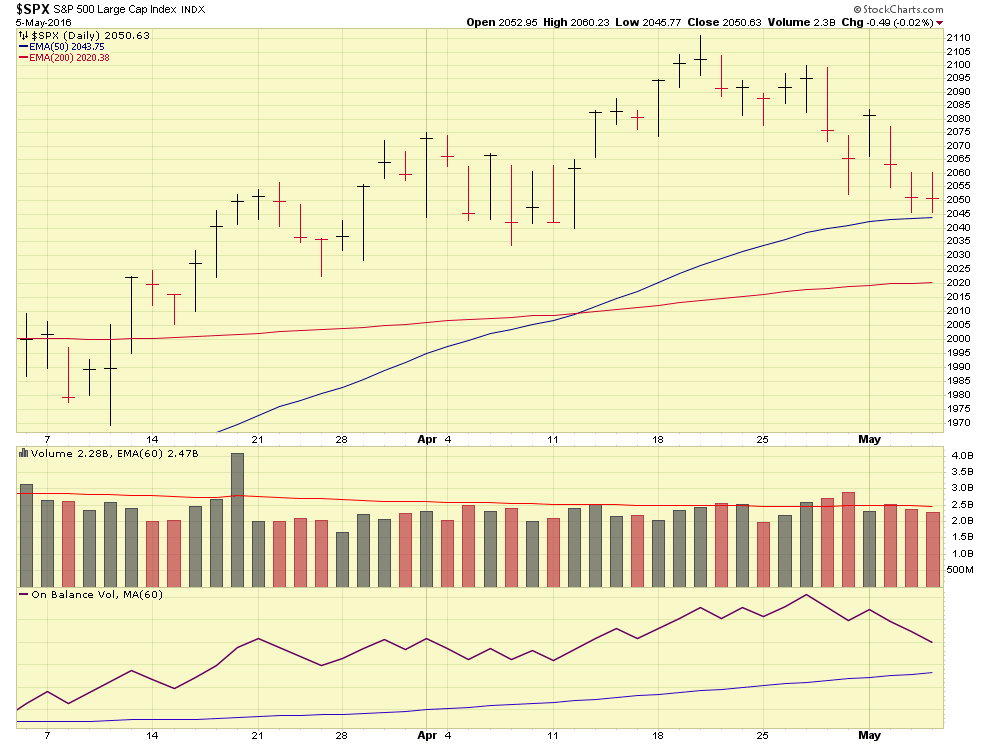
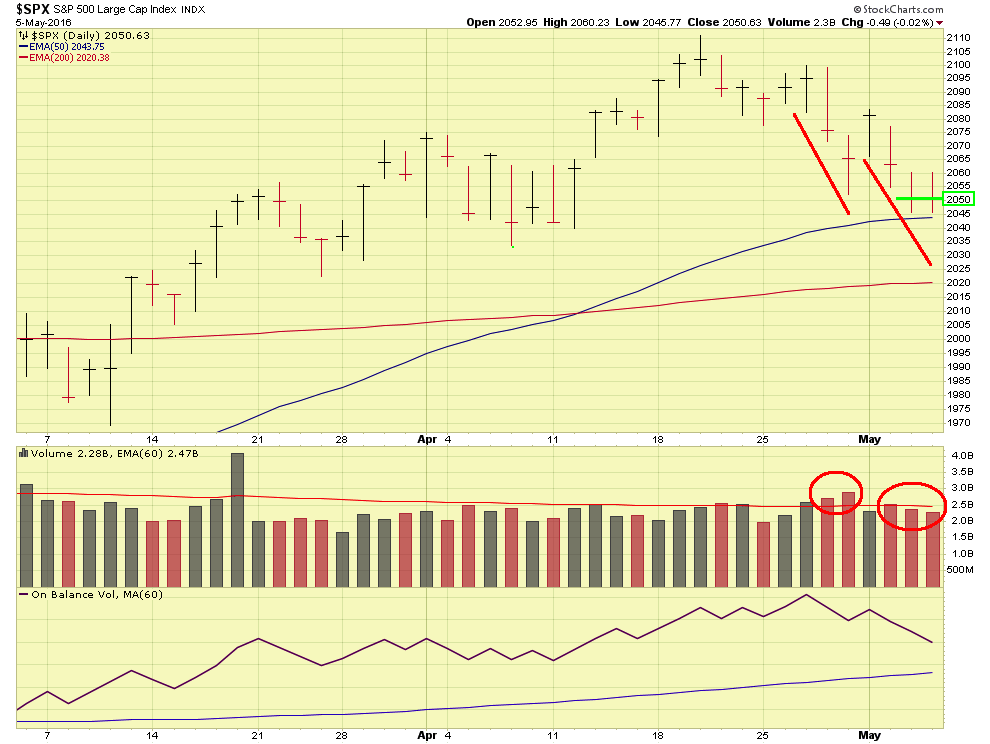
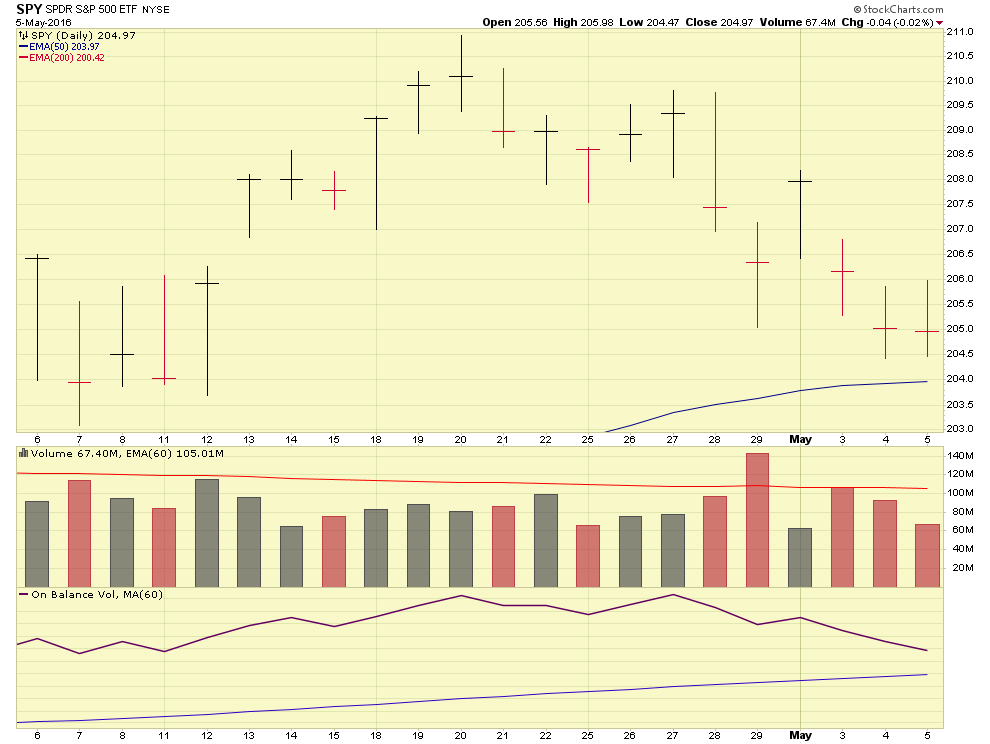
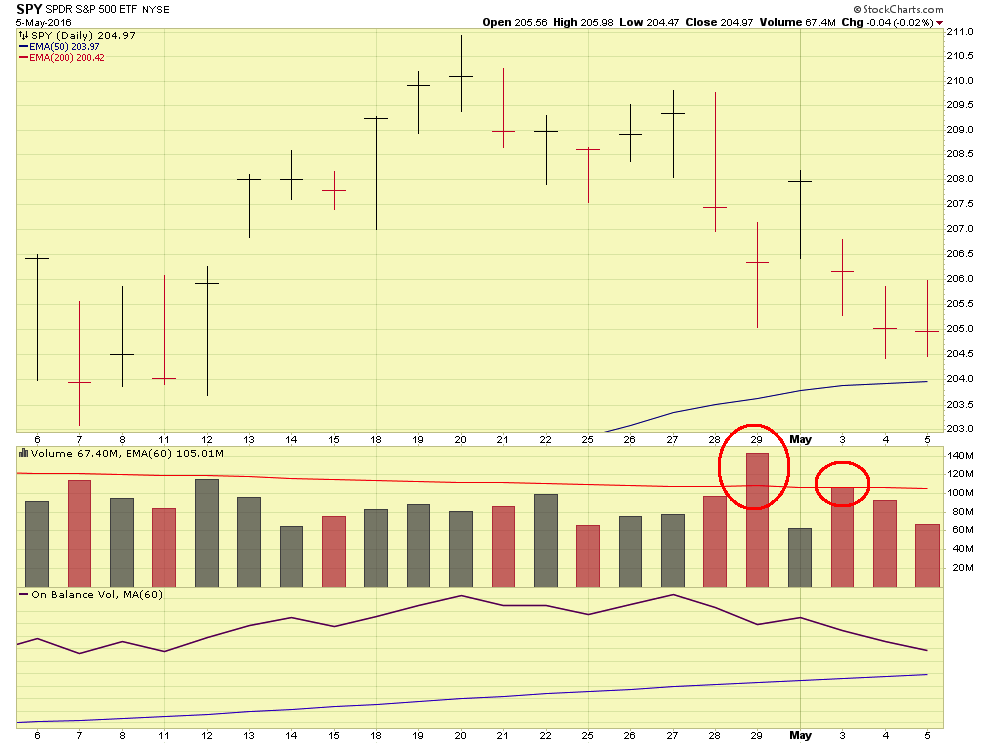
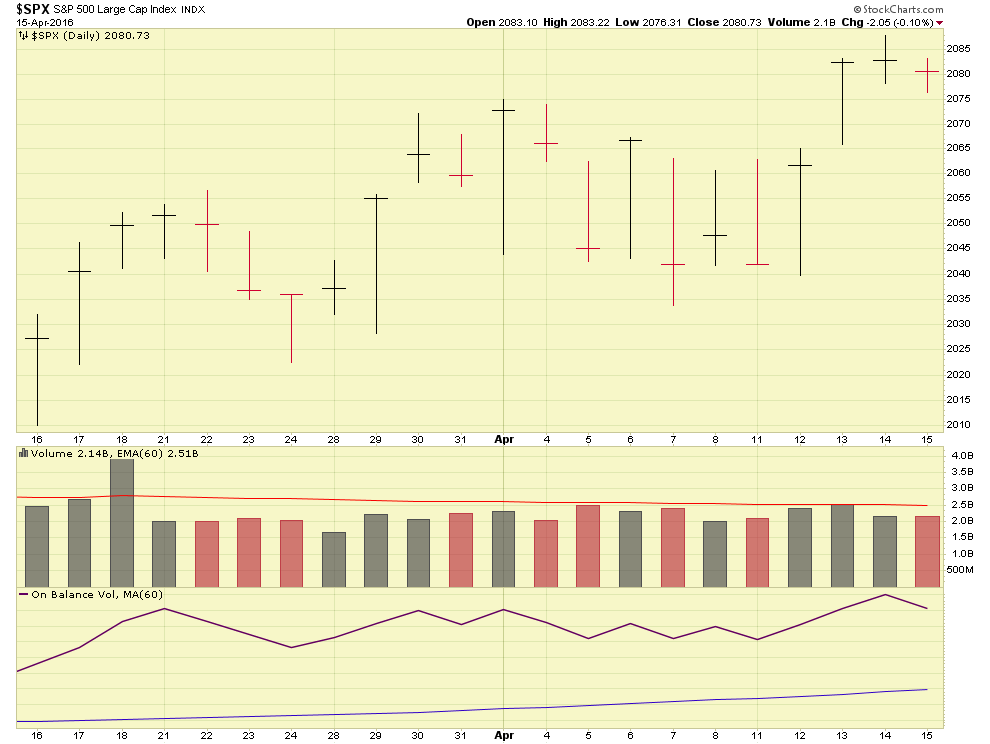
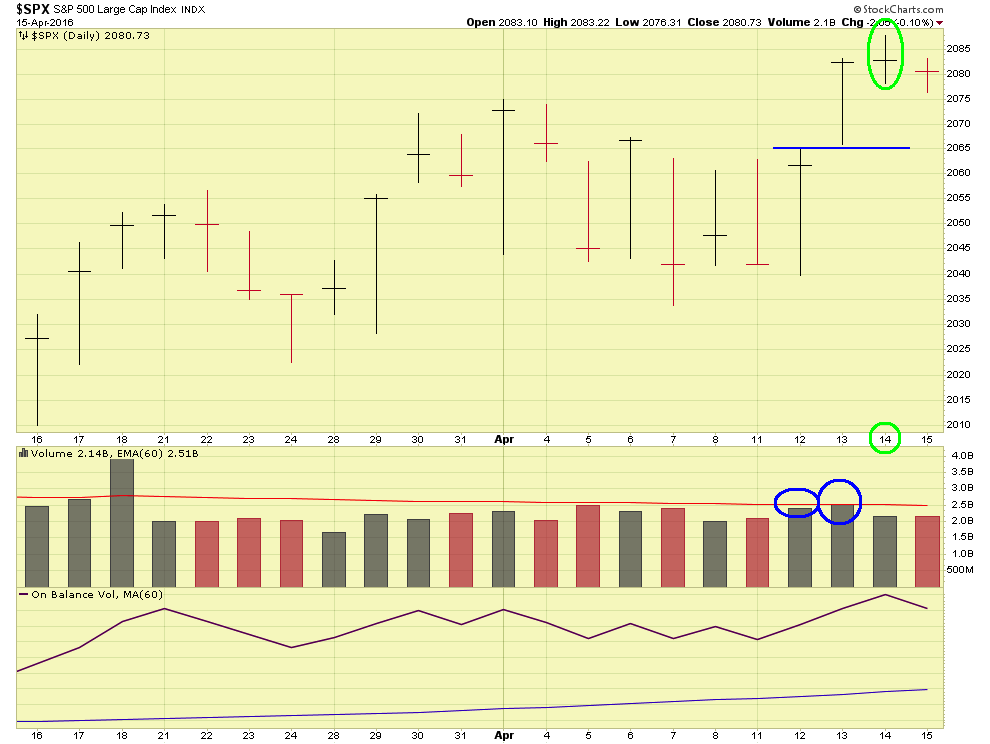
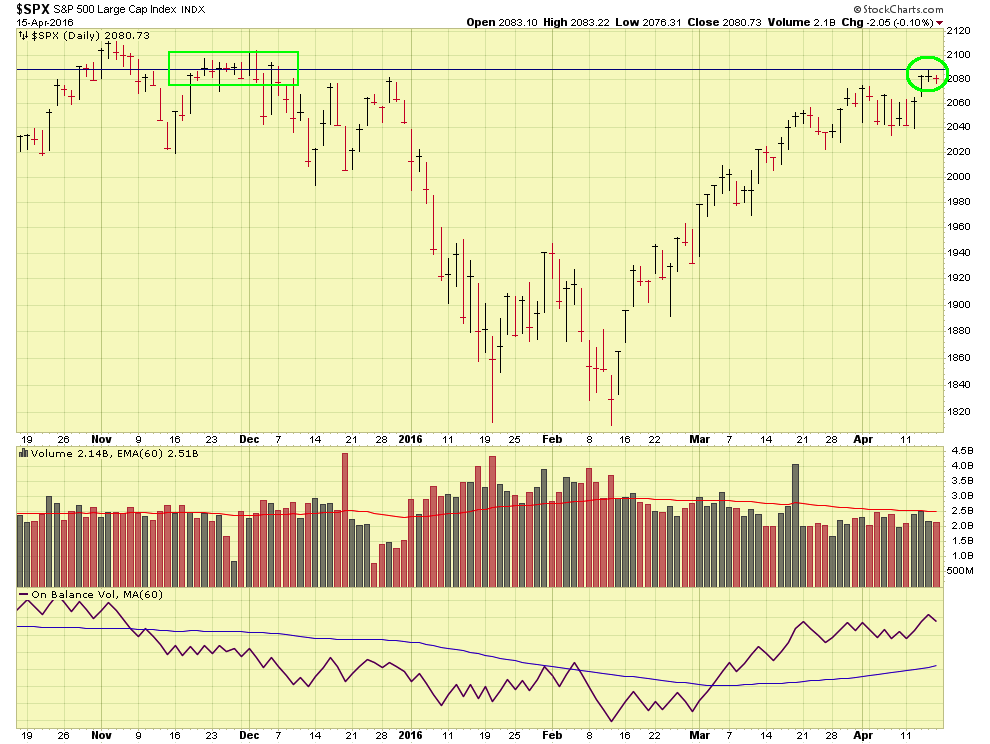
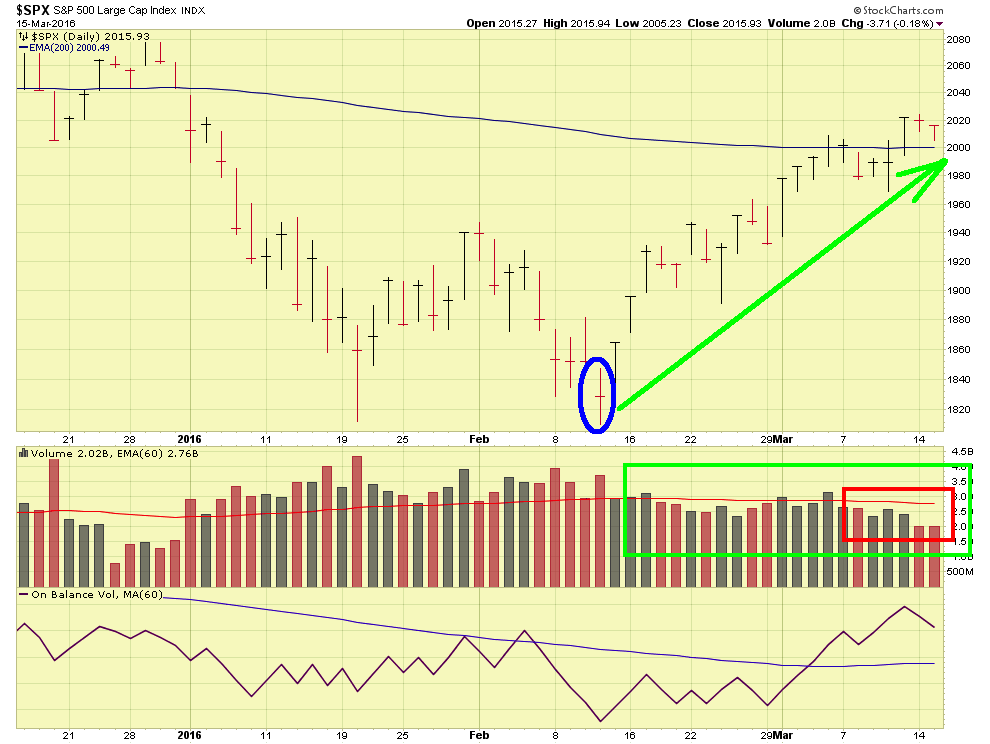
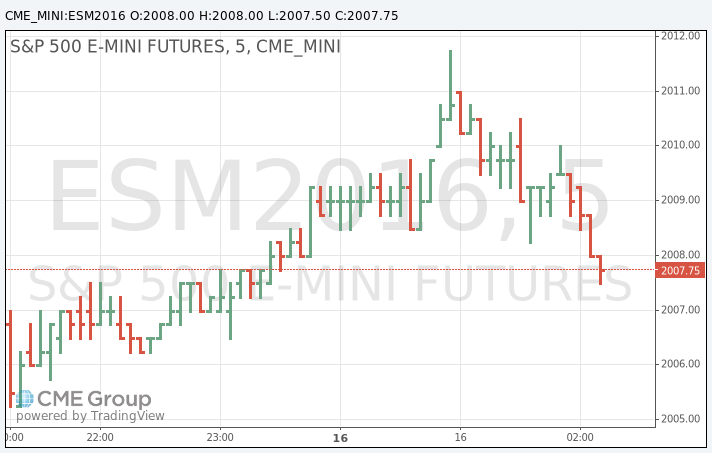
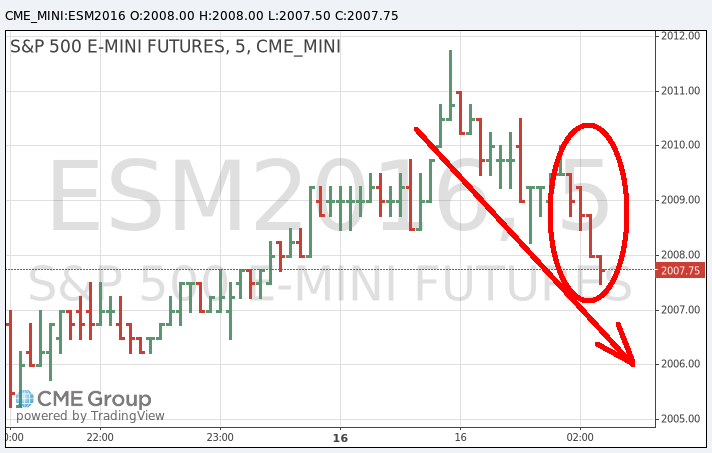
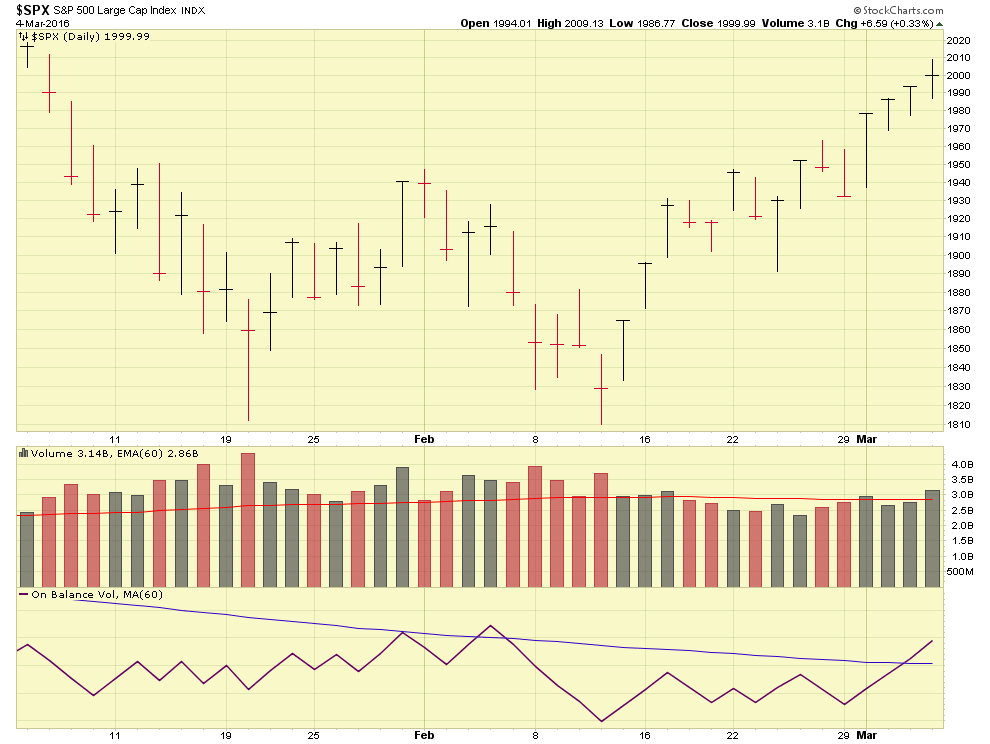
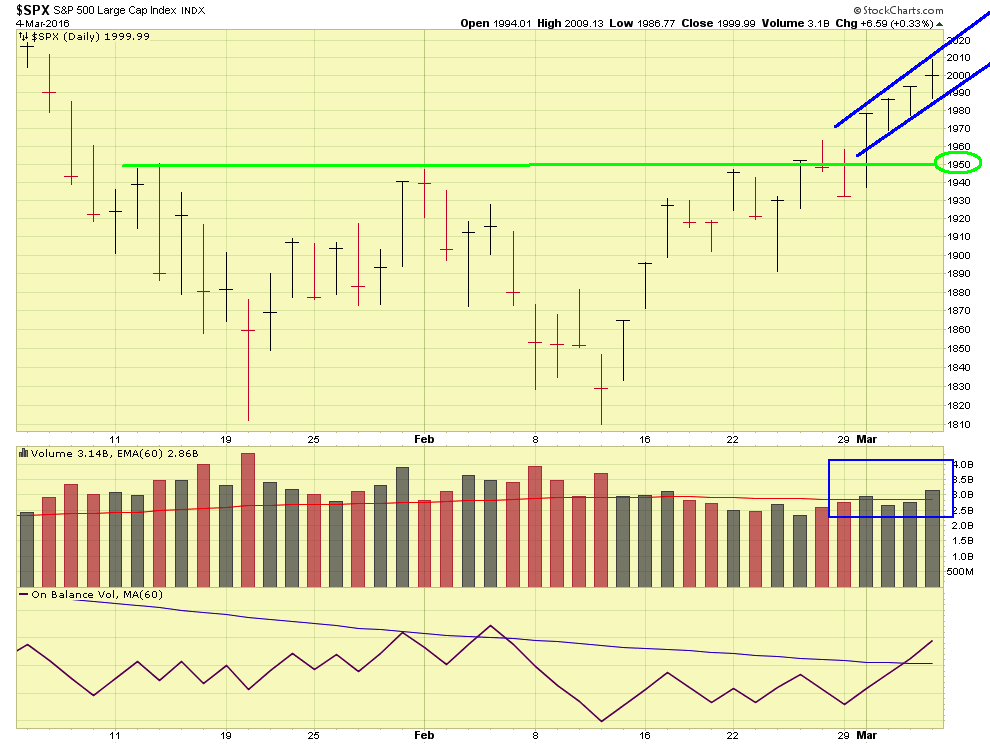
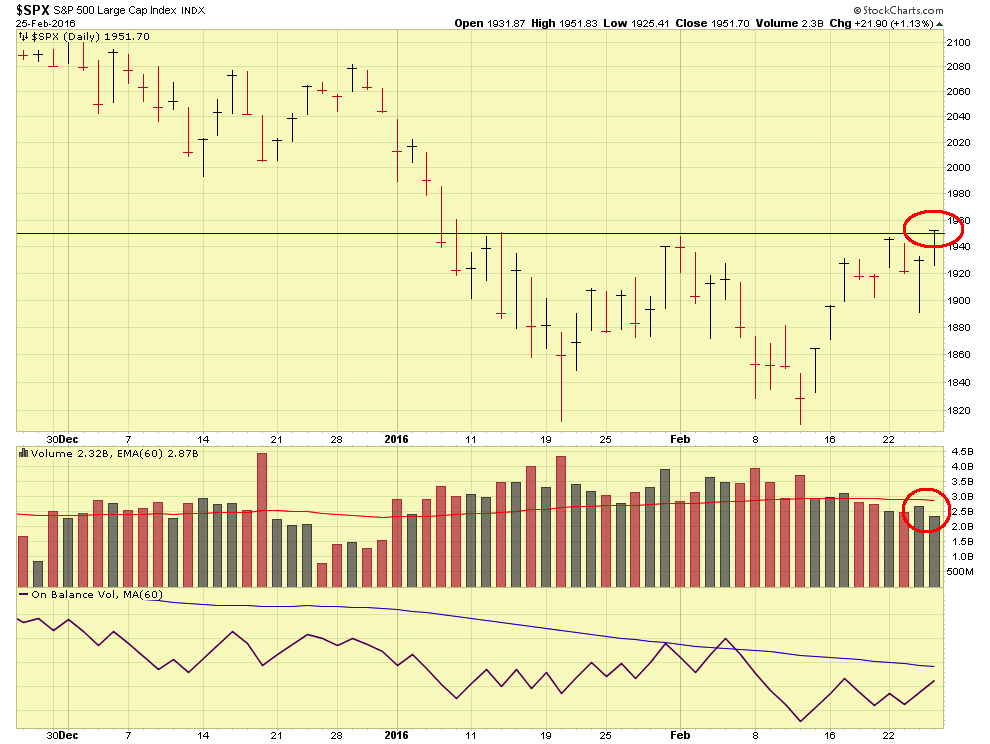
Note that the indexes were doing fine until June 8, at which point they started to go down, however this was on low volume, and hence I am not worrying (too much) about the recent hiccups in the market’s step. The “2100 level” on the SP-500 Index continues to act as an important area. Lets look at some charts:
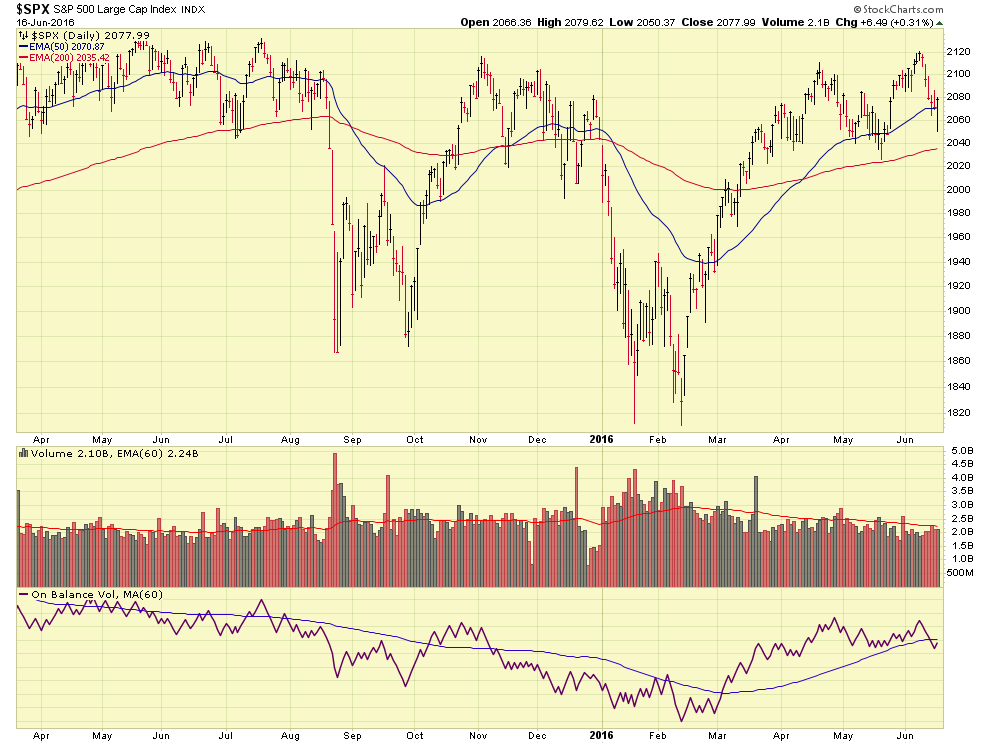
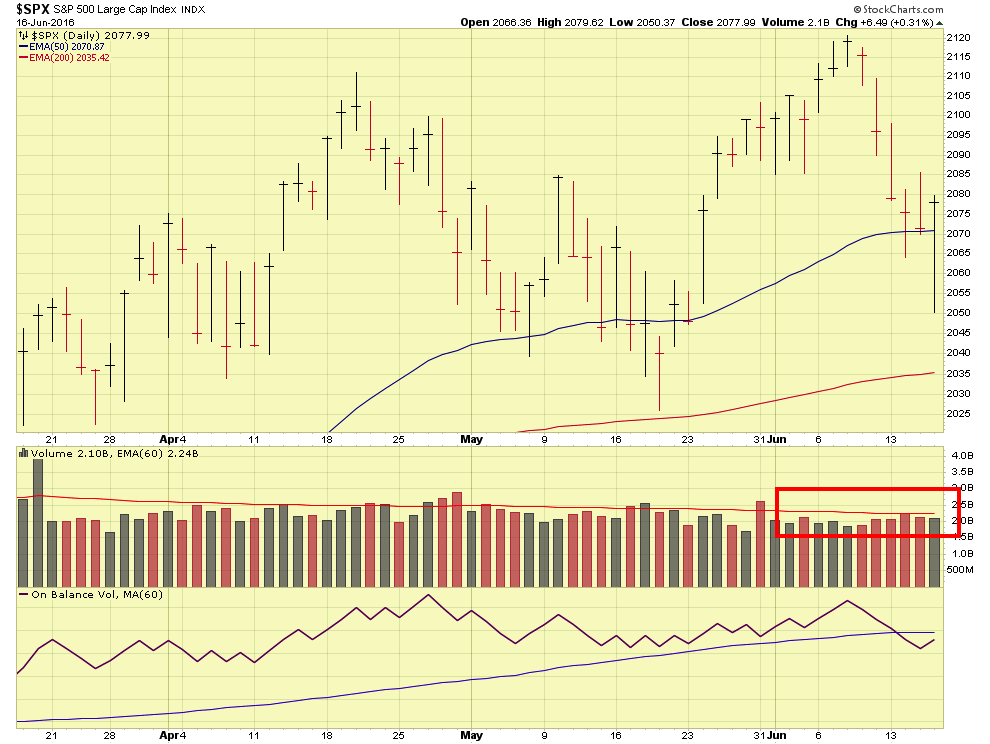
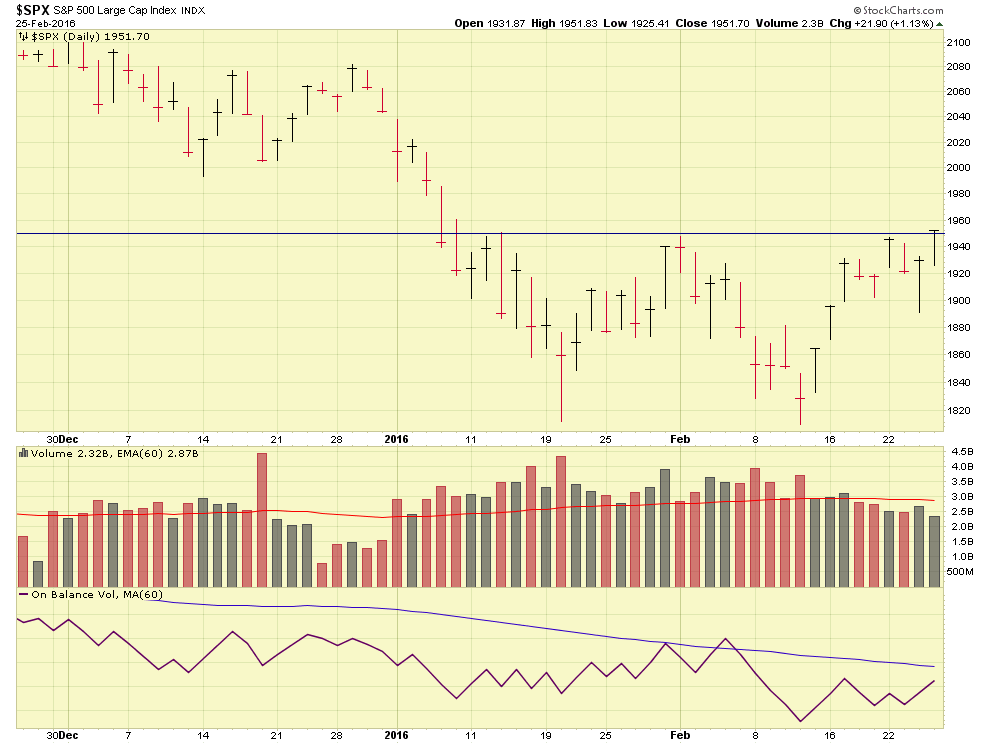
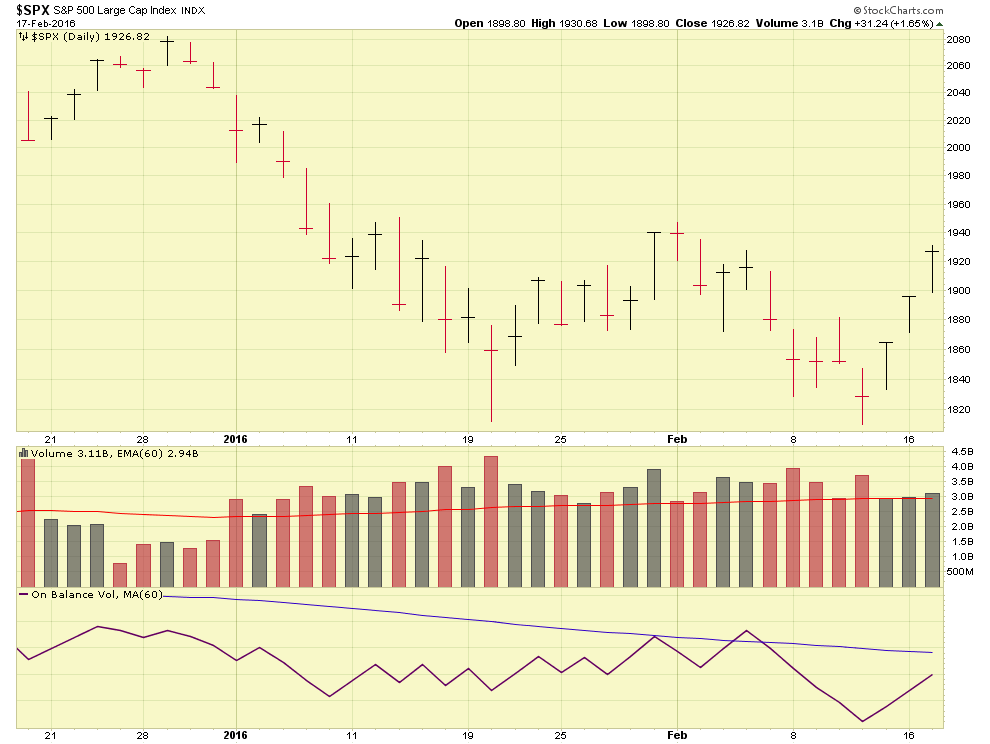
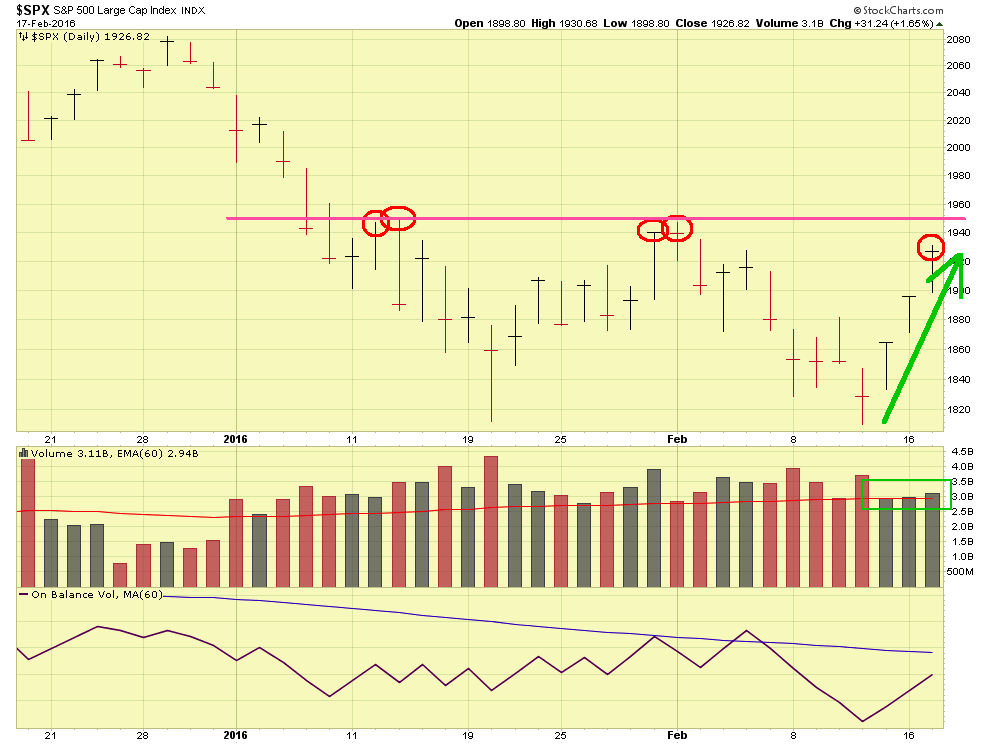
This downtrending action stopped, albeit possibly temporarily, on June 16, with the markets closing in positive territory.
The next challenge for the markets is the BREXIT Situation in Europe. The date of this vote is June 23. What the heck is BREXIT ? This is the term for the BRitain EXIT vote from the European Union (EU). Actually the United Kingdom (UK) but nobody can pronounce UKEXIT so it is BREXIT. Similar to GREXIT which was GReece EXIT.
Without going into a 25 page dissertation on UK politics and EU relations, the supporters of staying IN the EU is the UK Prime Minister himself, also our US President is supportive, also Germany, and China, are supportive of UK’s continued relationship with the EU. Others are not supportive, their argument being that (among other things) the EU is “dragging down” (due to various weaker member countries and spill-over contamination) the UK and thus exiting will solve immigration issues, promote UK financial health, and free the UK from general EU headaches.
In sum, most BREXIT watchers believe an exit would be negative for the US markets and negative for UK overall. This bears watching by TSP participants since, as we know, US markets do not like uncertainty and in today’s era, our markets are very sensitive to activity overseas.
Changing gears, I would like to say “Thank You” to everyone who has participated in the various polls. If you have not participated, please do so. Some have brought to my attention some browser/computer issues when they open the polls, what I recommend, is go to the below links, right-click on the link, choose “Open Link in New Tab” then vote in the poll in that new tab.
Return to this page and repeat the process until you are done with all Polls.
http://www.poll-maker.com/poll715808x03964090-29
http://www.poll-maker.com/poll715812x388f14f4-29
http://www.poll-maker.com/poll715816x1Ceb4E8d-29
http://www.poll-maker.com/poll715821xd304c19E-29
http://www.poll-maker.com/poll715825xDEa84F39-29
I appreciate your participation as it allows me to stay in tune with the audience.
Nothing else to report, No Further Information (NFI) for the many of us that have used that terminology in reports….talk to you soon and thank you for reading. Have a great weekend.
-Bill Pritchard