Hello Everybody
I am disappointed to report that 2016 continues to return poor market action, this is not the way we want the “tone” set for the rest of the year. I had similar sentiment last year, and in what is an apparent Déjà vu “been here before” post, dated January 7, 2015, the markets started 2015 poorly, and we all know how that worked out for us. Some may disclaim the “January Barometer”, but it works pretty good in my opinion.
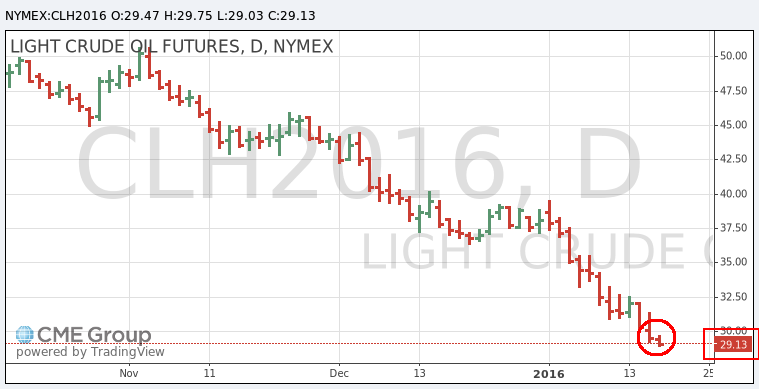
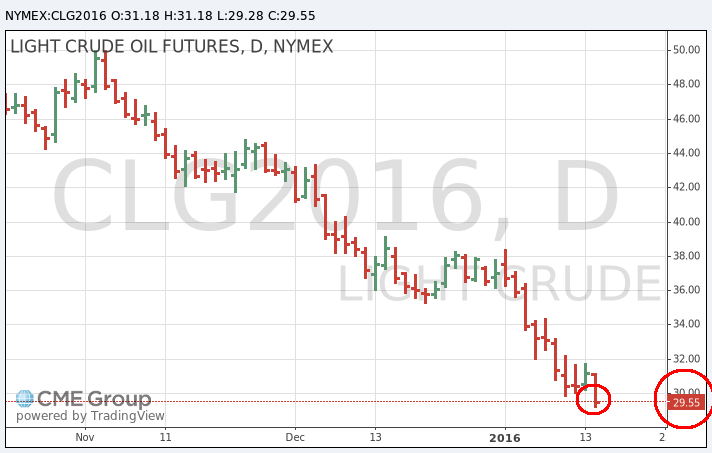
The only difference between then and now, primarily, is that now, we had a recent interest rate hike, and additionally, more hikes are expected this year (2016). One other difference is the “$50 cheap oil” last January? Well that oil is now priced at $30 per barrel, or 40% cheaper than the January 2015 price.
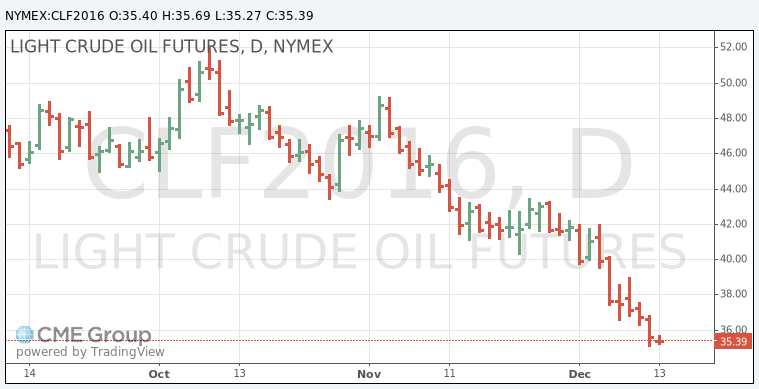
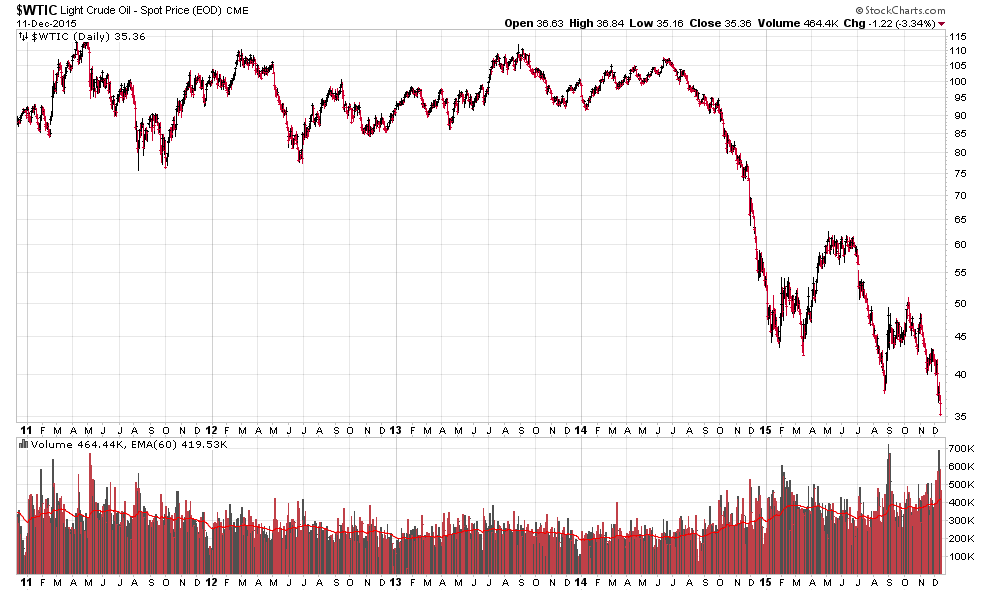
Indeed oil is a major concern for the markets, and prices have continued below the $35 level, previously considered by some to be a “support level” or “bottom” prompting many to invest in oil related industries. I expressed some concern to some friends who wanted to “get in” on “cheap” oil stocks. “It can’t get any cheaper” etc was often tossed about. The funny thing about the market is that it’s pretty hard to outsmart, unless catching falling Ginsu Knives with your bare hands is something you like to do. Flash forward to January 2016, and Crude Oil is trading at $30 a barrel, and even touched sub-$30 on January 12. Crude Oil was discussed in my December 13, 2015 post, in which I stated:
“….Prices per barrel, need to be $55, for the oil companies to make a profit and yet not result in super expensive gasoline prices for the consumer. This person felt that prices could continue lower, into the “sub-30’s” for price per barrel. We are at $35 now…”
So what does all this mumbo-jumbo mean for the TSP Investor ? Well, the only one I can speak about is me, so it should be no surprise that I remain 100% G-Fund. I occasionally get emails as to why I state (FAQ #12) that the G-Fund is good place to protect your account from a loss. “Why do you say that” or “How did you come up with that [lame brained] idea” is sometimes asked. Well, I hate to break the harsh news to anyone, but I am not the only one who feels that way, the TSP folks themselves say the same thing on their own website. Lets take a look:
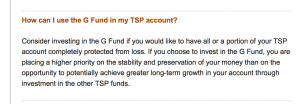
So again, yes, yours truly goes to G-Fund when he sees storm clouds ahead, which is not in disagreement with the doctrine put forth on the TSP home page. So when a coworker or someone admonishes you for being in G-Fund, please send them to TSP’s own website !
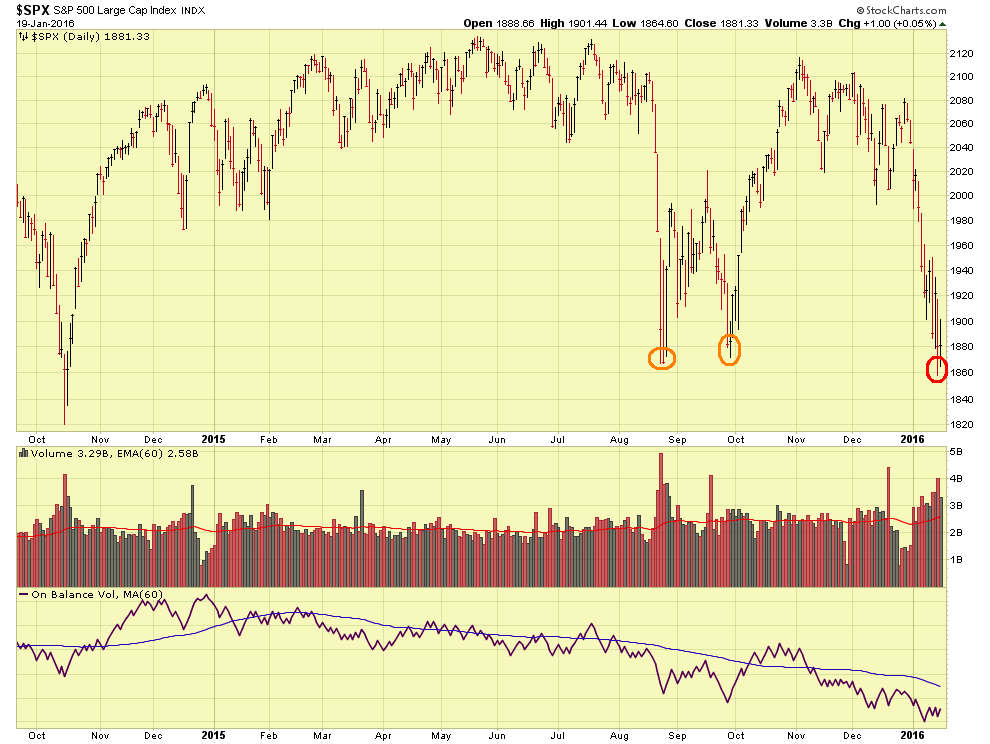
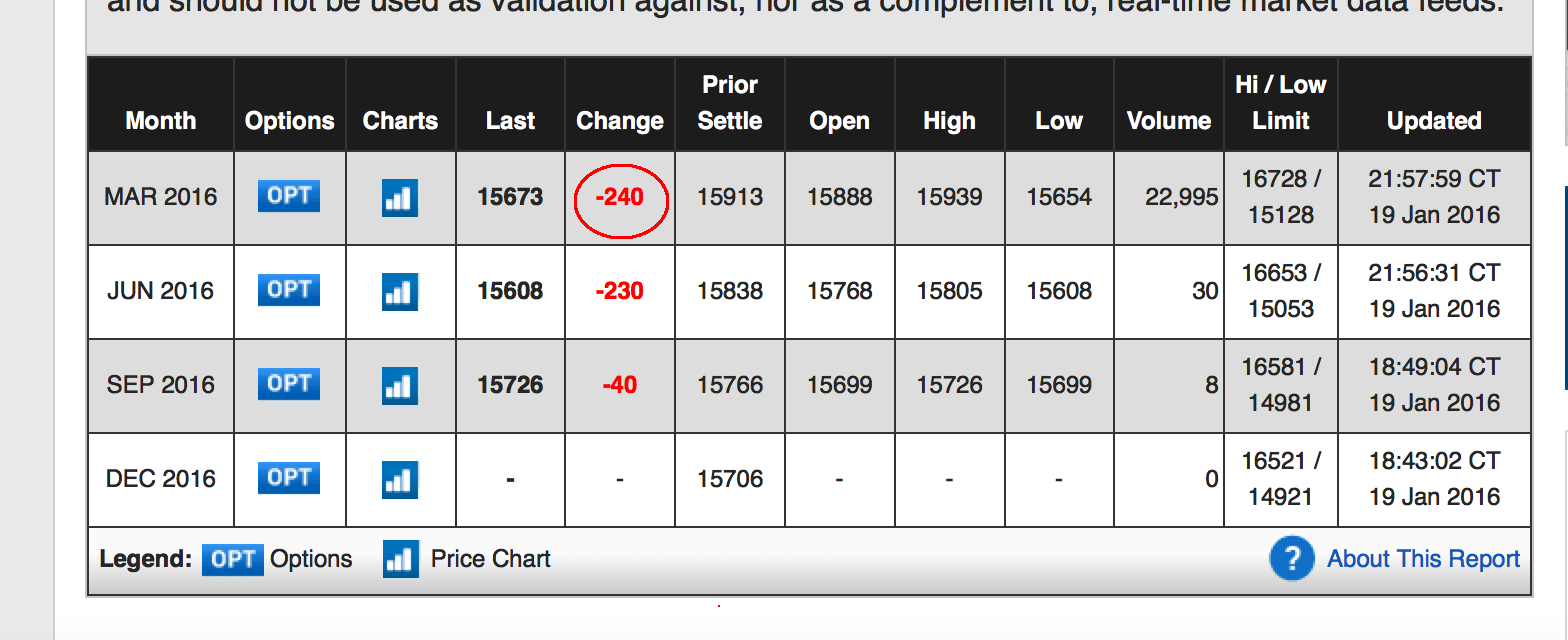
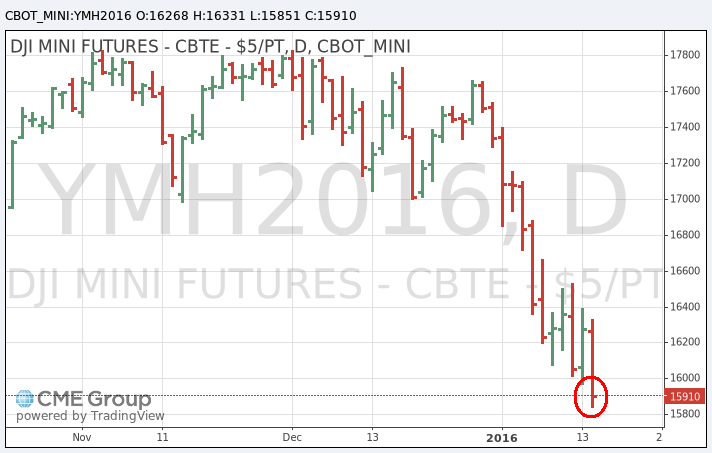
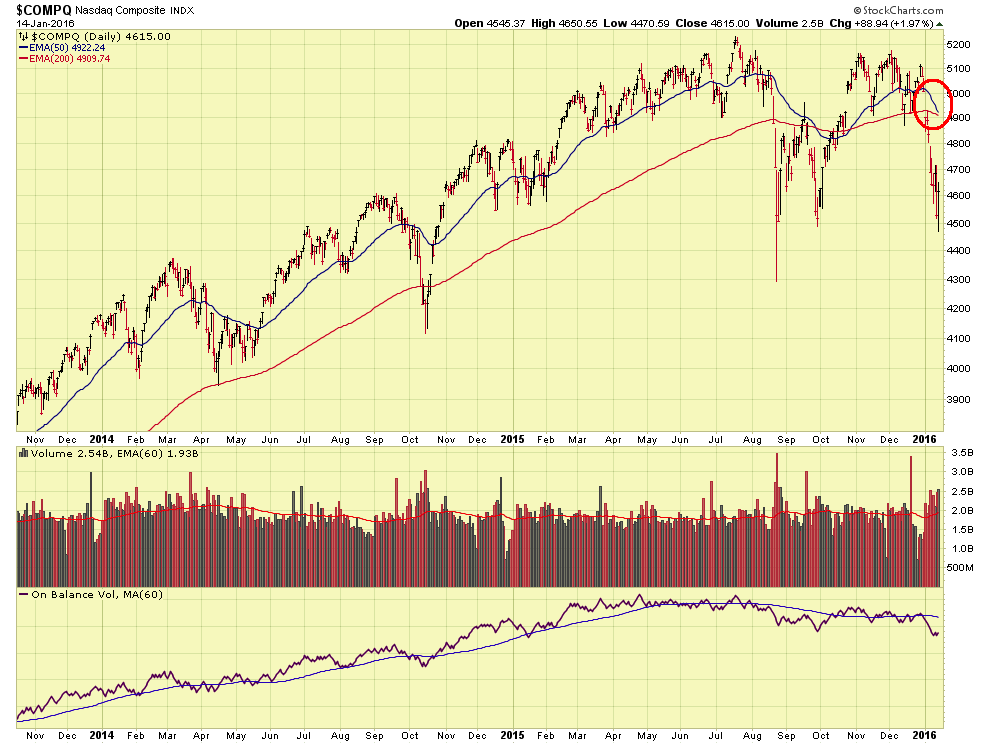
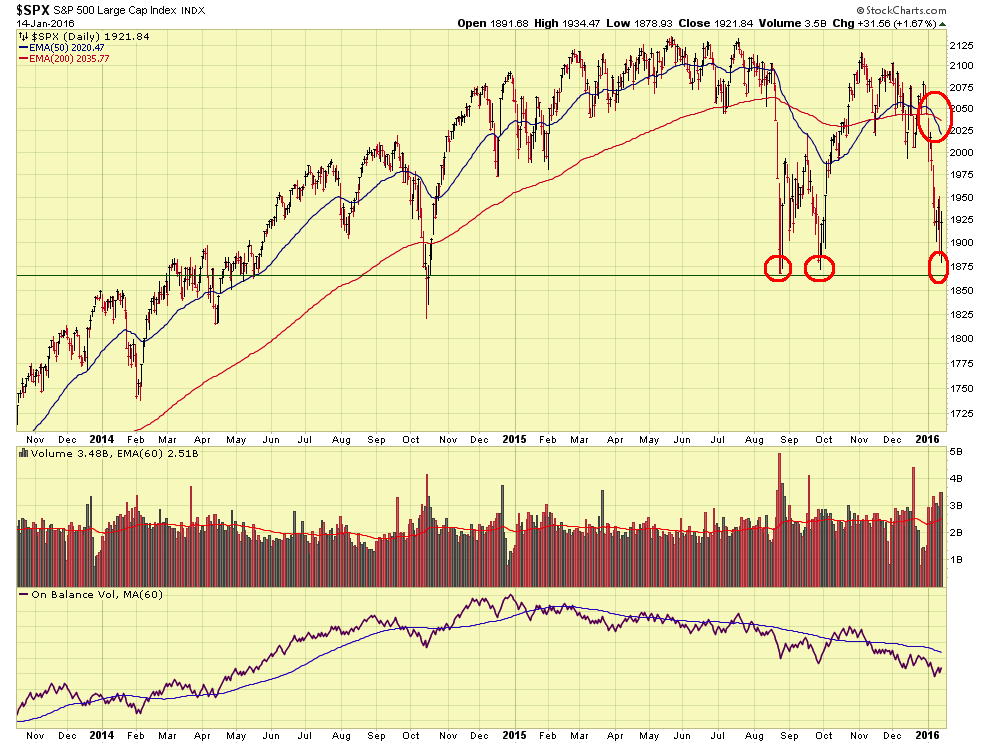
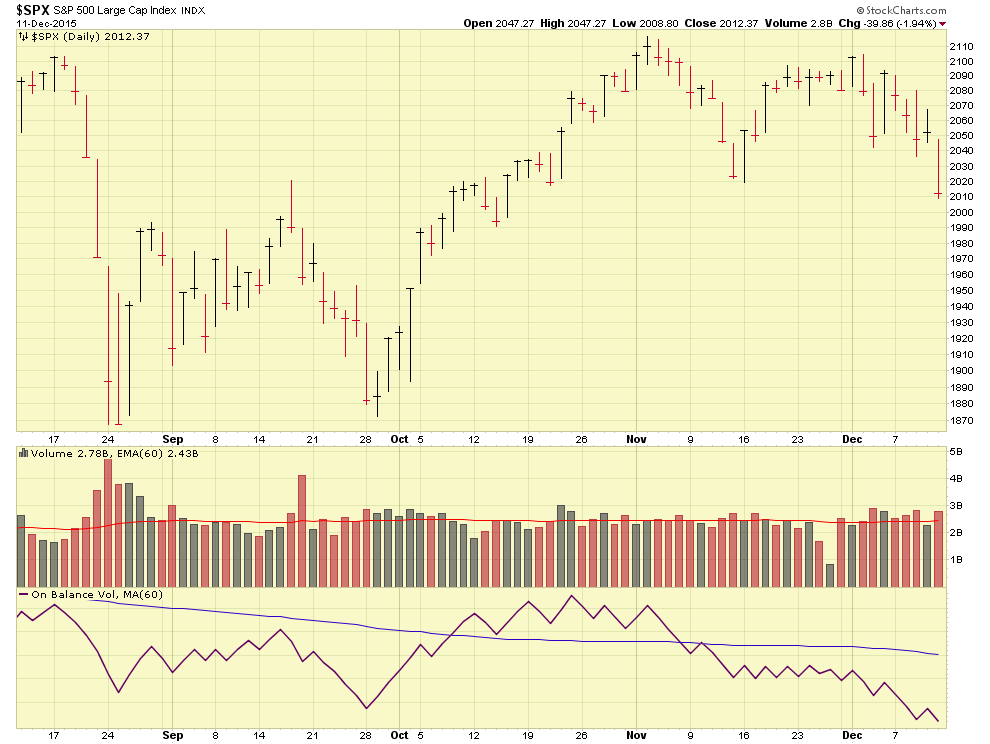
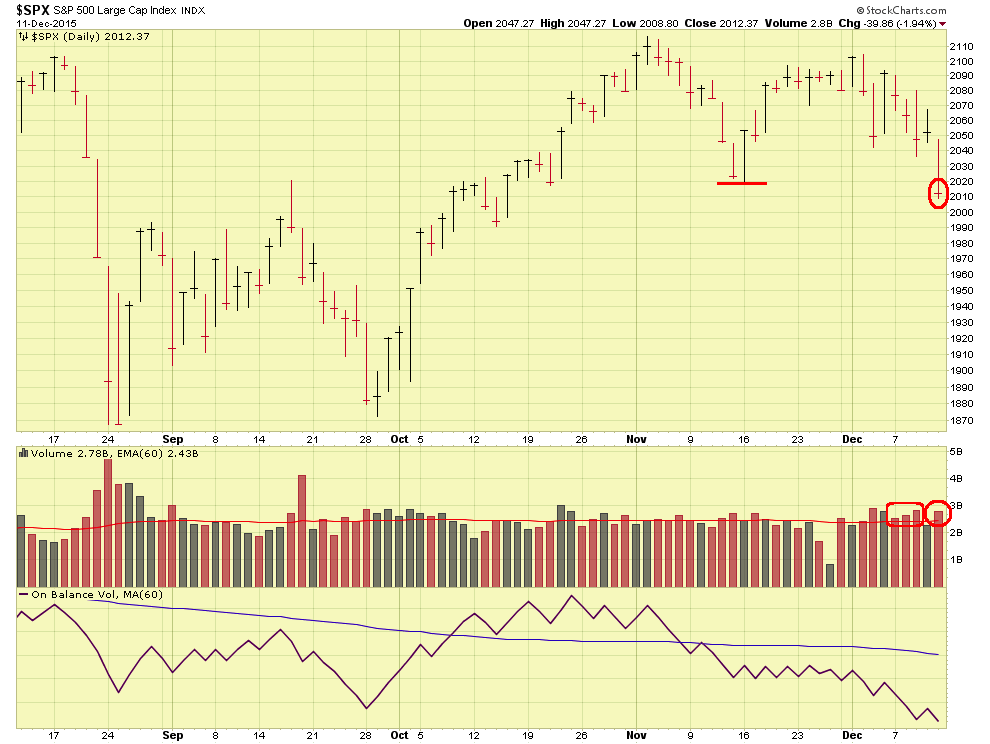
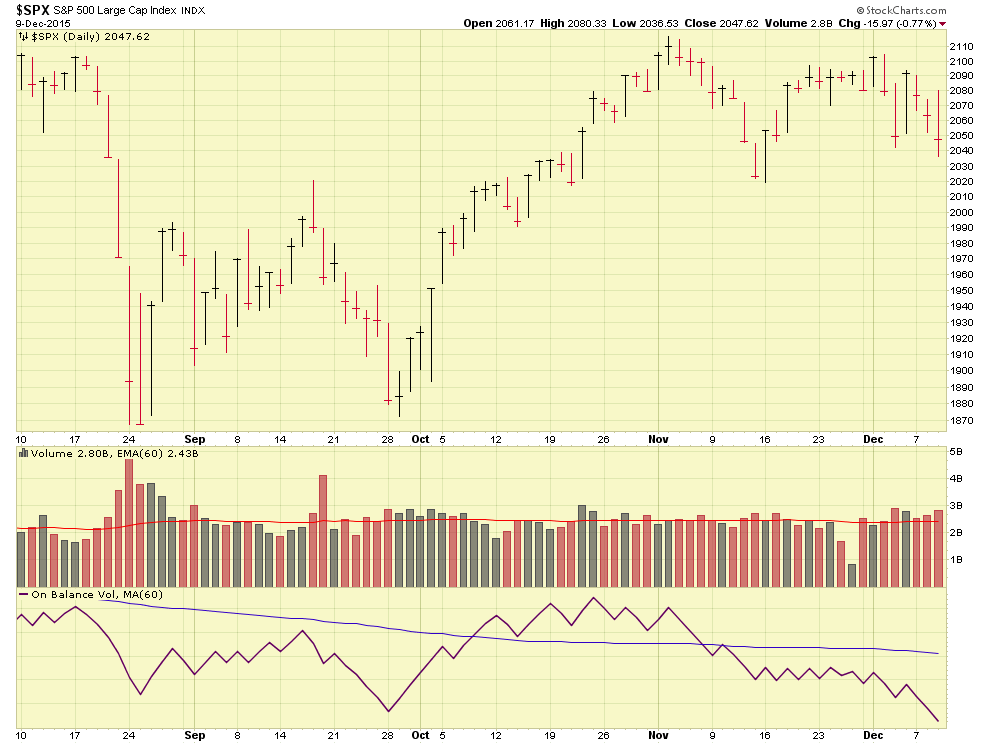
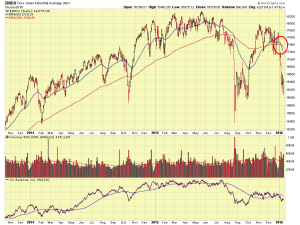
Moving forward, lets talk about the markets. The Dow Jones and SP 500 (NOTE: some stocks exist at the same time on both indexes, such as Boeing/BA) have witnessed 50-day and 200-day moving average crossovers to the downside, while the NASDAQ is witnessing an almost-crossover (did not occur yet, but soon). These crossovers are a pretty reliable “bear market” signal, especially when used in conjunction with volume analysis and backdrop fundamental analysis (interest rate hikes). Lets take a look at some charts, the 50/200 cross is shown via a red circle:
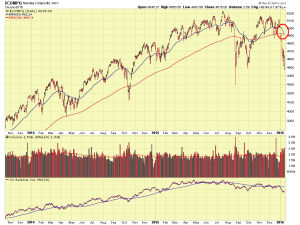

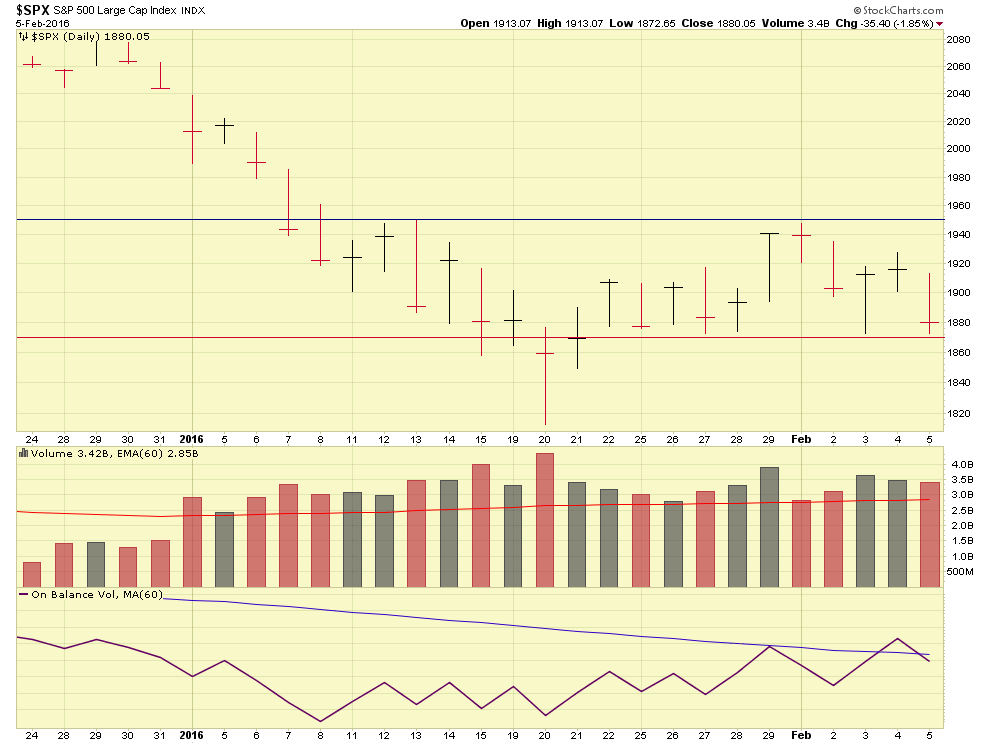
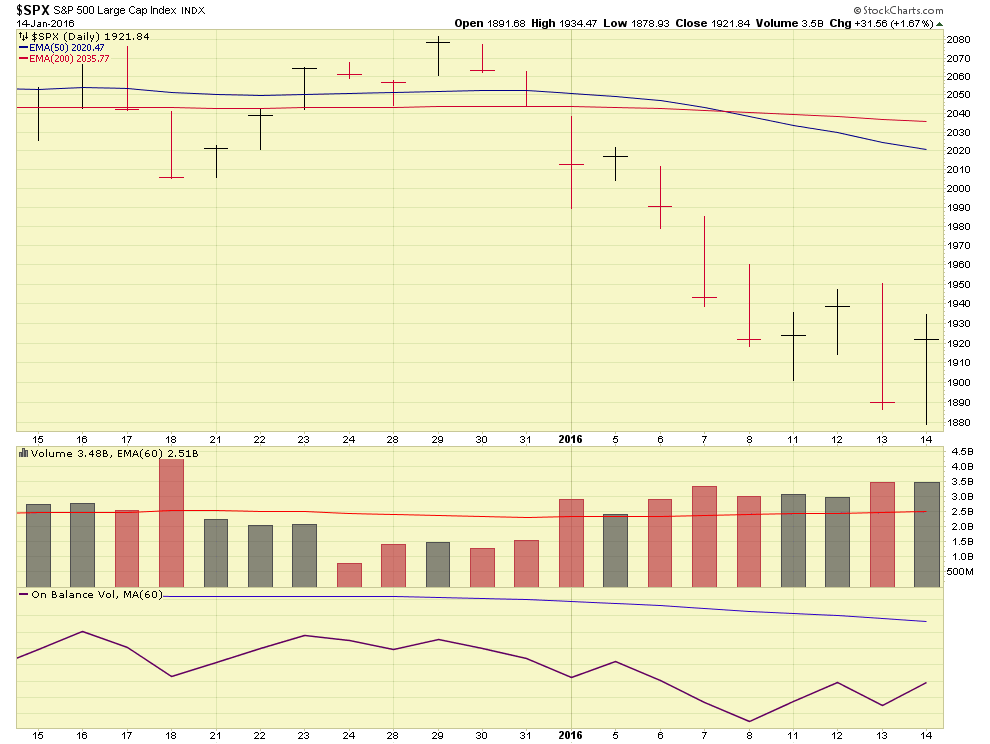
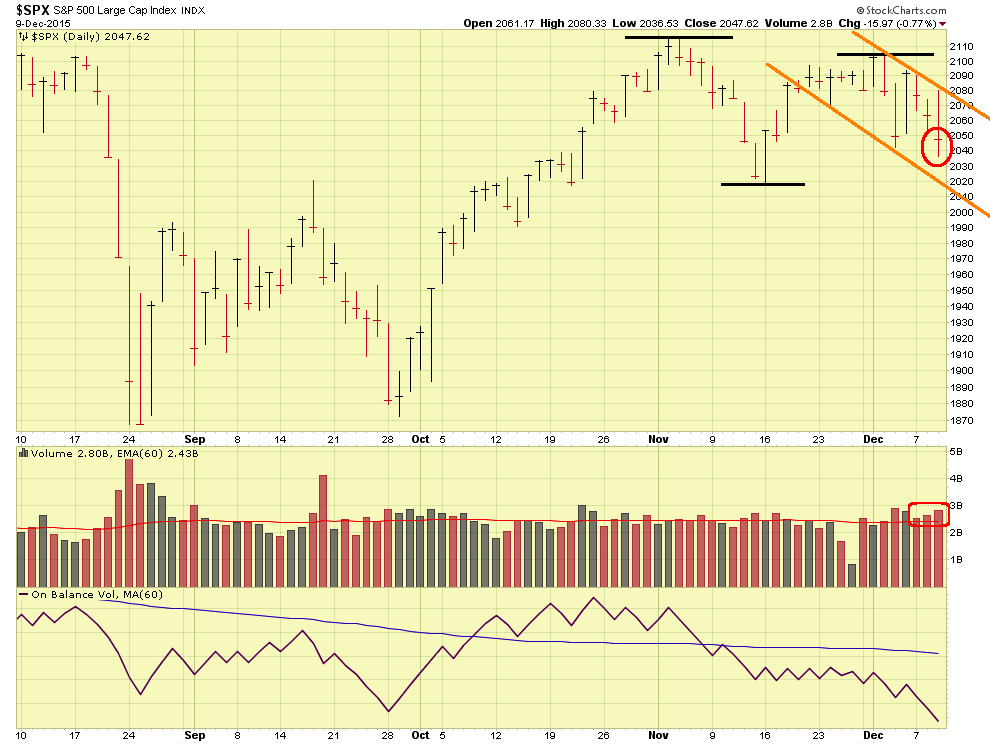
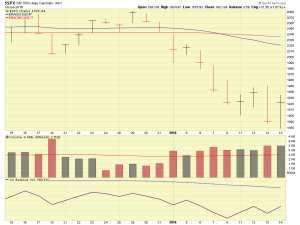
The last chart shown is the SP 500, my “go to” index for market analysis, as it contains a mixture of NASDAQ, NYSE, tech, industrial, and other stocks, and (in theory) represents the biggest, healthiest companies in America. Allow me to post a closer-range shot of the SP 500 index, but for my discussion, please refer to Chart #3 above, and the below charts.
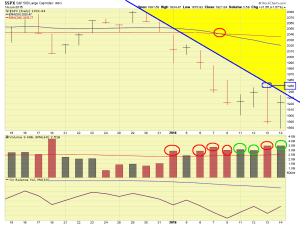
As can be seen, since the beginning of 2016, the index been in a downtrend, on above average volume, reflecting distribution. Some believe this is the worst calendar year-start, ever, in history. The chart with the yellow portion above reflects an approximate trend line, indicating that 1950 must be attained before we can even think that this trend has started any attempt to reverse. Looking at the larger charts, it is apparent that 1865 is a pretty good area to consider “support”, as this is slightly below the August 25, 2015 low of 1867.30, and subsequent close calls to that area. So again, the areas we need to watch are 1865/Support, and 1950/Trend reversal. If the index hits 1950, this is by no means a sign the downtrend has stopped, merely a sign that it is trying to regain some life.
The Dow Jones traded higher on Thursday January 14, which feels great and makes nice headlines for cable news networks, however sadly it did not trade higher than the day prior (January 13). This inability to trade higher than the prior day means by default that the trend is not reversed, no matter how many “points up” the market is that particular day. To put this into perspective (or maybe muddy the water), Trainee Jones has a PT test next month, and this week, on Monday, he was able to do 100 push ups until exhaustion. Tuesday he did 80 push ups, Wednesday, he did 60, Thursday he did 40, and on Friday, he does 38, which is much better than expected, but he did not exceed Thursday’s performance and is clearly not on the path to improvement, being far below his Monday performance of 100. We want Trainee Jones (Or Mr. Dow Jones) to display a definite trend of improvement and recovery, and one-day bursts of good performance do not necessarily represent that the pattern is reversed.
All TSP Stock Funds are all performing poorly, with December data reflecting that S-Fund and I-Fund were the worst performers of all the funds:

In what is sounding like a broken record, some may recall that I went 100% G-Fund in August (I remain 100% G-Fund at the present time), and may remember my remarks in my August 23, 2015 post that
“…..it takes months, not mere days, for a bear market to fully materialize…”
Well folks, August is four months behind us, and what do we have materializing now ? Who told you first ? If at all ? In all likelihood, it was here.
Our challenges right now include cheap oil, continued interest rate hikes, and uncertainties in China/Asia. Those are the meat and potatoes, headline issues right now, period, end of story. Be wary of any magazine, website, or reported expert who points you to other issues. Lets keep an eye on the 1865/1950 levels and see how things play out over the next few weeks.
Thank you for reading and if you find my (opinion-based) posts useful, informative, or otherwise entertaining, please share this site with others. Talk to you soon…
-Bill Pritchard