Category Archives: Uncategorized

Market update and Thanksgiving Day wishes

Happy Thanksgiving to everyone.  This week’s trading has been rather subdued, due to the holiday and market closure on Thanksgiving Day, and early closure on Friday. With that said, the SP 500 Index has managed to hold onto recent gains yet has been unable to trade higher than the all-important 2120 level.  Let’s keep our fingers crossed for next week’s action, and hope we can go more vertical.

Happy Thanksgiving guys

-Bill Pritchard

October uptrend begins to Deteriorate

Hello everyone

As the world grieves the cowardly terror attacks in Paris, and prays for the victims and their families, let’s take a look at the recent market action.

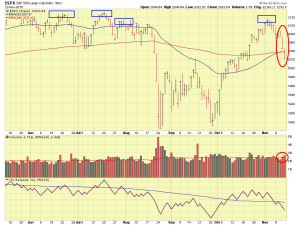
I am disappointed to report that the recent uptrend, which started in, and lasted, all of October, has apparently started to break down.  I previously discussed the 2120 area on the SP 500 Index, and this proved to be a pretty accurate resistance area, as the index failed to break through that level and deteriorated shortly afterwards.   I was contemplating a possible exit out of G-Fund, if 2120 was breached, but that thought has now subsided in light of recent action.   Let’s take a look at some charts:

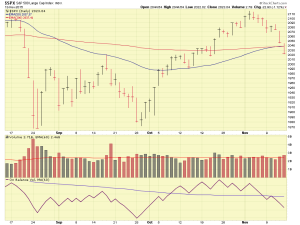
SP500-11-15-2015 SP500-11-15-2015-comments

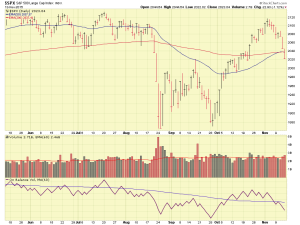
As can be seen above, the October uptrend began to break down during the first few trading days of November.   The distribution day count on the SP 500 is now six days, using Investors Business Daily reporting.   Prior historical data reflects that five or more distribution days within a few weeks time, will typically set the stage up for a new downtrend.  These days are occurring on higher volume, which is a negative sign, likely due to concerns of a December interest rate hike and the ongoing weak corporate earnings reports.  The Friday Nov-13 Paris terror attacks, which occurred Friday afternoon, are not to be considered in our analysis of last week’s action.

Please see additional charts:

SP-500-11-15-2015SP-500-11-15-2015-comments

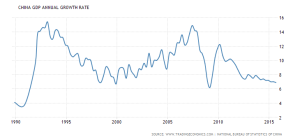
In addition, me, personally, I have other concerns about the market.   One big worry I have is “China”- my opinion is China today, is what USA was in 2007.  My opinion is the economic situation in China is very similar to our Sub-Prime mortgage crisis of 2007-2009.  In addition to China’s housing situation, their GDP has slowed to 6.9%, which is below the desired 7% rate, the first time it has been below that level since 2009.  See graphic:

china-gdp-growth-annualChinese authorities have cut Chinese interest rates numerous times, and this has had little, if any, positive impact on their economy.  So we have numerous data sources which reflect that China is slowing down.  With that said, like the SARS Virus, a flu in the Chinese markets can (and will) infect the rest of the world.

I hesitate to rely on crystal balls or get too heavy into economic analysis, as “price knows all” and at the end of the day, the market is always right.  My preliminary analysis shows that the markets will likely continue to lag, and using a 30-day and 90-day look-back, I-fund is the worst performer, with S-Fund the next worst performer, for those time periods, according to my analysis.  C-Fund is also performing poorly.  The SP 500 index is negative for the year.

To that end, I remain 100% G-Fund.  Thank you for reading and talk to you soon. 

-Bill Pritchard


Conservative Stance Continues with 100% G-Fund

Hello Everybody

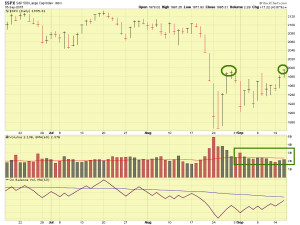
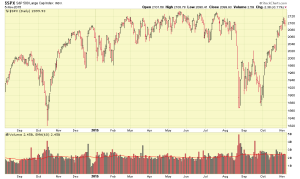
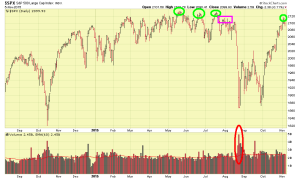
If one thing is for certain, it is that when the markets get frustrating, my reader feedback, website page views, and new subscriber sign-ups sharply increase.  Thank you for your feedback, I truly appreciate it.  With that said, yes the markets have rallied but only just now are they back to the point they were at in August.  The recent uptrend has been on rather lethargic volume, in light of the high volume sell-off back in August.  My default benchmark, the SP 500, has apparently encountered overhead resistance (again) in the 2100 area, it seems that every time it penetrates thru that level, imaginary hands reach out and pull it back down.

Lets take a look at some charts:

SP500-11-05-15SP500-11-05-15-comments

The SP 500’s recent highs have been 2114 on July 31, and 2116 on November 3.  Prior to that, it had activity at or near the 2130 area, since May.    I know I spoke of prior (and different) overhead support levels in prior posts, but the market is not a static, stationary animal, so as its behavior changes, it is useful to apply different benchmarks, albeit not grossly different.  With that said, I am eager to see the index penetrate the 2120 level before I move any of my funds back to stocks.

Numerous things continue to challenge the markets, some of which are:

  • Growing frustration with no interest rate hikes from the “just get it over with” crowd on Wall Street.   Rates indeed may rise in December.   This is the #1 challenge right now.
  • Difficult to verify economic reports from China, a Communist country, reflecting a slowing Chinese economy.  Some believe that if the data could be fully vetted, the data would be much worse.
  • A slowing world economy, downplayed by European cheerleaders who seek investment in their own (slowing) economies.
  • Select, specific, sectors/industries that are booming, causing markets to go up, not necessarily reflective of the bigger picture.  Severe Dow Jones index swings are triggered by this.

So while some may point out that I “missed” some gains from last month until present, a period of 45 days,  these same folks are the ones who advocate “in it for the long haul”, “look at long-term time horizons”, etc mantra.   So what is it, long-term or not long-term ?   Get tripped up over my investment during the last 45 days but claim that they themselves are long-term investors ?  In my line of work, those are called contradictory statements.

Observe it is hard to quantify the safety the G-Fund gives us, akin to the seat-belt when a traffic accident is looming ahead or opening the umbrella as you walk to the car, with thunder heard outside.  How do we put a number, how do we measure, the usefulness of the seat-belt, if indeed you never wrecked your car, how to we obtain a value, of the umbrella, if it didn’t rain after all ?  This indeed is difficult, as we are trying to measure protection for things that never needed protecting (in the end).  This is all outside of the scope of this website, however we all pay insurance on our homes, every year.   Did you stop paying this year because you “just never had a fire yet” ?   Of course not.

With that said, I am 100% G-Fund, in my TSP account. 

Observe that I am eligible to retire in less than 5 years, so I may indeed be too conservative for some readers.  If anybody wants to be out of G-Fund, it is me.  If anybody could use some gains in their account, it is me.   But if you have watched the market long enough, you learn to trust your gut instincts.  If you have 40 more years of government service, G-Fund may not be the place right now.  But, me – still 100% G-Fund.  I will continue to monitor things and post updates here accordingly.   Thank you for being a reader and please continue to pass the word to friends and coworkers, as you obviously have already been doing.

If I stay in G-Fund any longer, I may soon change my website name from The Fed Trader to The Scared Trader…(Fed Chicken was recommended by a coworker, I may go with that…)

Thank You again

– Bill Pritchard


Continued frustration as markets rally then Decline

Hello Folks

I apologize for this later than typical post, I typically try to post every 14 days or so, and we are past that point.  If my subscriber emails are any indication, many are frustrated by the markets, and justifiably so.   Lets try to make some sense out of the recent market action.   Note that I remain 100% G-Fund.

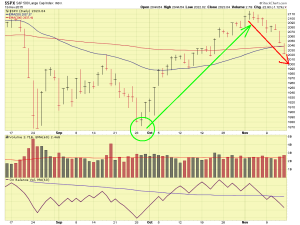
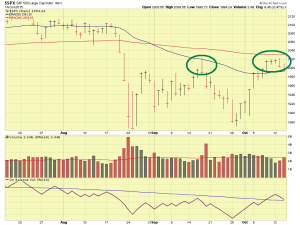
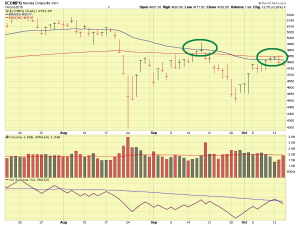
I will use the SP 500 and NASDAQ indexes for most of my discussion.  Lets go back to September 29, where the SP 500 index appeared to have “found a bottom” at the 1880 area, and rallied higher, on above average volume.   This is clearly a desired behavior.   Then, over the next few days, the markets continued higher, with October 2 action witnessing a solid upward “punch” on above average volume.  That behavior is exactly what we need, and my finger moved very close to the “Leave the G-Fund” trigger guard.  Due to the fact that we are indeed in a mature, 6-year uptrend, and arguably “due” for a bear market correction, and other factors, I am not ready to be quick on the trigger, and instead want to continue to assess things.  So I was disappointed that the market action in the subsequent days was not as healthy, and thankful that I elected to opt for a safer approach, remaining in G-Fund.  Volumes immediately dried up (got lower) and the indexes seemed to lose their energy, with the SP 500 hitting resistance at the 2020 area.   The SP 500 is below its 200-day Moving Average, where it has been since August, the 200-day Moving Average being a key trend line watched by many professional money managers (above it is good, below it is bad).  The NASDAQ index is below both the 50-day and the 200-day Moving Average.

Before we proceed further, lets look at some charts:

SP500-10-14-2015-commentsNASDAQ-10-14-2015-comments

Furthermore, in addition to the lackluster action since October-2, (designated by the reputable newsletter Investors Business Daily as a “follow-thru day”), we started to see some signs of selling or distribution.  After an apparent rally, the worst thing to see is selling immediately thereafter.  This can indicate many things, namely and perhaps primarily, that investors who had some losses back in August, have waited until the markets rallied and then they decided to get out, thus recovering some damage done a few weeks previously.   We have not seen subsequent high volume, “up days” since Oct-2, which are needed to solidify and validate the recent rally attempt  (now-subsided).   We have had three Distribution days since Oct-2.  It should be noted that five distribution days within 20 trading days (until Nov-3 for our scenario) is typically enough to kill any rally attempt and re-send the market into a downward vector.   So again, we have had three, if we have five prior to Nov-3, that is clearly a negative signal.

The above is the “chart action” which is 99% of what I use for my investing and trading decisions, as the “market knows all” and trying to crystal-ball things is often a fruitless endeavor.   Some may ask what is causing all of this ?   I am entering speculation, aka take-a-guess mode (which is what the talk show hosts on CNBC and Bloomberg do themselves, and nothing more), but will propose that the following are causal factors:

  • China’s Slowing Economy
  • Indecision or Perception of indecision by the FOMC to raise rates
  • Recent corporate Quarterly earnings reports reflecting slowing economy, aka Wal-Mart, NetFlix
  • Poor retail sales data, possibly reflecting reduced spending by the consumer

With that said, at the end of the day, all that matters is price, and volume.  As much as I dislike it, the information conveyed by those indicators have required that I remain 100% G-Fund.  I would be cautious of any reports that the economy is healthy and running on all cylinders.  Also, the stock markets are a leading, not lagging indicator, and stock markets will decline well before a recession is declared.   Be careful when you hear claims otherwise.   Go to other sources and listen to other trusted financial experts, all whom believe, like I do, that the stock market is indeed a leading indicator, such as Charles SchwabNew York NYU Stern Business School, Chicago Booth School of Business and the American Institute for Economic Research

Lets keep an eye on the distribution day count up until Nov-3, and also the general price and volume action in the indexes.

Thank you for the great emails and for being a reader.   If you have any friends or colleagues that may benefit from this site, please spread the word.   Thank you again everyone and talk to you soon.

– Bill Pritchard

Markets lower amid reports of slowing Chinese Economy

Hello Everyone

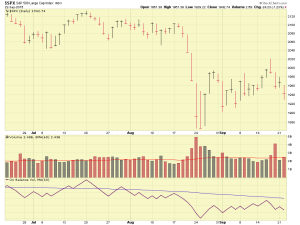
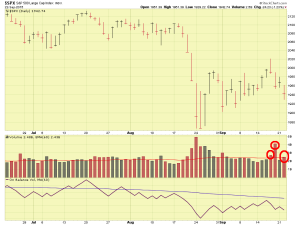
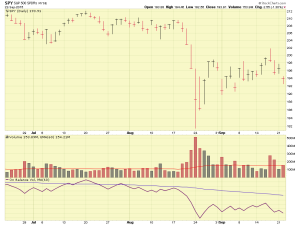
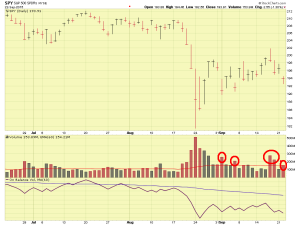
Markets closed significantly lower on Sept-22, largely due to additional reports that the economy in China is slowing down.  Lets take a look at some charts, the SP 500 Index itself and the “SPY” Exchange Traded Fund (ETF) which is a proxy for the SP 500 and often useful for volume analysis.

SP500-09-22-15 SP500-09-22-15-commentsSPY-ETF-09-22-15 SPY-ETF-09-22-15-comments

Evident via the charts is that the markets have closed down on above average trading volume days, and have had minimal “up days” on above average volume.   They indeed had those types of days on August 26, 27, and 28, but volume waned quickly and dropped off.  We are now approximately one-month since the late August sell-offs, and from my optic, the markets do not appear to be improving, and additional selling/distribution activity being observed is not conducive to an improvement of things.  My opinion is additional downward action is possible, over the next 30-90 days, as large participants such as large mutual funds and hedge funds slowly exit positions.

I remain 100% G-Fund.   Take care, I will plan on another update possibly in one to two weeks.   Thank you for reading.

– Bill Pritchard


Pre-Market futures down hard

I typically don’t post morning updates however Pre-Market futures are down hard, with Dow Futures down 200+ points this Sept-22 AM.

The market day may be challenging indeed.

-Bill Pritchard


FOMC does not raise rates

Hello Everyone

In the “I told you so” category, the FOMC declined to raise interest rates at its most recent meeting (Sept 17), stating that inflation data is still not at the target 2% level.

A PDF file with the actual press release, and key areas highlighted by me, is at this link:  FOMC-SEPT-17

Markets did not celebrate the lack of a rate hike, and closed lower at the end of the day.

I have no compelling reason to depart the safety of the G-Fund, and as such, I remain 100% G-Fund for now.

Everyone have a great weekend…

-Bill Pritchard

Market Analysis and FOMC meeting

Hello Folks

Hope everyone has been doing well.   Subscriber-ship has really taken off since the “crash” back in late August, thank you for the interest in the site.

Let me get started by saying that I remain 100% G-Fund.   This is due to my ongoing concern regarding weakness in the markets.   As many have pointed out to me, the markets indeed have tracked upward, however, this vector upward has (in my opinion) lacked sufficient volume to sustain anything.  An interesting note is that I submitted my TSP change to G-Fund on August 23, however due to the typically delay time in processing my request, and the subsequent up-tick in the markets after August 24, I did not exit “at the bottom” as one would believe.   I exited on an uptick.   The markets since have been mostly flat however.   Lets take a look at the SP 500:
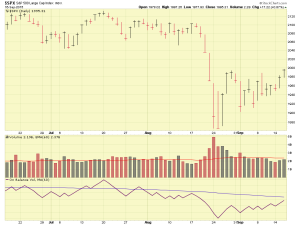
SP-500-09-15-2015 SP-500-09-15-2015-comments

A few things become apparent after viewing these charts.  1) The overhead resistance level for the SP 500 is 2000, if we can get thru that, then I consider that a positive sign.  2)  Volume since August 24 has dropped off.   We have had no significant volume, on “up days”, at all.

Yes, we have had some days in which the volume was slightly higher than the prior day, resulting in some folks to celebrate, to include Investors Business Daily newspaper.   This publication 99.9% of the time is a solid and credible source of info, however via Twitter, I disagreed with a prior opinion piece they posted regarding a celebratory article on volume (they never replied back…).   In my opinion, the volume on the indexes is not high enough to warrant a jump back into the stock funds.

Combine the behavior of the markets themselves (the best signal of them all) along with the historical fact that the bull market (we are arguably in a correction now, but not full “bear mode”) is six years old, in addition to the above volume, my subsequent decision is to remain in the G-Fund.   I want the market to “prove to me” why I should return to stock funds, so far, it has not.

As many know, the FOMC is meeting on Sept 16/17, with a press conference planned for 2PM Eastern Time on Sept 17.   My opinion is that we do not see a rise in interest rates at this meeting.  I have been wrong before, and I will be wrong again, but my position is based on the fact that in numerous public statements, to include some before Congress, the FOMC is using two factors to decide interest rate hikes:   Unemployment/Labor Data and PCE Inflation Data.  For in-depth discussion of this, please see my March 12, 2015 post.

While the most recent data reflects that the labor market indeed is at the levels desired by the FOMC (in order to raise interest rates), the PCE Inflation Data is not.  12-month PCE Inflation as reported by the Dallas Federal Reserve is largely unchanged since January 2015.   Some believe that continuing to hold rates down is hurting things, and some pressure on the FOMC exists to just “get it over with” and go ahead and make the rate hike, which is a paltry .25%.   Many also believe that the tension and stress around the possible rate hike is more painful than the hike itself.   In any event, my opinion is that we do not see rates increased on Sept 17.

In the “Other” category, some things not TSP related but indeed related to your financial situation:  Something most folks I know (or at least the ones I hang out with…) are not aware of:   The Blue Cross Blue Shield Wellness Benefits Gym Membership benefits.   The link is at:  https://www.blue365deals.com/healthways-national-standing-25-monthly-fee-access-network-9000-gyms-nationwide

Take a look at the link, as I don’t want to misquote things, but long story short, it is $25 monthly gym membership per adult family member (if you have a family, your spouse needs to pay $25 in addition to the $25 employee membership, $50 total, and no child membership or plan exists….unless I read it wrong…), for access to numerous gyms across your city.   For example in Dallas, my membership gives me access to all LA Fitness and all Anytime Fitness (two different companies) facilities.

Another item of importance is the FEGLI Federal Life Insurance open season, from Sept 1 2016 until Sept 30 2016.   The most recent open seasons were 2004 and 1999, so you might take a look at this.  FEGLI is more expensive than other programs, but FEGLI is one of a few life insurance programs that will pay no matter how, or where, you die.   Sad as it sounds, it will pay in a suicide and pay if the death is in a war zone.   Not many (none that I have found to be exact…) life insurance programs will do this.   In the read the fine print category, if you have a non-FEGLI life insurance program, and you fly around on government aircraft, and/or get deployed to war zones or similar, you might want to check your policy.  When do you need life insurance ?   I am not a financial advisor, however big media types such as Suze Orman and Dave Ramsey seem to advocate to have life insurance until your oldest child is 25 years old, the theory being by that time, they are out of college and/or somewhat can live on their own.   Do your own research, as I am not a financial advisor or insurance person.

That is all I have for now….I remain 100% G-Fund.

Thanks for reading and please continue to share this site with your friends and co-workers.

– Bill Pritchard


China slowdown – Dow Futures down 200+ pts

Hello Folks

Well, last week we saw the markets rise, however volume on each “up day” was less than the prior day’s volume, classic signs of a rally with no steam.   Most rallies with any chance of lasting have strong volume behind them, and such volume tends to rise or be greater than the prior “up day”.   We are not seeing that right now.  Also, due to the price action on the SP 500 Index, we have a pending 50-day Moving Average and 200-day Moving Average crossover, which for some is considered an additional bearish signal.  For me, I have enough “go to the sidelines” signals, and I am in G-Fund.

Let’s look at some charts:

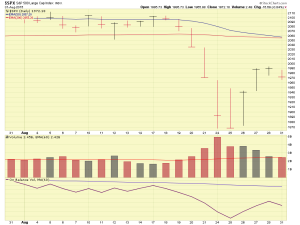
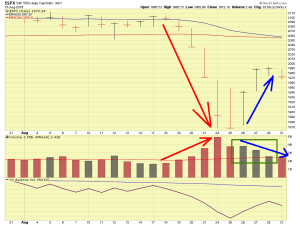
SP-500-08-31-15SP-500-08-31-15-comments

If we take a look at the above chart, the red arrow reflects the downward action of the Index, it is accompanied by rising volume, “backing up” the potential that the just-occurred movement (downward action) is strong (versus weak) and likely to endure (versus not endure).   The SP 500 Index finds a bottom in the 1870 area then on August 26, rallies higher.   For those who do not understand the importance of volume, many believed that “the storm clouds are behind us” and many talking heads on CNBC proclaimed that the market was back on track, having just “hiccupped” days earlier.   Others, like me, who study volume, were concerned with the high volume on the prior down days, and started to observe that the volume each “up day” was lesser than the prior “up day”.   Notice that while yes, the market did go up, on Aug-26, 27, 28, the volume went down.  Poor volume “reduces the credibility” of any potential reversal, with reduced probability that the perceived rally will endure.

Over the weekend, I also concluded that the only thing causing rallies, weak ones or not, was super positive headline news, and not the result of normal inflows into investments.   Absent super headline news, (such as reports that the Chinese government themselves were now buying zillion dollars of Chinese stocks) the markets fall apart a few days later.   A general “cloud” of worry seems to cover the landscape, and volatility is at record levels.   Note that in my opinion, the FOMC is not going to consider the stock market’s performance or what is happening in China, as part of their rate increase decision process.  It is also my opinion that we do not see a rate hike in September, but not because of China or the markets.  Furthermore, my opinion is that the previous well-intended plain vanilla FOMC statements are leaving the markets jittery, as they seek more clarity and try to determine the direction the FOMC is headed.

Poor and flawed information pushed out in the financial press, to include reports that “this is a standard correction”, are not helping investors.   I don’t recall 1000 point losses in one day (in mere minutes), nor mid-day White House Press Secretary live appearances to soothe investors, in “standard corrections”.

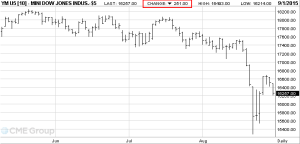
During the evening of Monday Aug-31, BBC Business released a report that China’s economy is indeed slowing down.  Nighttime Dow Jones Futures are trading 250 points down.   This is not the mark of a positive regular market day for Tuesday Sept 1, the day following a triple digit (115 points) loss on Monday.   The week is not exactly getting started well.  See chart:

DOW-FUTURES-09-02-15-comments

In summary, my balance remains 100% G-Fund.   I lost a little on the way thru the exit door, but my account is protected from additional damage.

Let’s keep an eye on things this week.   Until then, take care and talk to you soon.

– Bill Pritchard


100% G-Fund – Market approaching Bear conditions

Good Evening Folks

As an update, I am now 100% G-Fund in my TSP, both my Contribution Allocations and Interfund Transfer now reflect 100% G-Fund.  I submitted this request on Sunday August-23 late PM.  When you are having trouble sleeping, the simple adage is “reduce your exposure until you can sleep again.”   In short, that is what happened, almost literally.

The SP 500 has penetrated the 2040 “support area” which was discussed in my July 8 post , this happened Thursday, late in the afternoon, then again on Friday, we saw additional damage caused.  It is unfortunate that our markets are almost controlled, to an extent, by what is happening overseas, versus the other way around.

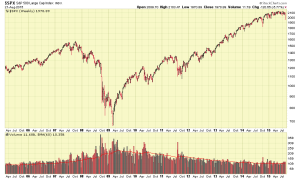
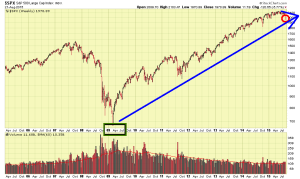
Long-term, 3+ year look-back, we are still positive, lets take a look at the SP 500 chart.   Observe that this bull market (well, former bull market) got started in early 2009, so we are 6+ years into this, and the vitality and momentum of this mature market has indeed apparently ceased.   See weekly chart, which reduces the noise associated with daily price action:

SP500-weeklySP500-weekly-comments

So since 2009, we have enjoyed a mostly upward trend, with some turbulence along the way, but in light of the recent market behavior, I see “cracks appearing” and feel that a move to G-Fund is prudent.   I may lose some additional money as I exit, as the TSP processes my allocation request over two business days, however it takes months, not mere days, for a bear market to fully materialize.   Exiting this week, is much preferred over exiting three months from now, assuming this correction continues.

So what is a Bear Market?   Note that we are not in a bear market yet.  Most professional money managers define a bear market as 15% decline in an index from a recent all time high.   Note also that the Dow Jones only contains 30 companies, two of which are Oil companies (Oil is at $40 a barrel), two of which are PC-computer related- Intel and Microsoft, (does anybody go out and purposely buy a new PC these days), and some other companies that just are not keeping up with modern times.  So yes, the Dow is getting creamed.   But so are the other indexes.    So, to obtain bear status, our indexes need to reach (decimals not used):

Dow Jones:  15751

SP 500: 1815

NASDAQ:  4447

With the global turmoil underway, the vague statements by our FOMC, resulting in additional nervousness in the markets, the 2040 being penetrated twice on back to back days, and my overall lack of sleep due to the markets, I pulled the trigger and went G-Fund.

I hope everyone has a good week, and thank you for reading.

– Bill Pritchard