Category Archives: Uncategorized

100% S-Fund Continues – PCS Transfer Ongoing

Hello Everyone !

I apologize for reduced activity, I am in the middle of a PCS transfer, from overseas/foreign location to domestic USA, so I am juggling numerous things and have been off the grid to some extent.

I remain 100% S-Fund.  While I-Fund indeed flashed some signs of life in April and early May, it then deteriorated and went south (performance wise), compared to the other funds.   The S-Fund was top performer for May returns.   The I-Fund was a negative performer and indeed carries additional risks for those who are in the I-Fund.  So again, I am maintaining course and remain 100% S-Fund.

On Friday June 5, the Labor Department released its most recent “jobs report”, which reflected an unemployment rate of 5.5%, which is a slight worsening of the prior rate, of 5.4%.   Whether the FOMC will raise rates or not in 2015, is still a hot debate, however I just don’t see it happening until sometime 2016.  My opinion.

For in-depth discussion regarding my opinion on rate hikes, go to my March 12 Post at this link:  http://www.thefedtrader.com/march-12-update-interest-ratespart-2/

Remember we are looking at BOTH Jobs/Employment data AND the PCE Inflation data.  If the FOMC’s publicly advertised parameters (to include congressional testimony) are to be adhered to, then BOTH of the above need to be fulfilled prior to rate hikes.

That is all I have now…tomorrow Sunday my day will be filled with more real estate and home shopping activity, I will be off the grid for another week or two, but WILL be monitoring things market-wise.   ANY changes to my TSP will be posted here.

Thanks for being a subscriber and please continue to share this site with your friends and colleagues.

– Bill Pritchard


Markets rally higher on May 14

Hello Everybody

Continuing my current 100% S-Fund TSP Allocation, I am happy to report that for the first time ever, the SP-500 Index has finally closed above 2120, versus just break thru it, and settle lower, which it did on May 4.   A “close price” is the final price that market participants have “settled on” by the time the markets closed for business, which is important for determination of sentiment.    Lets take a look at two charts, showing “close only prices” reflected by dots.   This is a less common method of displaying market activity, but still very useful.   Observe my previously and often discussed levels at 2040/2080/2120.

SP-500-05.14.15-CLOSE-ONLYSP-500-05.14.15-CLOSE-ONLY-comments

The markets appear to be embracing the fact that the economy, while doing well, is not doing so well as to warrant interest rate hikes soon.  Remember the public declarations made in front of Congress and in published policy statements by the FOMC, focused on both PCE Inflation data and Unemployment/Jobs data.  Also remember Presidential elections are coming sooner and not later.  I doubt any major deviations from these public statements will be occurring any time soon.   Maybe, not impossible, but my opinion is we probably won’t see any rate hikes soon.

In my May 7 post, I opined on the pending May 8 jobs report:  My opinion, the desired numbers are 225,000 to 250,000 jobs added and unemployment rate of 5.5 to 5.7%.    The market should react very positively to those numbers.

The May 8 report was then released and reflected 223,000 jobs added, and an unemployment rate of 5.4%, very close to my personal estimates published prior to the report.   As previously stated, the market has indeed embraced this data, resulting (finally) in a closure above 2120.   NOTE:  May and June historically are frustrating months, the kind where you pull your hair out, due to erratic price action.   Knowing that indeed, this is “typical” behavior, I typically remain fully invested (versus “Sell in May” strategy).   Unless of course additional red flags or storm clouds are observed.   But a “rainy month” does not mean necessarily that a Hurricane is about to hit us, if one has historical patterns and data on hand.   Some additional trivia is Aug/Sept/Oct are the markets worst performing months, historically.   

On May 12, Greece adhered to their repayment schedule and made a payment to the IMF.   While it is still questionable whether they will be able to make additional repayments, this May 12 payment was at least reassuring.  In addition, Asian stocks have rallied, resulting in the first weekly advance in three weeks.   This will likely benefit the I-Fund, which has exposure to Asian markets.

I may make a TSP Allocation change later this month to reflect 100% I-Fund or 50% I-Fund and 50% C-Fund.   I will post any such change on this site.  

At the present time, I remain 100% S-Fund.  Thank you for reading and please continue to share this site with your friends and colleagues.    Again, May (and June) are frustrating months, lets “hang in there” barring red flags or abnormal and negative market action.

Talk to you soon….

– Bill Pritchard

May 7 PM update / Sideways action Continues

Hello everybody !

My current TSP Allocation of 100% S-Fund may change later this month of May, probably the third or fourth week of the month.    

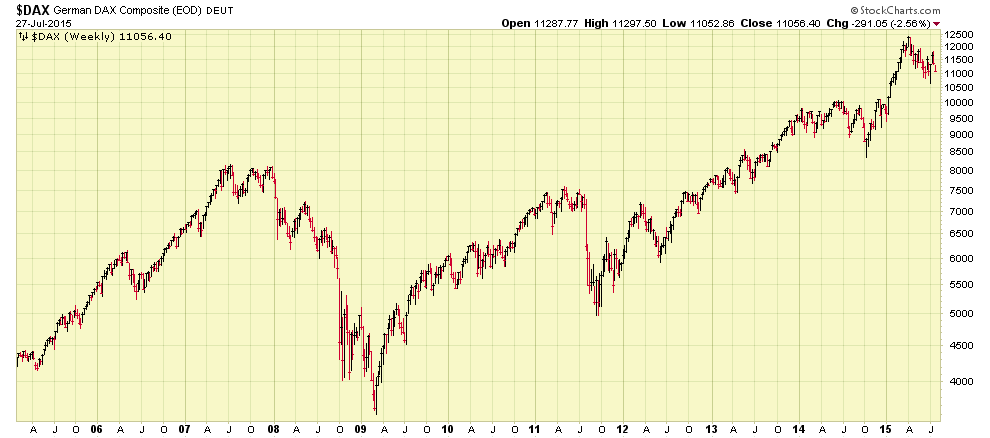
It should be noted that the large cap stocks (represented by the C-Fund) are starting to outperform rather consistently the small and mid-cap stocks, on a domestic (non-international) basis.   When this occurs, it is important to look at other technical and fundamental indicators to get a “big picture” outlook on the markets.  Long story short, at the end of a bull market cycle, in almost all cases, the large caps are the “last to die”, and in many professional money management circles, this therefore is an important indicator of weakening bull market.   Why does this happen ?   One reason is large cap stocks are the inhabitants of thousands of mutual funds, pension plans, and hedge funds, these funds have literally billions of dollars invested.   These large funds, akin to cruise ships in the ocean, cannot “turn on a dime” and dump shares immediately.

Exiting holdings by these major players will occur over many month’s time, not one day or one week.   Some other reasons exist as to why this indicator is accurate, but I will save you the boredom, suffice to say that we need to keep an eye on this six-year old bull market, as it may be running out of steam soon.

Some other topics, are Greece and the Friday May 8 Jobs Report.

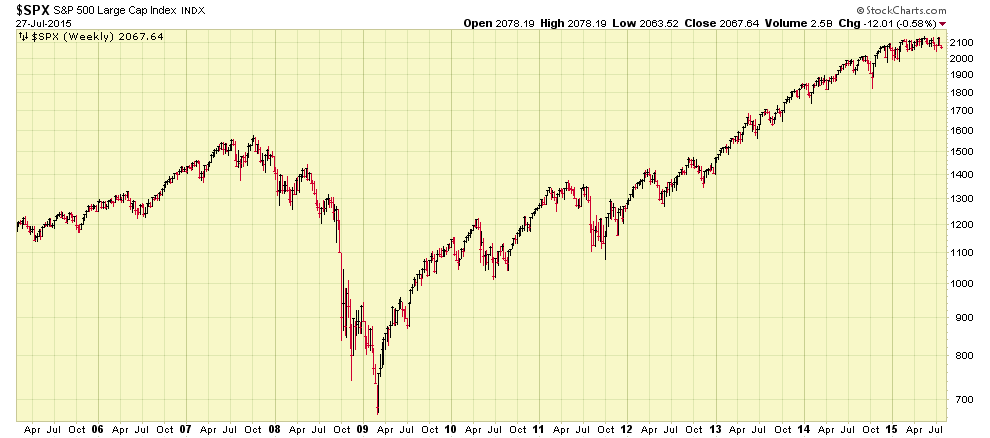
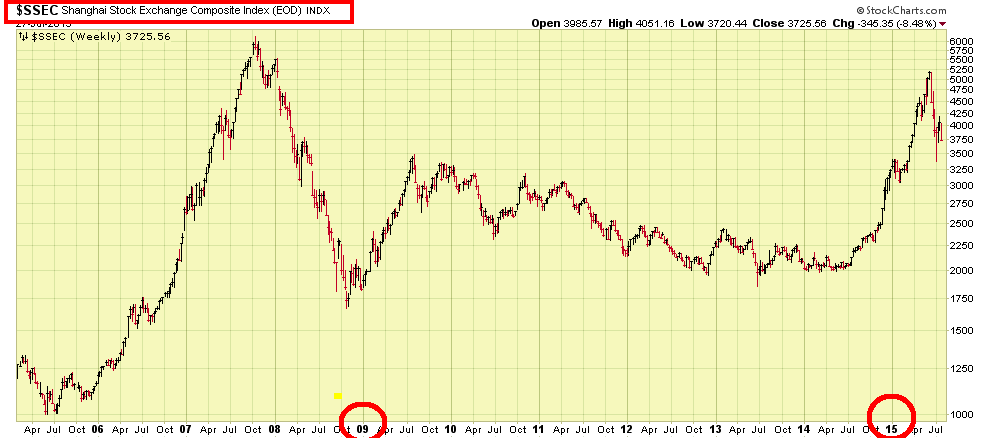
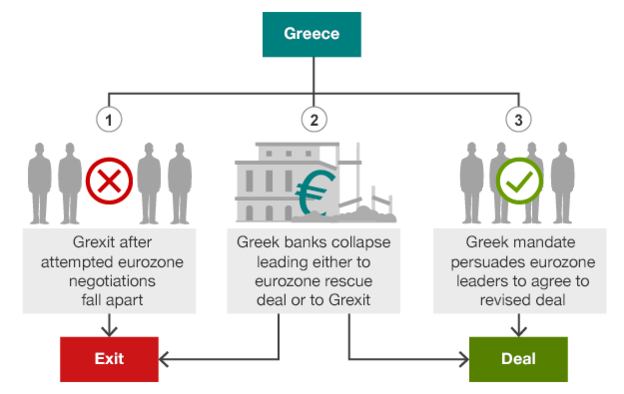
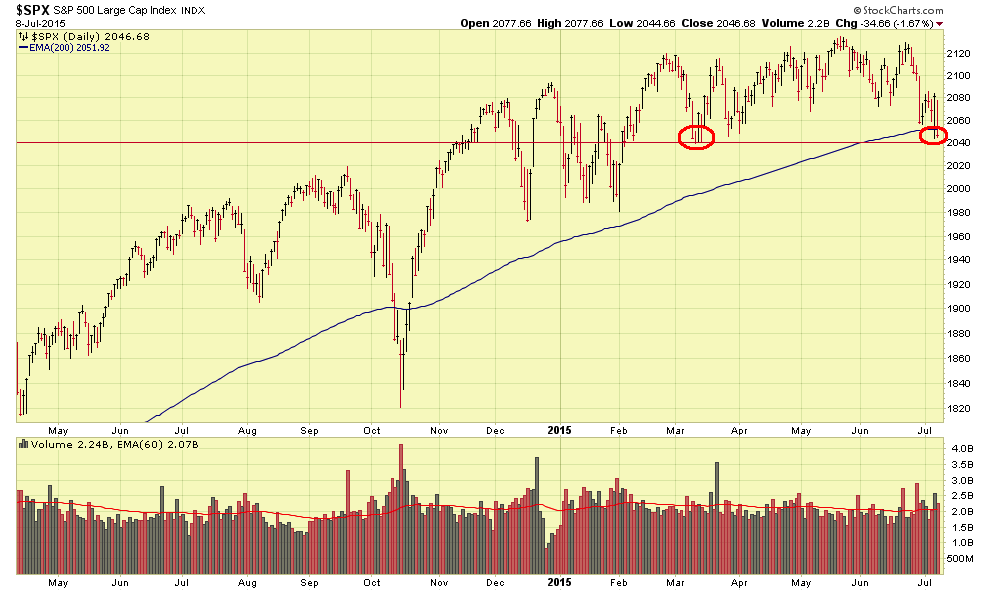
I won’t spend much time on Greece, as it is the same song: they owe money, they won’t pay under previously agreed to parameters, and they want to change the rules.   This has turned into a political mud wrestling match, with Greece, Germany, and the IMF all in the ring.    On May 12, Greece is required to make a payment to the IMF.  This is not contested and is without doubt, a payment is due on May 12.  Missing this payment, is considered in most circles, to put Greece into “default” status.   What will happen ?   As a trained investigator, I prefer to go to hard evidence, and historical patterns, versus just try to guess or crystal-ball things.    I went back to all the major, headline-issue, international financial crisis situations, all of which the US either paid money to help bail them out, or had our necks exposed due to US investment and business interests in those regions.   From the Mexico Peso devaluation, to Argentina, I analyzed SP 500 index “behavior” (remember, behind the markets are people) during the times of the above events.  Our crashes of 2000-2003 and 2007-2009 had no international triggers.  See chart:

SP-500-CRISIS

So, how much damage did these prior international fiscal crisis/scandals/events do to our markets ?  Very little.

With that said, the Greece issue is a hot topic.  Some argue that the interconnectivity, post-internet, of world markets, makes this situation “different.”   Others say nothing will happen.   Me?  I don’t know.   To be honest I am not so sure a default in Greece really “matters”, but the markets are going to do what they are going to do.    The I-Fund is starting to do very well, and the impact of a default in Greece, which will clearly hurt Europe,  on the I-Fund, is not known.   Contrary to what some erroneously believe, even if you are not in the driver’s seat in a car crash, you can still be hurt.  Heck, you don’t even need to be in the car.   Secondary crashes, flying debris, can hurt you also.  So, no, the I-Fund has no Greece holdings, but ripple effects and chain reaction events in the close proximity can still reach out and touch us.   The I-Fund could be impacted by deteriorating markets in France and Germany, both of which have large exposure to the Greek debt situation. 

Regarding the jobs report, due to be released at 8:30 AM Eastern Time on Friday May 8, we are looking at jobs being added, and at the unemployment rate percentage.   If we see 300,000 jobs added, that is very good news and reflects a very healthy economy.   If the percentage data for unemployment is 5.4% or less, that also is good.   However, good news increases the probability of an interest rate hike this calendar year.   Nobody wants bad news either, as employment is indeed a large engine of the economy, therefore 250,000 jobs added is being considered the “ideal amount” to reflect a healthy economy, while not prompting a rate hike.   The “preferred” unemployment rate is 5.5%, as this indeed reflects a good economy, but will likely not spur interest rate hikes by the FOMC.   My opinion is that getting 300,000 jobs added will be almost impossible, in light of the massive layoffs in the oil sector.    The oil sector, will be the hot topic regarding the jobs report.  My opinion, the desired numbers are 225,000 to 250,000 jobs added and unemployment rate of 5.5 to 5.7%.    The market should react very positively to those numbers.  325,000 jobs added and unemployment rate of 4.5% (the chance that the numbers on Friday are close to those is nil) will result in an almost guaranteed rate hike this calendar year, along with a market downturn. 

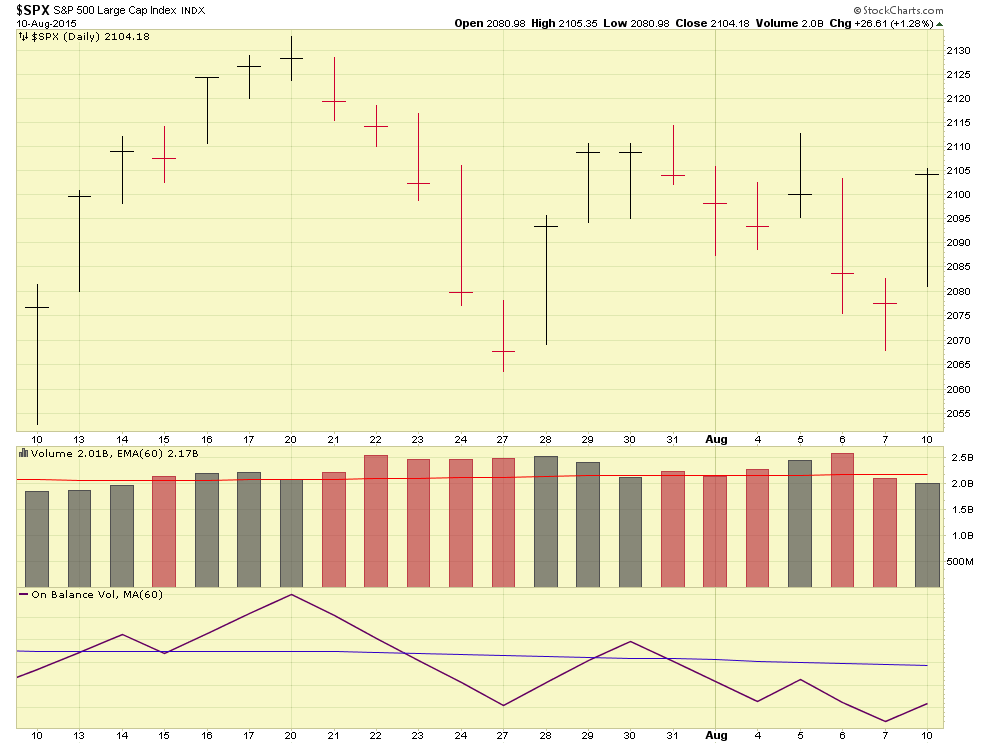
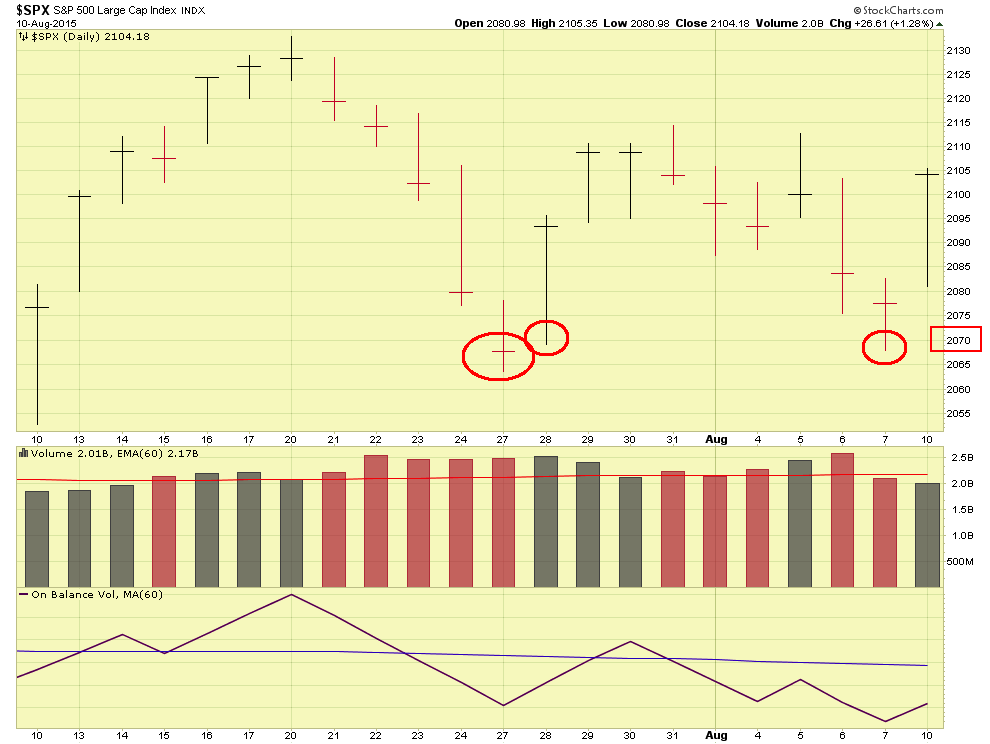
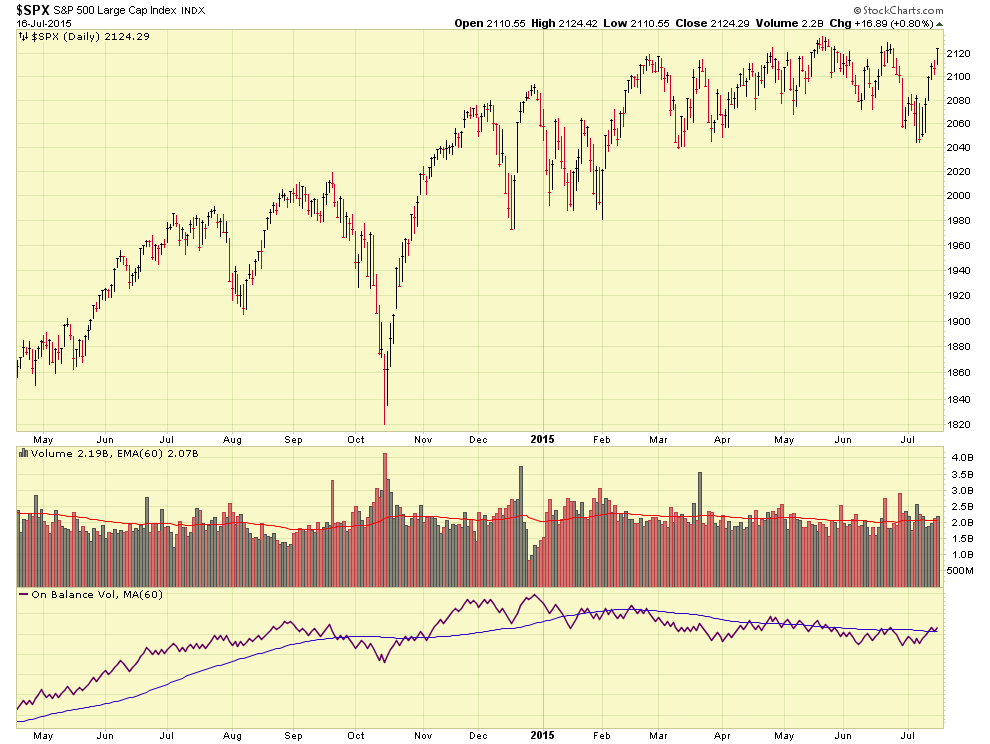
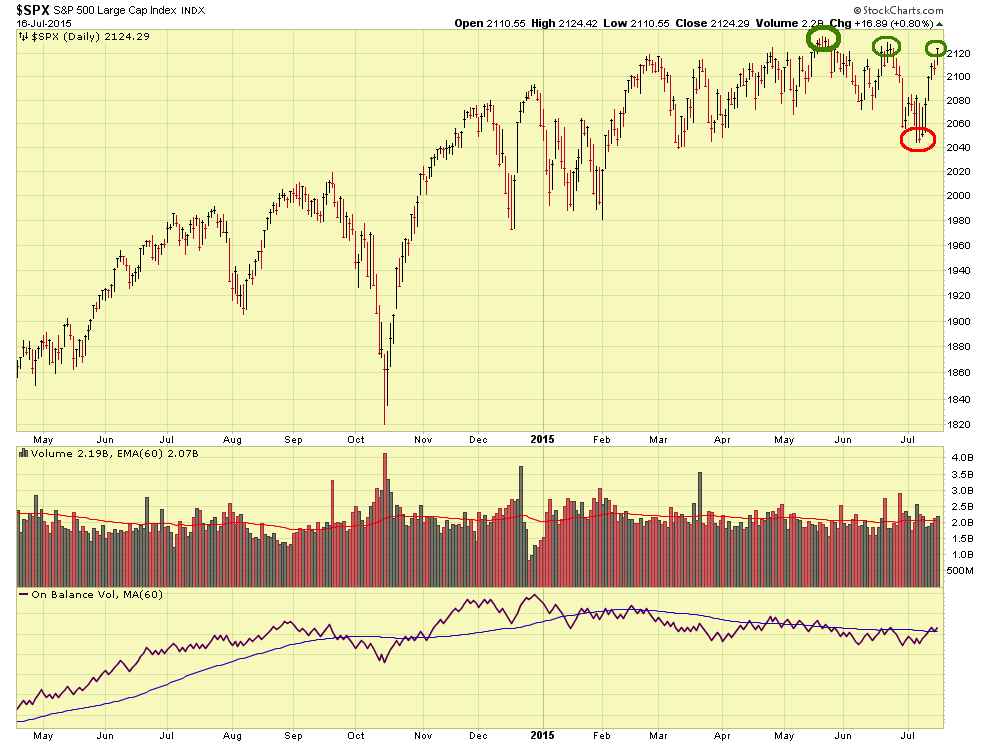
With that discussion behind us, how are the markets doing ?   The SP 500 showed some strength as April finished, breaking the 2120 overhead resistance level on April 23, 24, 27, and on May 4.   Since then, it resumed downward.   See charts:

SP500-05.07.15  SP500-05.07.15.-comments

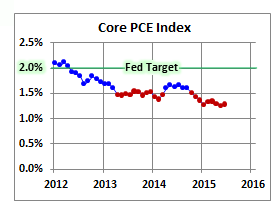
April TSP data has come in, and as expected and discussed on this site numerous times, resulting in yet another accurate Fed Trader prediction, the I-Fund outperformed in April.  The S-Fund, was negative, but we are looking at longer term, behavioral, trends, in order to determine appropriate fund allocations, and not single month numbers.  The I-Fund is overall YTD performer but some risk comes with those gains.  See graphic:

TSP-FUND-RETURNS

With that said, I may be moving 50% C-Fund and 50% I-Fund in late May or possibly 100% C-Fund.  At the present time, I remain 100% S-Fund.

Thank you for reading and please continue to share this site with your friends and colleagues.   I continue to be surprised by the huge numbers of new subscribers each month, and enjoy the emails that I get from the readership.   Thank You ! 

– Bill Pritchard

100% S-Fund / Sideways Action Continues

Hello everybody

I received some emails regarding a “Status Check”, I am alive and well, thank you, however the only thing to really report is “more of the same” as the markets remain in a sideways range, bound by (SP 500) 2120 overhead resistance and 2040 support, with 2080 the “mid-point” between the levels.   See charts:

SP-500-04-22-2015-NO-COMMENTSSP-500-04-22-2015

I am happy to state that the index has traded at or above 2080 since late March, reflecting an improvement in the health of the trend.  With a little luck, we get penetration of 2120 and thus a likely new uptrend.   I remain 100% S-Fund and see no underlying economic problems or market signals causing me to leave S-Fund.  From a pure performance perspective, I-Fund appears to be taking the lead, however, if and when the US stocks breakout, their performance could start to outperform I-Fund.   So I am hesitant to use a TSP move (two a month limit) only to have to change course soon thereafter.   In is my opinion that the S-Fund offers the ideal risk/reward tradeoff right now.  However we may likely see I-Fund to be the best performer in April once the data is calculated.

I will touch on some “background news” affecting things and report that China Central Bank will be easing its policies and relaxing credit requirements, due to a cooling economy in China.  This action, announced Sunday April 19, is not hugely different from our own Quantitative Easing which began in late 2008.   It could be argued that our QE program was largely responsible for the current Bull Market, and using that logic, a similar program in China may lift the Asian markets in a similar manner.  Lets take a look at the SP 500 chart and observe the trend reversal in early 2009:

SP-500-LONG-TERMSP-500-LONG-TERM-COMMENTS

Academic theory and complicated economic explanations aside (and plenty are out there…) about whether QE “should” exist or not (we are printing money, easy money, artificially propping up the economy, etc. are all terms thrown around), if the end result is a market uptrend, I am going to go try to make money off the uptrend while everyone else argues the value of the program.   I will be monitoring the “Chinese QE” (expect mainstream media to embrace this term – but to be clear, their program is similar in spirit, but not mechanism, to our QE) and looking for profit taking opportunities. The I-Fund, which duplicates the MCSI EAFE index, will likely benefit from China QE, due to that index’s exposure to Asian markets.

That’s about all I have for this post, again, I remain 100% S-Fund.   As discussed, I-Fund will likely outperform all funds for the month based on my calculations, however entering I-Fund right now (for me) carries some risk, due to the Greece situation (payment to IMF due in May) and some other things that are going on.   I may move to the I-fund next month.   Standby for that.

Thanks for the great emails…please continue to share this site with your friends and colleagues.   Talk to you soon everybody

– Bill Pritchard

April 8 Update – Sideways action Continues

Hello Folks

As we enter the middle of April’s first full trading week (April 1 and 2 was last week, and April 3 the markets were closed), the sideways action on the SP 500 continues.  On my prior post, I discussed what 2080 represented on the SP 500 index.  In a typical self-fulfilling prophecy, the index has stayed near that level and refused to find any direction (we prefer the upward kind of direction) whatsoever.   Lets look at two charts, one with no graphics, then one with graphics:

SP-500-04-07-15SP-500-04-07-15-commentsAs is evident in the charts, the index continues to trade “sideways” and on low volume.   This is reflective of a market which desires a trigger event, to forcefully kick the ball up or down the hill.  Absent such an event, we may see continued lackluster action in the near term.   April monthly action (so far) indicates that the  S-Fund and I-Fund are neck and neck in terms of fund performance, with I-Fund taking a slight lead as of April 7 2015.  I would not jump in or out of anything right now, I personally desire to see a clear direction in the indexes before attempting to ascertain what fund is the clear-cut winner over the other funds.

Not surprisingly, is that all the panic and doom regarding interest rate hikes has subsided, and now (have we seen this movie before?) people are slightly embracing negative economic news as “good news” since this may result in a delay to the interest rate hikes.  NOTE:   See my Sept-10-2013 post regarding “good news is bad news” for a discussion of this concept.

In summary, I remain 100% S-Fund and await the market to find (hopefully) a new uptrend.  Cautious note is that mid-April thru mid-May is the release of corporate earnings and performance data for the first quarter of 2015, and this will likely push the markets one direction or another.  Until then, sideways action, in and of itself, is not a bad thing, and I see no warning signs or chart signals causing me to exit stock funds.  I remain 100% S-Fund at the present time.

Thanks for reading and please continue to share this site with friends and coworkers.   Talk to you soon everybody…

– Bill Pritchard


S-Fund top March performer

Hello Everybody

An update that the S-Fund has been declared by TSP.gov to be the top performer in March.  In a challenging investing climate, this was the only stock fund with positive returns.   All other stock funds were negative.

https://www.tsp.gov/investmentfunds/monthly/monthlyReturns.shtml

http://www.govexec.com/pay-benefits/2015/04/tsp-has-slow-march/109072/?oref=river

It would look bad to “take credit” for being right, but the fact remains that I was in this fund the entire month, as were many subscribers.

Screen shot is below:

MARCH-RETURN

Regarding the market, trading on April 1 (first day of the second quarter….”first days” are important from a set-the-tone standpoint) was difficult indeed, with the Dow Jones index closing down 77 points.   My benchmark index, the SP 500, hit a low of 2048 then closed at 2059.69; round it to 2060 and that is fine for our purposes.   Remember that the 2040 level is something to keep an eye on.  In addition,writers at marketwatch.com are basically repeating what I have already told my subscribers multiple times regarding the market and various technical levels.

I want to discuss another “tool” in my toolbox, and while this may sound like Greek and be clear as mud, I am going to discuss it anyway.   Based on some reader emails, the subscribers enjoy my charts and methods, and have desired additional material.   So let’s get started…

The overhead resistance level (since the most recent uptrend peaked out late February) is 2120 and the support level is 2040, for the SP 500 Index.   This is a “spread” (for lack of better term) of 80 points (2120-2040=80).

SP500-04-01

So the “mid-point” between these levels (40 up and 40 down) is 2080.   Due to the increased volatility and uneasiness in the markets, we must utilize additional tools to determine behavior, so lets use the 2080 level as the short-term barometer regarding “health” of things.   If the SP 500 has activity above 2080, that is positive, as this means it will hopefully continue towards 2120 and break-thru the 2120 level.   Activity below 2080 is not desired, and as it moves closer to 2040, then it is time to become even more concerned.  See chart with poor graphics:

SP500-04-01-graphics

This method can be used to answer the question “On a short term basis, does anybody have any clue on the short-term trend ?”   Or from an operational perspective, if the SP 500 has 2 weeks of closes at 2095 versus two weeks at 2055, by using the 2080 level, we know that 2095, while not 2120, is not entirely bad and we probably don’t need to completely panic.   Etc scenarios.  The above method can assist with this.

In summary, I remain 100% S-Fund.   SP 500:  2040 is support, 2120 is resistance, and 2080 is our short-term barometer.

Thanks for reading and talk to you soon….

– Bill Pritchard


Fed rate Jitters / Market weakness Apparent


Published March 31 2015, 11PM Pacific Time

Hello Folks

Well the first quarter of 2015 is behind us, and my preliminary data shows that the S-Fund was the top performer for March, followed by the I-Fund, then C-Fund.  This is my own personal assessment, we need to await TSP official results for the “real” info.

The Dow Jones Index is negative for the first quarter, the SP 500 and NASDAQ are slightly positive, but not much.   This has been a turbulent quarter.   I remain in stock funds only because my assessment reflects that the underlying economy and “structure” of things appears solid.   Fed Rate jitters abound, to some extent (or to a large extent) magnified by mainstream financial media.  Richmond Fed President announced a few days ago (thankfully the FOMC is multiple people) that a “strong case” exists to raise rates.   However he appears to not be paying attention to the very data that Ms. Yellen stated was important, namely the PCE Inflation data, which is still lackluster.   I repeat my manta, without BOTH PCE Inflation Data and the Jobs/Labor data (which yes, is where it needs to be), we will not see a rate hike.

I am disappointed to report an increase in “Distribution Days” on the SP 500 Index, this is a concept pioneered by Investors Business Daily (IBD) newspaper reflecting “sell off” days in the index, or outflows of institutional money.   Numerous days can change the direction of an index and send it into a downtrend.   We indeed have had numerous days, and the IBD Accumulation/Distribution rating has fallen from a prior “B” to a current “C” (worsened) as of March 31.

Lets take a look at the recent SP 500 chart:

SP-500-03-31-1015

As seen, it is apparent that the index is “range bound” with 2040 being the support level and 2120 being the overhead resistance level.   So we need to keep an eye on this, and anything below 2040 is a red flag and is undesired.   Also note that (based on my chart settings) we have had below average volume on most days, with two recent above average volume distribution days.

Unfortunately, Equities Index futures are trading drastically lower in the March 31 evening trading.   The Dow Jones futures are 100 points to the negative, which is reflective of a possible challenging day in the regular stock markets when they open for trading on April 1.   Chart:

DOW-FUTURES-03-31

It is my opinion that if we can keep market fed rate jitters to a minimum, keep ISIS and beheader Jihad John off Twitter and cable news, and keep airliners from mysteriously crashing or disappearing into the ocean, the market could do very well.   In addition, we have “Quarterly Earnings” reports coming out in April, and the below companies arguably can represent what is happening with the larger economy, so we need to pay attention to them:

AAL – April 24 earnings release

UPS: April 28

AAPL:  April 27

JPM: April 14

XOM (Exxon): May 4

GM:  May 7

I remain 100% S-Fund at the present time.  However ultimately, we must react to the market itself, so it is important we monitor the action on the indexes and keep an eye on 2040 on the SP 500.   As I stated above, April 1 regular market trading may be a challenging day.   Allow me to be direct:   The market is displaying weakness and a move to G-Fund may be looming ahead.

That is all for now….if you find this site informative please share it with your friends and colleagues.   Thanks for the numerous great emails, I must say I am quite impressed by the subscriber growth so far.

Thanks and talk to you soon…

– Bill Pritchard


Post FOMC meeting / No rate hike and Dow up 227 points

On my prior post, regarding the FOMC meeting, I posted that

Most in the financial press are stating that the language of “patient” will be removed from their statement, but it is my OPINION that while the word may be deleted, the message will not be.

Then at the FOMC press conference, FOMC Chairperson Yellen stated

Let me emphasize, however, that the timing of the initial increase in the target range will depend on the committee’s assessment of incoming information.

Today’s modification of our guidance should not be interpreted to mean that we have decided on the timing of that increase. In other words, just because we removed the word patient from the statement doesn’t mean we’re going to be impatient…..”

RE:  http://www.marketwatch.com/story/highlights-of-the-yellen-press-conference-2015-03-18?dist=afterbell

Well, I don’t know if I could have “called it” any better folks.  Look at her words and look at mine, which I released in my prior post. NOTE:  Check the “other” TSP sites, to include other general investing sites, and you will have difficulty finding such accuracy elsewhere on other sites, regarding market analysis.  As expected and previously discussed on this site, inflation seemed to be an important topic at this recent FOMC meeting.

With that said, the markets (as I anticipated) responded with enthusiasm, with the Dow going up 227 points.   The best performer today were International stocks (I-fund).  The next best performer was the C-Fund/large cap stocks, then small cap stocks/S-Fund.   I will be assessing my current TSP allocation and possibly making a change in one to two weeks.  ALL stock funds benefited from today’s news, FYI.   The SP 500 went up on high volume, and briefly cracked an important psychological level, 2100, then closed very slightly under that level.   See chart:

SP-500-03-18-15-comments

Below is a link to the PDF version of the statement, my comments are in red, and the important portions of the statement are highlighted in yellow.

FOMC-03-18-15

I remain 100% S-Fund with a possible fund allocation change to my account in one to two weeks.   TSP participants who were invested in stock funds prior to today (as I was) realized gains in their accounts and will likely witness additional gains if the market uptrend continues.   Please continue to refer your friends and colleagues to this website, for unmatched market analysis and commentary.

– Bill Pritchard


March 18 Update / FOMC Meeting Concludes today

Good Morning Folks

As most know, the Federal Open Market Committee has been in session March 17 and March 18, and is expected to release their updated monetary policy statement at 2PM Eastern Time on Wednesday March 18.

Most in the financial press are stating that the language of “patient” will be removed from their statement, but it is my OPINION that while the word may be deleted, the message will not be.

As discussed on this site in prior posts, the PCE Inflation data is not where it needs to be (near 2% per FOMC on-the-record-remarks or in my opinion “showing clear and defined progress towards 2%”).   This, of course, assumes that the FOMC considers what it has previously released, statement-wise, to the public, as being important.   See prior post regarding this observation.

In a very quick overview of market action since last week, the markets have stabilized and tracked upward, however we cannot call this a “new uptrend” as the market action is akin to someone sticking their hand into an icy pond to check the water temperature.   I believe some participants are cautiously re-entering stocks, and we see a very slight movement upward.  The 2040 level on the SP 500 is the most recent support level.   See chart:

SP-500-03-17-15-comments

I am sticking my neck out here but my OPINION is we see no rate hike mentioned and thus the previously believed June rate hike will be determined to be unlikely.   I believe we will see increased discussion on inflation data, the rising dollar, and energy prices.    I believe we see some sort of language such as “continue to proceed cautiously” or “while we are encouraged by improving jobs data, the inflation data remains an area of concern” etc.

Again, all my opinion.   I have been wrong before…the FOMC may surprise me.   (Doubt it).

I remain 100% S-Fund.

– Bill Pritchard


March 12 Update / Interest Rates–Part 2

Part-2 of Interest Rates, mostly prompted by some very good email questions yesterday, to include “where are you getting your data”

For official Bureau of Labor Statistics unemployment data, go to this link below,

http://data.bls.gov/cgi-bin/surveymost?bls

then choose Unemployment Rate (Seasonally Adjusted), fourth choice down under Employment category, then choose Retrieve Data.  That will then bring up the below chart, sans red circle:

UNEMPLOYMENT-TABLE

Regarding the Price Consumption Expenditures Index (PCE), which Federal Reserve officials have gone on record as being the primary inflation measure (Google “inflation” and you will get numerous and different results), use this link below.  This is 12-month data- PCEPI Core (yellow line) is data without considering food and energy, PCEPI (red line) is “straight” PCE with nothing removed.   No matter how you look at it, we are not at the FOMC-desired 2% rate yet.

http://www.frbsf.org/economic-research/pce-personal-consumption-expenditure-price-index-pcepi/

PCEPI

You can also go here, but you need to look closer to find the PCE:

http://www.dallasfed.org/research/pce/

PCE-table

You have to love the government, you need to hit five sites to get the data you want.   As to “Why the 2% rate?”, lets go to the FOMC themselves and ask that question:

http://www.federalreserve.gov/faqs/economy_14400.htm

FOMC-2percent

An additional question is “What is inflation”, again, best we go to the FOMC and ask that, since they are the ones calling the shots (many definitions exist via Google).

http://www.federalreserve.gov/faqs/economy_14419.htm

inflation-def

Note the frequent referral to PCE index, this is the primary benchmark the FOMC is using.

Observations, as discussed yesterday are:  1) Yes, unemployment is improving if we use the data provided,  below the 6.5% level which is the oft-mentioned level the FOMC is looking at, prior to interest rate hikes.   2) No, PCE inflation data does NOT reflect 2%.   Remember the FOMC wants 2%, t-w-o, not 1.5, not 2.5, but 2%.   We are simply not there yet.   PCE Core, which is not counting energy, is almost (but not) there, and PCE is clearly not there.   If PCE was 1.8, 1.7, 2.0, 1.9, over multiple reporting periods, OK, I may accept that.   But PCE is nowhere near even those levels.   PCE is in fact deteriorating, each reporting period.   It is not stable, nor improving.

In my opinion, we now may not see interest rate hikes in Summer/Fall, which is presently believed.   Not if the FOMC wants to abide by statements and language they release to the public.  As many federal government employees understand, releasing an agency policy statement then not abiding by it is a pretty big deal. 

I remain 100% S-Fund.  FOMC Meeting is March 17-18, we should hear some news by COB March 18 or sometime on March 19.    As discussed yesterday, if we learn that at that meeting, the FOMC is concerned about non-movement towards the 2% PCE levels, and implies a delay of the rate hike, the markets in almost all certainly will embrace that strongly.   The “Inflation” topic is front and center now, because the unemployment numbers, basically for one year, are where they need to be.    So the spotlight has moved over to Inflation.   Jobs data is first, as unemployed Americans and hungry families is a pretty big deal, but the jobs/unemployment data is now reflecting pretty good numbers and the spotlight is now on the PCE.   I would be shocked if PCE/inflation was not a topic at the next FOMC meeting.

“The strong dollar may hurt our economy” is sometimes discussed in the media, with the reasoning that Multi-National Enterprises (MNE) such as Wal-Mart, with stores overseas, may see overseas sales negatively impacted, since the foreign currency in that county now buys less that what it did last year.  These companies may report lower profits, and thus send their stock prices down.   While probably correct, I am not loosing sleep over a strong dollar.  Most corporate, Fortune 500 companies, are selling products domestically.   Ford does not sell F-150 pickup trucks to Germans in Frankfurt.  They sell them here, in America.  NOTE:  Boeing Airplane Company, etc may be an exception to this.   A strong American economy means folks are buying cars.  Strong economies typically result in strong currencies, and vice versa.   I am quite proud that our dollar is (thankfully) strong again.   Not a surprise was that its historical all-time-low was in mid-2008, in the middle of our mortgage and financial crisis in USA.    The strong dollar, cheap fuel, and other topics are best left to much smarter folks such as the FOMC to figure out.  In short, I am not getting wrapped around the axle over our “strong dollar.”   I like my dollar to be worth something.  Strong is typically good.

I may post additional updates prior to March 19, but to be quite honest, I expect some increased volatility and turbulence until that date, but with really no earth shattering news.  If the Dow drops 500 points or something, I will share my analysis, however I don’t foresee anything but rough seas between now and March 19.

Thanks for reading and talk to you soon

– Bill Pritchard