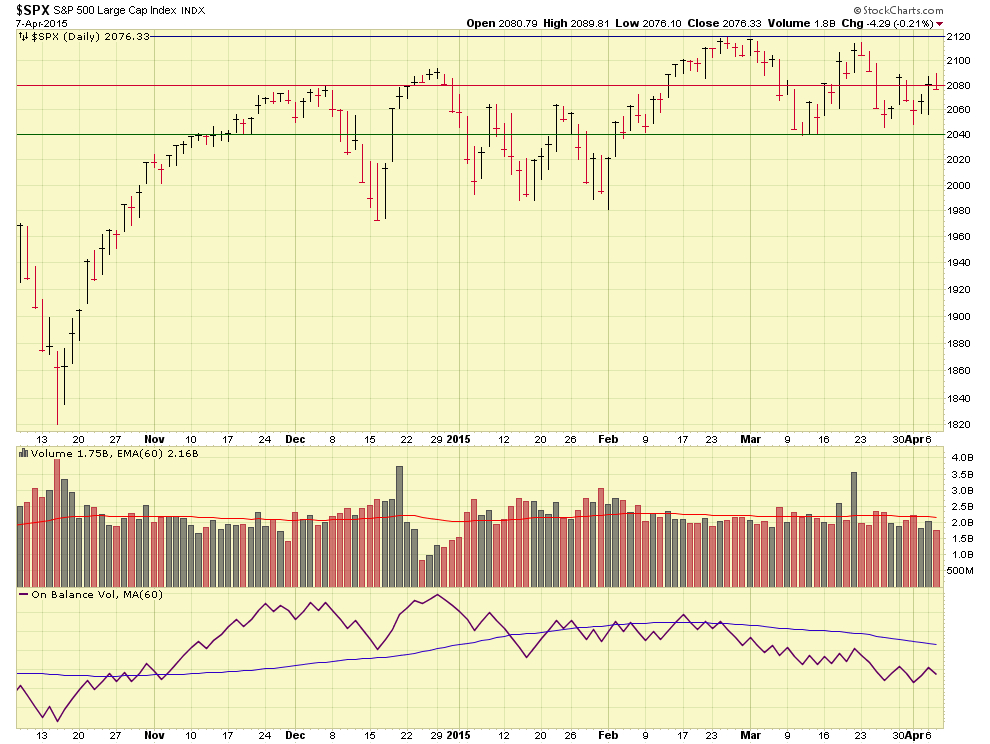
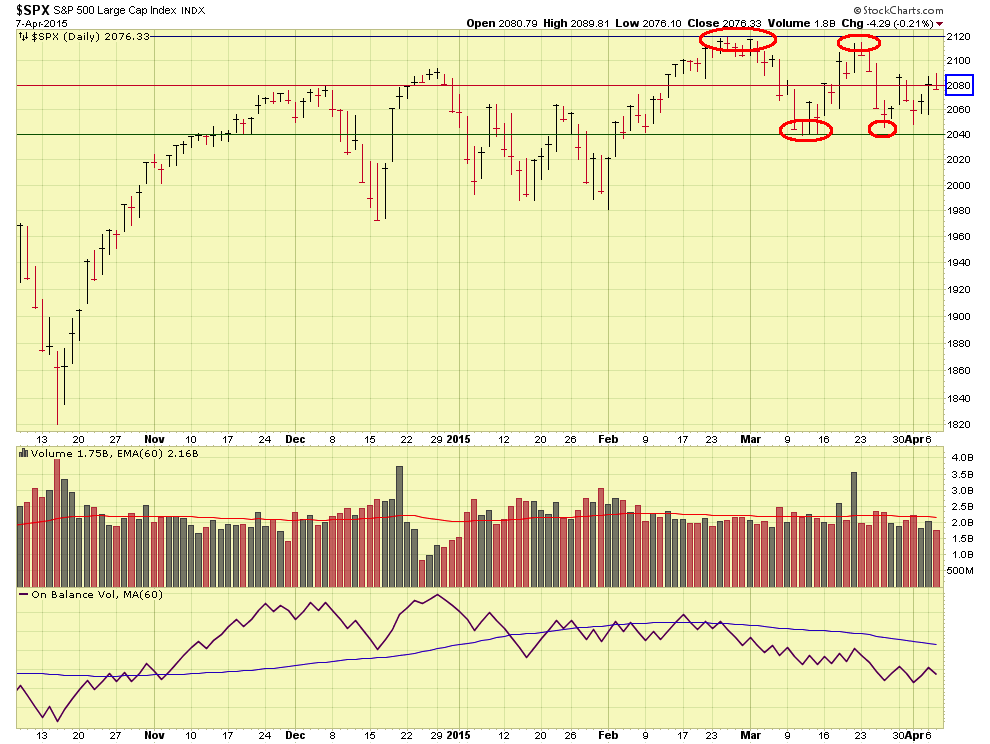
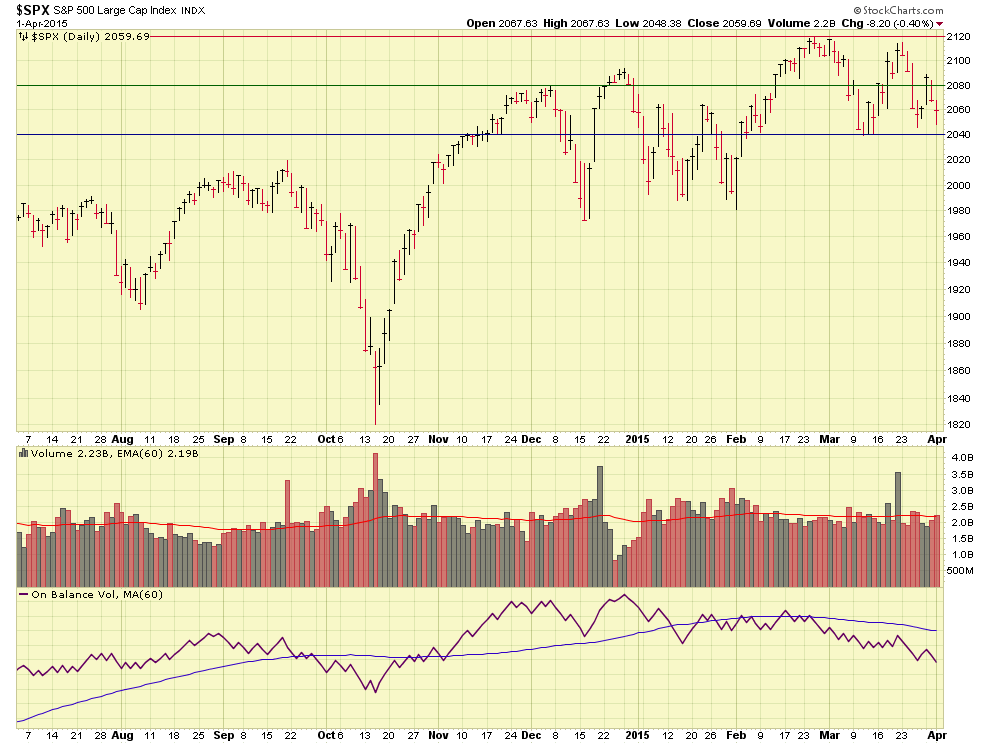
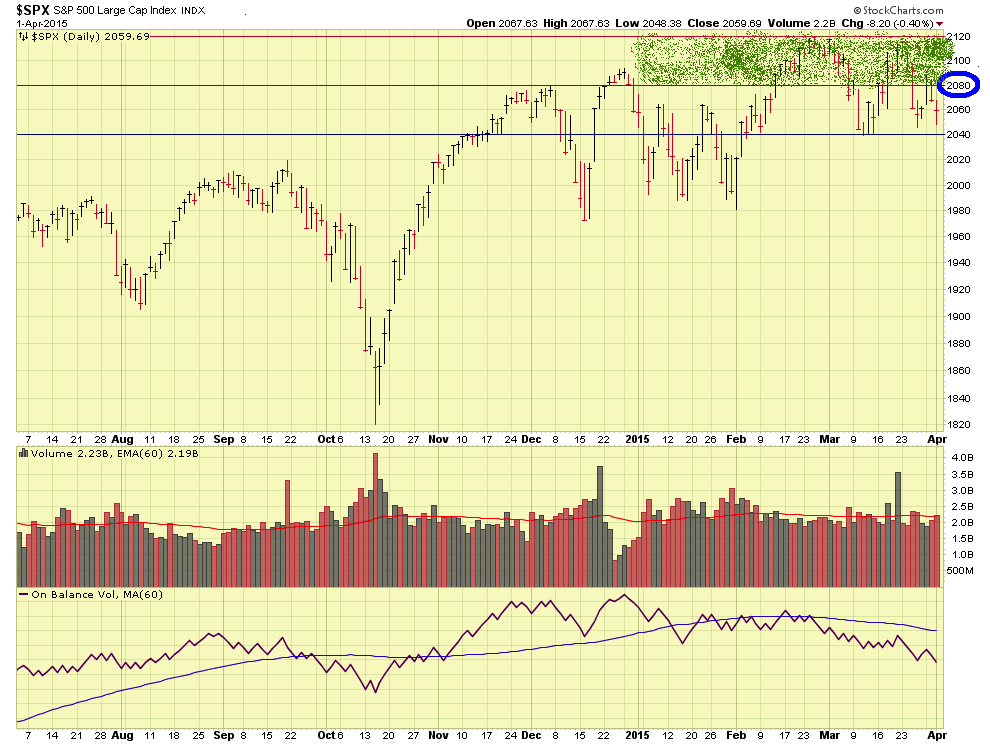
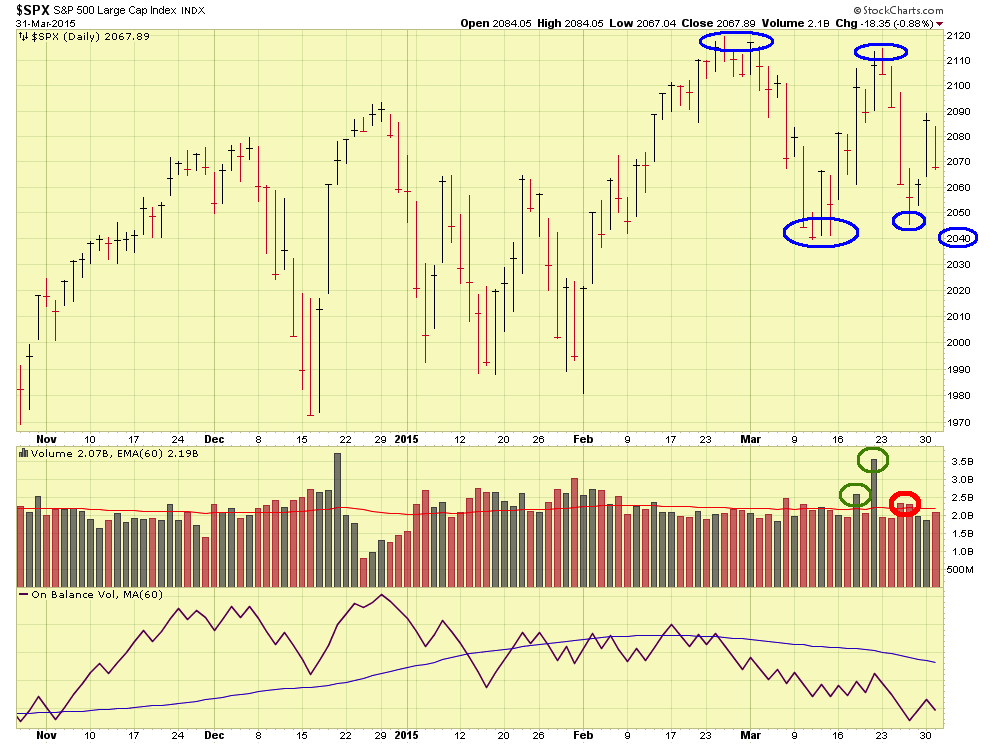
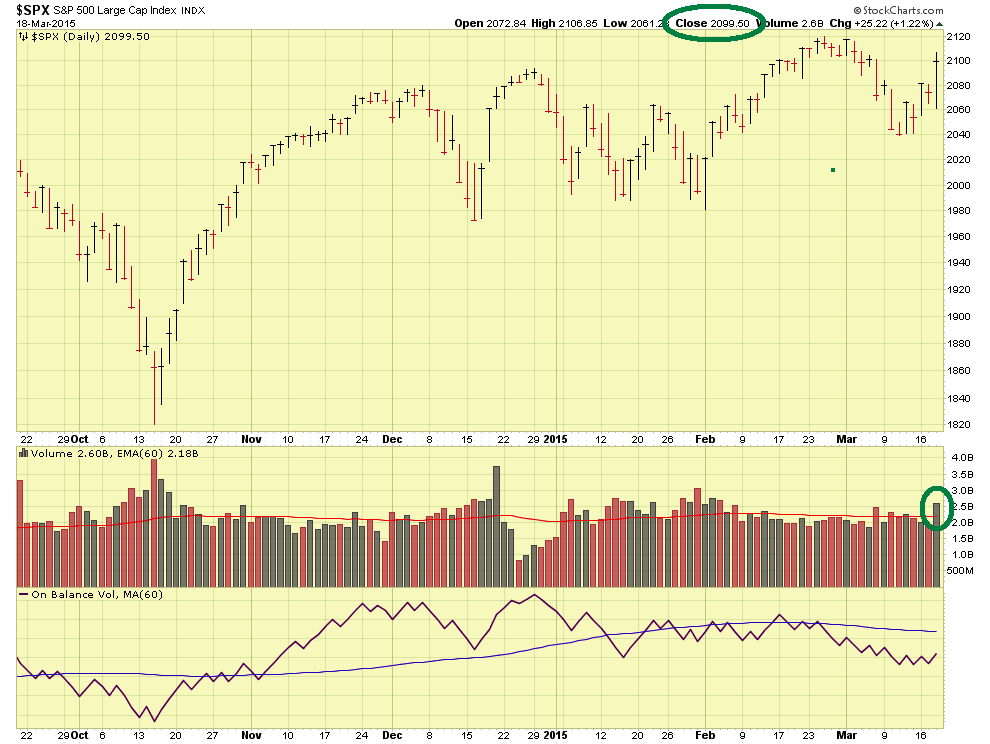
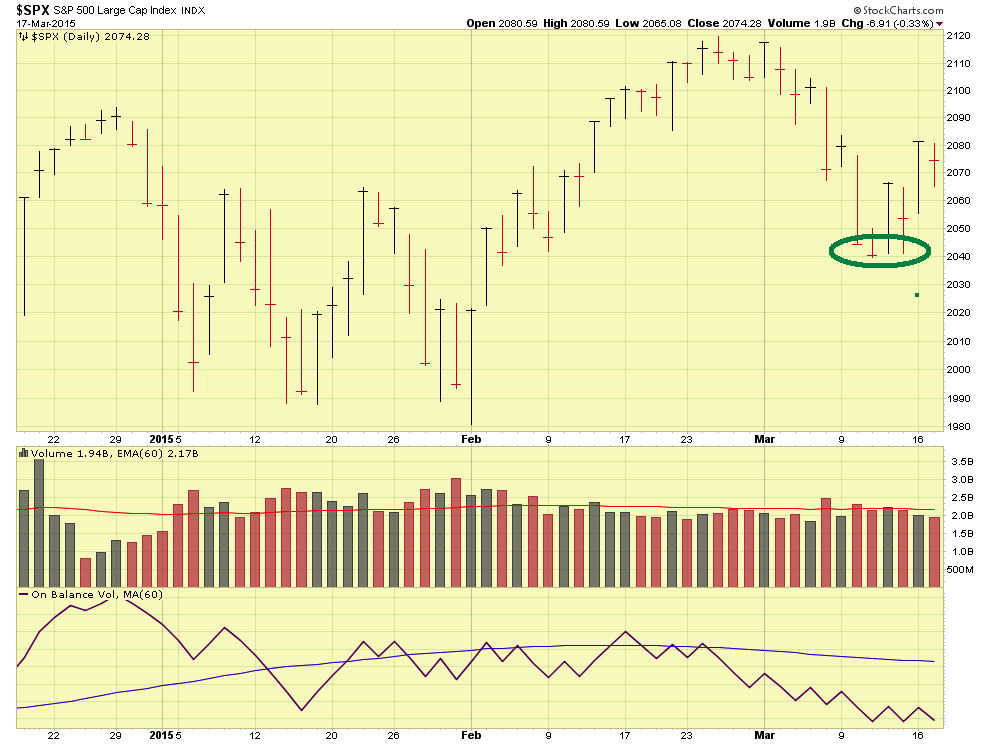
Category Archives: Uncategorized

March 11 Update / All about rate Hikes

Hello everyone

First, I remain 100% S-fund.    Many will stop reading at this point.   For those who wish to continue, March 10 was not a pretty day in the markets, the media’s favorite index, the Dow Jones Index (only representing 30 stocks, far from a “good yardstick” of the entire market) was down over 300 points.  Volumes were up on all indexes, indicating distribution or “sell off” activity.   Today’s post will not have any of my typical charts, it will however attempt to address the “rate hike” issue, mostly the what, why and the when.   Many have approached me for some insight into this, as it is mentioned often enough in the financial press but no real background is discussed regarding this subject.  Numerous other TSP sites have talked about everything but this topic, so I am eager to fill in the voids which exist.  The following represents my opinion and my assessment based on how I see things.

It is my opinion that the March 6 and March 10 sell-offs are directly attributable to fear of the rate hike. 

The what:  The Federal Open Market Committee (FOMC) is expected to raise short-term interest rates, many believe this will occur (the when) in summer/fall 2015.   As anyone with a desk calendar knows, we are approaching mid-March and Spring.

The why (this is important for us):  Rate hikes in theory are believed to result in increased borrowing costs for consumers, large business (who may be buying airplanes, heavy equipment, etc.), home buyers, and others.  Increased borrowing costs may result in reduced spending, which is counter productive to the economy. 

In summary:  Increased interest rates are feared to choke off or hamper business and consumer spending. 

With that very brief, Cliff Notes version, lets take a look at the January 28 FOMC policy statement, available at this link below and cut and pasted into this post.  

http://www.federalreserve.gov/newsevents/press/monetary/20150128a.htm

FOMC-JAN-28

FOMC-2-JAN-28

Evident via the red highlights, is that fact that the term “maximum employment” is used three times, and that “inflation of 2 percent” is used twice.   It is apparent that both of these two items are important to the FOMC, prior to raising rates.   Remember, both.  Inflation rate is based on the Price Consumption Expenditure (PCE) measure.    Most feel that “maximum employment” means that the unemployment statistics must be below 6.5%, which they have been for almost twelve months now.   See table:

UNEMPLOYMENT-TABLE

So we have one of the “both” criteria, pretty clearly established, for almost a year’s timeframe.   However, the FOMC also seeks 2% inflation rate, and we are not there yet.   Note they don’t want inflation higher than, or lower than 2%, they want 2%.   See graphic:

INFLATION-RATE

It is believed that the super cheap oil prices have thrown the inflation rate figures off, hence they are super low.   “Why 2%” and not 3 or 4%?   That is really not known, most conclude “because that is what the FOMC wants” and no additional clues or explanation has really been offered by the FOMC as to that particular number.

The point is this:  An influential government body has released to the public a policy statement.   Multiple times in that statement, they mentioned that they want both a good employment picture and 2% inflation.   Well, we haven’t achieved both.  Regarding inflation, we are not even close.   So I am not so sure that we do see rate hikes in Summer/Fall.  I myself previously believed this also, until digging into the FOMC statement. 

The FOMC meets again March 17-18, so until then, I expect some market nervousness and increased volatility.   As always, I will ultimately respond to the market itself, but based on some additional analysis, to include the above, the Dow Jones 300 point drop on March 10, in and of itself, while not desired, is not causing me to change anything.   If the FOMC murmurs, whispers, implies, anything regarding delaying the rate hike (likely due to inflation targets not met), the markets are going to the stratosphere.   MY OPINION and standard disclaimers apply. 

It is what it is:  we have major elections in the not too distant future (Nov-2016) and this is not the environment for the government body, which oversees national monetary policy, to waffle on their statements or take actions when previously mentioned requirements are not met.   The current administration and political party has enough fires to put out, they don’t need more.  FOMC Chairperson Yellen is a Presidential appointee.  Vice-Chairperson William C. Dudley, also a Presidential appointee, is in charge of the Federal Reserve Bank of New York (aka Wall Street).   A violation of the “both” criteria (a rate hike with only one or the other criteria), with a subsequent interest rate hike, could severely damage many 401k balances, retirement plan balances, and the net worth of many voters.   This is more critical the closer we get to November 2016.  I don’t anticipate any deviation from the “both” criteria.

I remain 100% S-Fund.     Thank you for reading and continuing to share this site with your friends and colleagues.

– Bill Pritchard

Risk Tolerance Poll

Hello folks

If you can please take the time to complete this poll below.  This is prompted by reader email, some who wish less G-Fund, some who feel that the current system in use is too risky.   Please be careful and don’t accidently vote twice.  Based on this poll and additional polls and feedback, I may modify the system discussed on this site.  Thank You !

LINK:   http://goo.gl/2RzQuY

03-06-15 POLL: Choose the selection which most closely reflects your feelings regarding the risk tolerance displayed on The Fed Trader website. This allows me to stay in touch with readership sentiment.

The moves to G-Fund are overly conservative/safe, I prefer to see a LESS conservative approach and can stomach account volatility
The system in use is fine, you can’t please all people all the time
I feel that the G-Fund should be used MORE, and prefer a more conservative/safer approach

Poll Maker

March 4 Update–Market uptrend continues

Hello Everyone

Well, February is now behind us, and I am happy to report that the market uptrend continues.  February performance (SP 500 Index) displayed the largest monthly gain (5.5%) on the index since October 2011.   Coming out of a “sideways” January, this is welcome behavior.

The top performing fund in February was the S-Fund, although it is important to note that the C-Fund and the I-Fund also came in very strong.  Additionally, allow me to highlight the fact that I have “remained in position” (in the S-Fund) since January 1, due to my analysis and proprietary system which reflected that the S-Fund was the best location to be in- even in light of the “sideways action” which we all frustratingly had to endure since approximately November 2014.   Out of ten possible fund choices, to include the “safe haven” G-Fund (which I have no problem using in times of turmoil), the S-Fund was my choice, and I am pleased (and not entirely surprised) that this fund, as expected, was the ideal choice and top performer out of ten funds.    Lets take a look at some charts, one with no comments, then one with comments:

SP-500-03-03-2015SP-500-03-03-2015-comments

Moving forward, it should be noted that the I-Fund may be the place to move to in the near future.   This fund is rather sensitive to world economic issues and political turmoil, so I confess that I am a little “gun-shy” about this fund, in light of everything going on globally.   I will keep folks posted on my decisions, however it is apparent that at least from a performance standpoint, I-Fund may potentially outperform the other funds in the next few months.    At this point, “we are not there yet” and I want to wait until mid-March before I make any serious decisions on changing my TSP allocation.  I remain 100% S-Fund for now.

The good folks over at Investor’s Business Daily are assessing the Accumulation/Distribution level of the SP 500 index as a “B”, out of A to E.  This means that institutional investors such as mutual funds, hedge funds, retirement plans, are actively purchasing and investing (versus selling and exiting) in large cap stocks, the type which make up the SP 500 Index.   I use this rating to “back up” my own analysis, and they are both in concurrence.   In January, the ratings were a little weaker in the D+, C, and C+ range, but improved in February, which is also evidenced by the chart analysis above, reflecting an uptrend.

That is all for this update.   In the “ask and you shall receive category”, please continue to refer your friends and colleagues to this site.   One of my goals is not to necessarily beat the market, but definitely to not let the market beat us.  

Thanks for reading, and again, I am 100% S-Fund at the present time.

– Bill Pritchard

Feb 18 Update / Market recovery Continues

Hello Everyone

I am happy to report that this past Friday the 13th, while historically a day associated to bad luck and horror movies, turned out to be a positive day as far as the markets were concerned.  The prior All-Time-High of 2093, set back in December, was overtaken, with the SP-500 index reaching 2097.03.   Then on Tuesday February 17, the  SP-500 index reached a new high of 2101.30.

Note that these both occurred with the Ukraine “cease-fire” apparently not being entirely adhered to (surprise), and with the Greece situation still not resolved.  Open source news is reporting that Greece may ask for a 6-month extension to their bailout terms (another surprise).    So with both of these things in the picture, it appears that the markets have “priced in” these events.    Lets take a look at some charts of the SP-500 and NASDAQ.  Observe that in recent days, the NASDAQ index has displayed stronger volume and overall behavior than the SP-500.    This could be due to recent strong performance in NASDAQ stock sectors of cyber and IT security and biotech stocks.    Ok, lets look at some charts:

SP500-02-17-15SP500-02-17-15-comments

NASDAQ-02-17-15NASDAQ-02-17-15-comments

I currently remain 100% S-Fund.  I hesitate to change fund allocations until I get a better “handle on” the various fund’s apparent future performance.   Anyone who tells you “move to Z-Fund, it is doing the best, get in early” should be ignored.   In times like these, after an extended sideways market (since basically November), at the present time, nobody can tell you what the individual funds are going to do.   I my prior post I discussed three floating swimmers on their back.   In this post I will use another analogy (I am a big analogy guy…), and state that the three TSP funds (S/I/C) are like three baby birds that just broke thru their shells.   Which one will fly the farthest?   No way to determine that right now.   With that said, in 30 days (mid-March) we should have a better idea on what fund is performing best, which may provide insight into TSP allocation decisions.  

On Wednesday February 18, the Federal Open Market Committee minutes will be released, at 2PM Eastern Time.   These are the minutes from the January 28 FOMC meeting, and everyone will be over analyzing every word and vowel in the minutes, trying to determine when interest rates will be raised.   I remain committed to my prior opinion that we will see rates increase in summer/fall 2015.

Again, I remain 100% S-Fund (a fine allocation, 50/50 S-Fund and C-Fund also fine).    In mid-March, I will take a look at all funds and other relevant information for a potential TSP Allocation change in my account.

Please forward this update and this free website to your friends and colleagues, so that they too may benefit from trustworthy and accurate market analysis.   This free site’s sole purpose is to educate and inform the TSP participant, with the belief that the educated participant can then make educated decisions, with a resulting positive performance enhancement to his TSP.  As a fellow TSP participant, I have “skin in the game” along with you, and try to put out the correct balance of opinion, commentary, and analysis, without getting overly complicated or burying the reader in obscure economic theory or reports.  

As we enter 2015, I have made a very conservative estimate that my ever growing multi-thousand subscribership represents a total of over $300M in TSP account funds.  By all appearances, this site has been received very well.

Thanks for reading, talk to you soon…

– Bill Pritchard

Feb 13 Update / Markets appear to be Recovering

Hello Everyone

This update will be rather short, however I am happy to report that the markets appear to be recovering.   On Feb-12, the SP 500 Index “broke thru” the overhead resistance area located at 2080.  As most know, the index has been range-bound 1970 to 2080 since January 1.   The next overhead resistance is at 2093, which is the All Time High achieved in December 2014.   However I have shifted my outlook from “worried” to “optimistic” as of now due to this recent penetration of 2080.  We are “off the lows” (see charts below) in the 1980-1970 area, which is positive.

Some back-drop news likely accounting for these moves is the reported cease-fire reached in Ukraine (note “we have seen this before” however) and some speculation that Greece and Germany, the country with the biggest exposure to the Greek bailout package, may be reaching some sort of agreement.   I have reported previously on this site regarding the Greek situation, I will not re-hash that reporting, however per internet news sources, the “drop dead date” for the newly elected Greek government to have some sort of resolution to their bailout program is February 28.   So between today and February 28, we may still see volatility in the markets.

Note:   There is some argument for a possible move to I-Fund, IF the Greek situation is resolved, and IF the Ukraine cease fire appears to hold.   If stability returns to the international picture, the I-Fund may begin to “take the lead” over other funds.  This is merely speculation on my part and by no means would I try to “get ahead” of the possible I-Fund recovery by investing in it today.   I would not make that move yet.  Lets monitor things a little longer. 

My preliminary analysis shows that the C-Fund is leading this past week, then S-Fund, then I-Fund.   It is very difficult to pick out “the winner” when all contenders have been range-bound and volatile.   This is akin to three swimmers in a swimming pool with choppy waves, floating in circles, on their backs.  “Show me the fastest swimmer”.   Very hard to determine that under those circumstances.  However, on a preliminary basis, C-Fund is leading.   I remain 100% S-Fund presently until we get a little more insight into the market’s direction. 

Note, as discussed on this site previously, when large cap stocks (C-Fund) consistently lead all other stocks, this is reflective of a mature “long in the tooth” bull market, a market which may be reaching the end of the bull cycle.  

Here are some charts, first with no comments, then one with comments:

SP-500-02-12-15

SP-500-02-12-15-comments

Note that Monday February 16 is a Federal Holiday and the stock markets will be closed.   Friday February 13 trading volumes may be light in the markets due to the long weekend.  

I remain 100% S-Fund at the present time.   Lets monitor things; ideally the SP 500 remains above 2080, if it drops back below that, the strength we saw today may be short lived.

Thanks for reading, talk to you soon….

– Bill Pritchard

Feb 3 Update / January closes down 3%

Hello Everybody

I apologize for the lack of updates in January, I received a few emails asking if I had disappeared.   No, I am here, however I don’t think the bull market is here much anymore, at least if we go back to November 2014 until present.   The market has been a ping-pong ball for the entire month of January, hence I have had no actionable ideas to execute or report.   Sadly, we may have a move to G-Fund looming in the near future.

Using the SP 500 has a benchmark, that index has traded in basically the 2080 area (overhead resistance) to the 1970 area (support) since November and December.   It has ping-ponged up strongly on some days, then on other days crashed hard….only to go back up the next day.   This kind of behavior is very difficult to respond to, much less predict (aka crystal ball).   Since a “picture is worth a thousand words” lets look at three charts of the SP 500:

SP-500-02-02-15  

SP-500-02-02-15-comments-1

SP-500-02-02-15-comments-2

As can be observed on the charts, the SP 500 displayed its last gasp of bull-life on December 29, when it hit an All Time High of 2093.55.   However, unfortunately, it sold off hard the first two weeks of January, and January closed down 3.07% (that is –3.07%). 

I have reported previously on concepts such as the January Barometer , with a reported accuracy rate of 88%.   This concept states basically that the market will perform for the remainder of the year, as it performed in January.   A down January ?   A down year.  An up January ?  An up year.   Yes, naysayers exist but I have not been one to listen to naysayers.   With that said, I see more “bear signals” than “bull signals”, which are:

  • The aforementioned January Barometer with a –3.07% January
  • Numerous “Distribution Days” on the indexes over recent weeks
  • Almost guaranteed interest rate hikes summer/fall 2015
  • (No surprise) international issues such a Russia downgraded to Junk credit rating and new political power in Greece

My finger is close to the G-Fund “trigger” however at the present time I will remain in S-Fund.   Due to recent market swings, it is very difficult to out-guess or respond to the index, and will remain “in current position” (S-Fund) until I get better information which may cause me to move elsewhere.   All stock funds lost money in January 2015, based on my data, FYI.  We get two moves in the TSP funds a month, so for now I am standing by.

For now, lets monitor the indexes (don’t let the Dow scare you, it is only 30 stocks, but makes for big media headlines), the key levels for the SP 500 in my opinion are 2080 to the upside (and ultimately 2094 an beyond) and 1970 to the downside.  If we get close to or below 1970, coupled with how the volume is acting, and “backdrop” (news, world events, etc.) information, this may trigger me to move to G-Fund.     

Again, I am presently 100% S-Fund and may move to G-Fund in the near future.

Thank you everyone

– Bill Pritchard

Jan 13 PM Update / Cracks re-appearing

Good Evening Folks

I am out TDY on the road so updates may be sporadic this week, however unfortunately the markets are re-displaying volatility and some cracks are appearing.   Today the markets rallied strong, then closed down, on above average volume.    This in my opinion is attributable to crude oil going even lower (now $44) and continued issues on the international front.   Recall that we have Greek Parliament elections on Jan 25.

In addition, a recent article has appeared on Fox Business, authored by Dallas wealth advisor Ed Butowsky.   This article is somewhat in the “where have you heard this before” category, please take a look.    Mr. Butowsky is a well-reputed advisor and frequently appears on Fox Business and other financial outlets discussing his views of the markets.   In summary, if you are hypnotized by the “gains only” you are being myopic on your overall account health and investing.   Where have you heard “protect your balance” or “minimize negative hits” ?   How about “gains are not the only thing” etc ?

Thank you Ed, for a great article.   You put it so well, in a way I was unable to do so myself.

With that, I remain 100% S-Fund but will be closely monitoring things for a possible G-Fund move.

Thanks guys !

– Bill P

Markets rally Strong

Good Evening

A brief update that on Weds/Jan 7 and Thurs/Jan 8, the market rallied strong both days, with the Dow Jones making triple digit gains on both days, on above average volume.   These are very positive and bullish signs, reflecting a possible reversal of the trend which started downward earlier in the week.   I am especially pleased that the markets have rallied strong in the face of the unfortunate terrorist events in France and the on-going Greek situation regarding elections and exiting the Eurozone.    Lets take a look at the NASDAQ, which is best reflects the bullish action:

NASDAQ-01-08-15NASDAQ-01-08-15-comments

As can be seen the NASDAQ “gapped up” today which means that today’s low is higher than yesterday’s high, resulting in a “gap” when charted graphically.   Gap Ups are very bullish and reliable indicators, even more so, when coupled with above average volume which indeed occurred today.   The action observed Jan 7 and Jan 8 is “classic bull market” action, in which Jan 7 closed higher than prior day, on above average volume, then on Jan 8, the market closed higher than Jan 7, on higher (and thus also above average volume) than the Jan 7 volume.

So we have numerous positives which have occurred the last two days.   It is not known at this point what will happen on Friday/Jan 9, but if that day is at worse, flat, and at best, another good performance, then my fears earlier this week will be much subsided. 

This week’s trading so far reflects that the “least worse performer” (considering the down days of Monday and Tuesday thrown into the analysis) is the C-Fund, with the next “least worse performer” being the S-Fund.    I am personally 100% S-Fund, but this mature bull market, 50% S-Fund and 50% C-Fund is probably an equally good option.   Note that historically, when a bull market finally tops out and heads down, the large cap stocks are the ones performing the best.   So if we see behavior associated to large cap stocks/C-Fund outperforming S-Fund, constantly, this is yet another indicator of a bull market coming to an end.   We are not seeing that (quite) yet.

Today’s action is testimony why I don’t panic nor advocate that anyone else panic, when markets have a one or two-day crash.   We need to step back, breathe, assess, then take action.   Part of my “assessment toolbox” is my chart analysis, volume/price review, and some other tools.   In aviation, pilots are taught that the first thing to do in an emergency is “wind your watch.”   In other words, numerous accidents have happened, many fatal, because a pilot panicked and responded incorrectly to an emergency situation, at times making the situation worse.   So we must breathe, pause, assess, and wind our watch.  And try to remove the emotion, theory, crystal balls, out of the process and use objective & sound tools and methods.

With that said, lets see what happens Friday/Jan 9.

Everyone have a great weekend unless we talk sooner.

– Bill Pritchard

January 7 2015 Update / Bearish signals Observed

Hello Everyone

Unfortunately 2015 is off to a poor start; my last post discussed the fact that the first trading day of 2015, Friday Jan 2, was sandwiched between Thursday Jan 1 (a holiday) and Saturday Jan 3 (market is closed).   Jan 2, not shockingly, saw very little market volume however nonetheless closed down.   The first trading day of January is symbolic as it tends to “set the tone” for things to come.    Then on Monday, January 5, arguably the first trading day “operationally speaking”, due to the New Year’s weekend now past, witnessed the Dow Jones closing down 330 points.  Then Tuesday, January 6, the Dow Jones closed down 130 points.

While I am the first guy in a crowd to try to look for the positive when surrounded by bad news, I admit there just isn’t anything positive so far this new year from a market standpoint.   I would prefer flat or lethargic action versus  back to back down days, on above average volume.   See charts, first those with no comments, then with comments.   Note my primary analysis tool remains the SP 500 Index.

SP-500-01-06-15SP-500-01-06-15-comments

NASDAQ-01-06-15NASDAQ-01-06-15-comments

Long story short, my finger is on the trigger guard for a move to G-Fund.   Barring exigent circumstances or a compelling story in the background, I will likely go to G-Fund if the SP 500 penetrates below and closes below 1970 on the index.  I of course will update this site as needed.   Observe that the “market knows all” and at the end of the day, “price is all that matters.”   In other words, it doesn’t matter what theory or opinion exists as to why things are happening, what matters is what is happening.  For further insight into my belief system on this, take a look at my March 2013 post, titled Buy and Hold is Dead, which generated quite a bit of positive emails from readers.

With that said, it is often useful to have an understanding of the forces in play behind the market’s movement.   Just remember to respond to the market itself, and not news stories or talking head experts on cable news.  A few things to be aware of:

– Oil Prices at all time lows, currently $50 per barrel:   Some energy companies are starting to lay off workers due to reduced exploration activity in 2015.   Also, OPEC (by the way when you have some time, take a look at who the members of OPEC are and try to count how many are clearly US allies) appears to be displeased with our successful domestic oil exploration and appears to be playing the game of who can hold their breath longer.  In other words, our exploration has caused (in my opinion) supply to go up, and drive price down, displeasing OPEC, who now has decided to not turn off their spigots and thus send the price lower (more supply coming into market), thus causing pain and suffering to the very US energy companies who facilitated or directly influenced the domestic exploration in the first place.   Once these “evil companies” are snuffed out, OPEC may turn the spigots off again, let demand consume the supply, and thus the prices will resume upward.   Call me a conspiracy theorist but that is my opinion.

Oil chart, with comments, below:

CRUDE-OIL-01-06-15-comments

– Greek Parliament elections planned for January 25:  Yes, it is “them again” aka Greece, affecting the markets.   As some may recall, the International Monetary Fund (IMF) and European Union (EU) previously agreed to assist with bailing Greece out of its financial problems, however the SYRIZA Party, a leftist party, is favored to win Parliament on January 25.    The leader of this party wants “debt restructuring” which basically means he wants to call MasterCard and tell them the agreed-upon agreement ?   Nah, I just decided it will not work and I don’t want to abide by it.    This is a dangerous action, and most of us have seen what a political party can do, aka Hugo Chavez/Venezuela or Evo Morales/Bolivia.   Basically anything they want to do, to include re-writing their Constitution.   This situation bears watching.

– Republican control over Congress:   As of January 6 2015, the Republican Party has complete control over Congress, led by Mitch McConnell and John Boehner.   While this did not cause the Dow to go down, it is fruitful to watch because historically the markets do best under a Republican Congress and a Democratic President.   The good folks at the Hirsh Organization discussed this on page 101 of The Almanac InvestorThe same folks have conducted extensive research on the “January Barometer” and “January Effect” both of which have proponents (I am one) and naysayers.  At this point, it is not known if Republican control over Congress will positively impact the markets.

– Remember that the markets are a leading, not lagging, indicator:  This statement always generates some email traffic, and a Google search will return umpteen thousand theories, however my belief is that the markets stall out before major economic news of reflecting a recession/depression or worsening economy.    They also go up far in advance of news/reports of a recovering economy.    So our current action may be the harbinger of negative news in 12-18 months.   Remember we have almost guaranteed interest rate hikes summer/fall 2015.  

– In the “Other” category:   I am mostly a technical analysis investor, with some fundamental theory, while others are all fundamental analysis.   A technical guy believes “it is all about the price”, a fundamental guy believes it is about “valuation” and “worth” and “future earnings” etc. stuff.   Which is all fine and good, in the academic confines of business school.    So this guy and I engage in an email discussion on which school of thought is “valid” (similar to which religion is “valid”).   Long story short, I told him fundamental analysis is akin to valuing an antique muscle car (Pontiac GTO) merely by the sum of its component costs.   Four rubber tires cost X, the carpet costs X, the metal in the body and bumpers are worth X, thus, according to fundamental analysis, this muscle car should only be worth X.   However, I pointed out that in an auction environment (the stock markets are indeed auctions), the price of this car is irrespective of component costs, it is based on the emotion, sentiment, and perceived value by the bidders, who will likely run the price up high enough until it is sold.     After I explained it that way, this guy stopped emailing me.  

On that note, I remain 100% S-Fund but a move to G-Fund may be necessary to stop further bleeding and prevent additional damage.

Thanks for reading…

– Bill Pritchard

End of 2014 Update / Happy New Year to All

Hello Folks and Happy New Year

2014 trading is now over, with December 31 being the last day of trading for the year.   Unfortunately, the markets closed down today, with the Dow Jones Index down 160 points.   The SP 500’s December gains were erased as a result of today’s performance.   Volume was higher than prior day, but still below its average trading volume, obviously a result of many market participants being out of the game for the holidays.   However I would have preferred an “up day” on the last day of the year, versus a down day.  Investors Business Daily is reporting six (6) Distribution Days on the SP 500 within the last few weeks, which is a negative sign.    Some observations:

2014 Close-out observations

Here is a chart of the SP 500, without comments, my primary graphics program is Window’s based and I am on Annual Leave with my MacBook, and have yet to “master” the MacBook graphics editing software I have installed.

SP-500-12-31-14

Some positive observations are the SP 500 closed out 2014 up 11% for the year, notwithstanding quite a bit of turbulence throughout the year.   Small Cap stocks (S-Fund) will likely come in as top performer for December, and out performed the last three months, according to my analysis.   I-Fund underperformed both the C-Fund and S-Fund for the year, not a huge surprise, due to various international flare ups and global economic issues.

Another positive observation is the “2080 level” on the SP 500 was broken on December 23, reflecting the market’s desire to seek higher altitudes, a positive sign.

Note that the first trading day of the year, Friday January 2, is sandwiched between Thursday (New Years) and Saturday, and it is unlikely we see any huge market volume that day.   With that said, an “up day” is preferred versus a down day, as the first day of the year “sets the tone” for the mood and sentiment of the market.   I remain 100% S-Fund.

2015 Observations and Challenges Ahead

As stated above, the first trading day(s) of the calendar year “sets the tone” for the rest of the year.   So we need to monitor that.    In addition, Crude Oil continues downward, it is currently trading at $53 a barrel level.   See chart:

CRUDE-OIL-12-31-14While “cheap gas” is good for consumers, Mom and Dad who are deciding to top the minivan fuel tank and take that road trip or not, depending on what circle you ask, it may or may not be bad for big business.  I sat down and had lunch recently with a close friend who is employed in the Oil and Gas exploration industry in West Texas, he felt that $70 a barrel crude oil was the magic number so everyone makes money but fuel is not super expensive for the end consumer.   West Texas exploration, to include fracking, has slowed down significantly,  and as we enter 2015, Oil and Gas (aka “ONG”) companies will be re-assessing 2015 projects.    Lets take a look at the screen shot of my iPhone Rig Data app, which shows oil rig activity in proximity to your GPS location.   The red pins represent an oil rig.

IMG_0874

Immediately apparent is the extensive drilling activity in Texas, especially near the Big Lake, TX and Carrizo Springs, TX areas.    While this does not directly impact your TSP balance, I feel this information sheds some light on the oil production going on in our country, as our domestic companies try to deliver product to the end-user while seeking to keep the Supply/Demand equation in balance so that prices are not too cheap nor too high.

Additional challenges we face are the interest rate hikes expected in summer/fall 2015,  which may reduce lending and business activity, which may then affect other things.   Note that historically, markets never have positively respond to interest rate hikes, so expect some turbulence in response to this, up to and including a new bear market as a worst case scenario.

One more challenge is the fact that the current bull market is very mature, being six (6) years old now.   So we are “due” a correction/bear market, it is just a question of when.

With that said, I remain 100% S-Fund.  We had tremendous subscriber growth in 2014, thanks for the interest and support.   I get a lot of cool emails and appreciate all of them.   Please continue to share this site with your friends and coworkers.  I wish everyone a Happy New Year and see you in a week or two with another update.   Thank you !

– Bill Pritchard