
Good Morning
I typically do not post morning updates, however somewhat unanticipated news out of China has caused global markets to “sell off” overnight, resulting in Dow Jones Futures (trade 24 hours) to be trading down 150+ points as of 7:45 AM Central Time on today. The US stock markets will open in approx 30 minutes from this post, or 8:30 AM Central Time. See chart below:
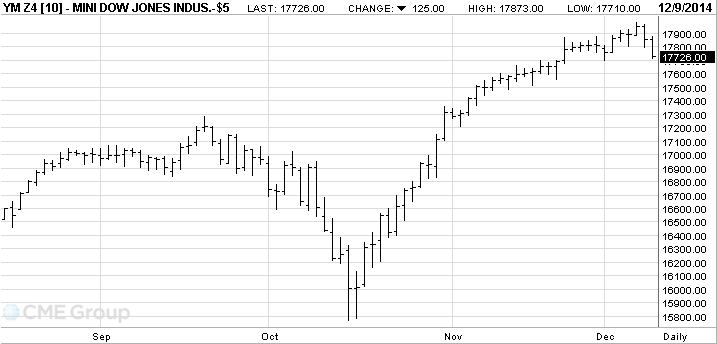
This chart is available at this link, which will of course change its content during the trading day:
http://www.cmegroup.com/trading/equity-index/us-index/e-mini-dow.html
While I try not to crystal-ball the “why” or the “what will it do tomorrow” questions, and instead prefer to react to the market itself, I will state that the financial news sites are all pointing the finger towards China for this sell-off. Apparently China is tightening up their own lending and monetary policies at their banks, and as we know, when lending is reduced or restricted, this can affect growth and future business activity. The Shanghai Index is reportedly suffering its greatest one-day sell off in five years as we speak. Concerns over slowing Chinese GDP growth, along with some speculation that China’s recent prior growth is a carbon copy of the easy-mortgage/lending-fueled boom of USA, (which crashed hard in 2007 to 2009), resulting in Chinese lenders trying to avoid a similar USA situation. Expect numerous opinions and speculation to explain China’s problems in today’s financial media. Expect statements that the world is ending (and statements that the world is just beginning), another reason it is important to react to the market itself and not the confusing signals that exist in the media. China being China, one can never be 100 percent certain that their data and reporting is fully accurate, FYI.
We also know that markets tend to over react to things, so a one day event of a down day is by itself, nothing to overly be concerned with, BUT we do need to monitor things over the next few days/weeks. Note that December is typically a very good month, historically, for the US markets.
I would not be surprised to see International stocks / I-Fund get hit pretty hard today, I have expressed my opinion numerous times on this site as to why I am not in the I-Fund and its increased risk, in light of the “current climate” the world is in right now (war, global economic issues, etc). Actually that was stated far too pleasantly. I expect International stocks, especially those with Asia exposure, to be creamed today. Again, those are my opinions.
I am happy that this is happening on a Tuesday morning, as this allows the markets to assess things and possibly bounce back at the end of the week. Typically if this happened on a Thursday or Friday, the markets would sell off even harder as folks don’t want to be “holding anything” over the weekend, and a minor panic attack on a Thursday or Friday can result in a huge over reaction and sell off. I am optimistic we don’t see that happen.
I am currently 100% S-Fund.
Thank You
– Bill Pritchard


