Category Archives: Uncategorized

Sept 30 Update / Markets continue downward action

Hello Everybody

Today is Sept 30; the markets have continued to decline since my last update on Sept 25.   It is worthwhile to mention that since August 7, I have expressed my personal opinion regarding concerns that the market is weakening and becoming a risky place to be in.   Since August 7, I have been 100% G-Fund.   I got a few reader emails regarding being over-conservative and some “missed gains” but I stand by my opinion that the markets are deteriorating.  I have wished and hoped for positive signs, and believe me, watch the market everyday, searching for a slice of good news or rays of sunshine between the storm clouds, but have not seen any yet.

Today we had another Distribution Day in the markets, and according to the folks over at Investors Business Daily, we are at 7 Distribution Days for the NASDAQ and 6 days for the SP 500.   I include “almost distribution days” in my personal assessment of the markets, as “almost days” are important to be cognizant of, even if not technically qualifying as Distribution days.   We have had a handful of “almost days” in both indexes.   As discussed on this site, multiple days of distribution, typically four to seven, within four to six trading weeks, tends to stop existing uptrends and reverse them into downtrends.   We are basically at that point now.  

Lets look at some charts.  I used SPY ETF for a better snapshot of volume activity of the SP 500.  Note that 1965 is the new support level for the SP 500.   Any penetration below this level is yet another warning sign of an upcoming (and now probable) Bear market.

SPY-09-30-14-commentsSP-500-09-30-14-close-comments

As we can see, the index continues downward, with increased volume during the recent few days.   It should be noted that a frequently used Small-Cap Index, the Russell 2000 (the TSP S-Fund will behave very close to this index), is already below its 200-day Moving Average, which is a Bearish (negative) sign for small-cap stocks.

It is valuable to consider the fact that prior bear markets caught most people by surprise, this occurred in 1987, in 2000, again in 2008 (although less so, most woke up to the fact that a grave crisis was in the works), and will probably occur again this time around.  History almost always repeats itself.   In almost every case, investors were riding the euphoria of a prior bull market and “good times”, and with their heads in the sand, got blindsided by a bear market.   However warning signs exist, all documented on this site, of a possible looming bear market.  This can occur gradually “death by a thousand paper cuts” or can start with a huge slam down, then a continued, but gradual, downward trend.   While one cannot predict the severity of the next bear market, one can control his exposure via allocation decisions and diversification, to include being entirely out of stocks all together.

Now, the market may magically reverse direction tomorrow and go to the moon.   And if anybody wants to be out of G-Fund, it is me.   But, I don’t see that happening.

In summary I continue to remain 100% G-Fund.

I ask that everyone continue to share this site with friends and colleagues.   Subscriber numbers have gone into the stratosphere, and I want to keep the momentum going.

Thanks and talk to everyone soon

– Bill Pritchard


Sept 25 Update / Dow down 250 Points

Good afternoon from a major airport Admirals Lounge and Wi-Fi….

In the “I kinda mentioned this” category, today the market’s engine lost a few more cylinders, with the Dow Jones index dropping 250 points in one day (we have approx 2 hours left to go….present time is 12:55 PM Central Time).

Financial media is advising that this is the largest decline in 8 weeks.   Note that this is on HIGH VOLUME….this is clearly undesirable behavior.

Note additionally that I personally cannot find any other TSP information site, or even most of the major market news websites, that has taken the lonely position I have held since August, in which I presented my opinion that the market was weak and subject to additional declines.   Since August, I have been in G-Fund and continue to remain in G-Fund.

Talk to everyone soon….I will be boarding a flight soon and off the air for a few days in travel status.

– Bill Pritchard

Markets still display weakness

Good Evening

I will keep this update brief, as I am TDY on the road, so no cool charts this post.   It is also almost midnight and just got out of my “simulator training” which means torture for 4 hours in the flight simulator, testing the pilot’s ability to deal with engine fires, ice covered runways, blown tires, and other things.   Prior to that was 4 hours of “ground school” consisting of questions and answers and refresher on aircraft systems and procedures.  So my brain currently is not fully operational.

Long story short, the markets continue to display weakness (since August 7, I have spoken regarding the market’s apparent weakness and lack of volume) and the markets have not celebrated the recent Federal Reserve Chief Janet Yellen’s comments regarding the economy.   The media was speaking highly of the “good news” associated to this meeting, one news of which is no apparent acceleration of the date of the looming Summer/Fall 2015 interest rate hike.   The markets did not “jump for joy” over this, and were up, I believe 40 to 50 points on the Dow for the day.   I knew something was wrong as soon as I witnessed this lackluster response.

Recent sessions have seen above average volume and selling, aka “distribution.”   As stated here, multiple days of distribution, typically four to seven, within four to six trading weeks, tends to stop existing uptrends and reverse them into downtrends.  The Distribution Day count is five for the NASDAQ and three for the SP 500 since Sept-3 and a few “almost distribution” days on both indexes.

The Russell 2000 Index, depending on what metric you use, is arguably already in “bear market” mode.  This index tracks small cap stocks and behaves very similar to the TSP S-Fund.

Observers will query me,  “But we have made new highs”.   Well, yes, made them, only to reverse down every time we “make a new high.”   This is not the action associated to a healthy, energetic, uptrend.   The 4540 NASDAQ and 1983 SP 500 levels have been violated, these were discussed in my last post.

I will post updates as needed over the next week or so.  My stated belief that G-Fund is safest is still intact.  To emphasize, my personal opinion is that the markets are displaying weakness and their behavior is a possible prelude to a new Bear Market/downtrend, potentially damaging to TSP account holders exposed in stock funds.   This is my personal opinion.   Sometimes you gotta be strong when skeptics exists….I am sticking to my guns (no pun intended….) and stand by that position.   Observe that I am more concerned with loss protection than gain realization, as gains (the “scoreboard”) will take care of themselves.  Catastrophic losses however, are something difficult to recover from.

Thanks everyone…..talk to you soon

– Bill Pritchard


Sept 10 Update / Markets display weakness

Hello Folks

Well, the markets continue to display weakness and low volumes, albeit their arrival to All-Time-Highs in prior days.  It is almost as if they have coasted uphill, with no engine power, and are slowing down, running out of speed and momentum.   Yes, the powerless car has coasted up the hill and has travelled a pretty good distance, but what is under the hood ?  Is the engine still functioning properly?    Do we want to get into this car and trust that it can transport us somewhere ? 

CAR-HILL

 NASDAQ-09-09-14SP-500-09-09-14

Above are the the most recent charts of the NASDAQ Index and SP 500 Index.

Scrutiny of these charts will reveal the obvious “All-Time-Highs” achieved on Sept-4 for the NASDAQ and Sept-3 for the SP 500, however on both dates the indexed opened “up” in the morning and closed lower than the open price, on above average volume.  So while yes, a new “High” was achieved, it was in the initial opening stages and the markets sold off both days after the high was attained.

Also note on Sept-2, the first day after the Labor Day weekend (Monday Sept-1 the markets were closed), Wall Street appeared to be in good spirits, with decent uptick and buying on the NASDAQ.   The SP 500 was ho-hum on Sept-2, not hugely up, and not down.  However since Sept-2, the markets have seen some “Distribution Days” (discussed in depth on this site previously) which are undesired.   My own studies, combined with research and studies performed by the folks at Investors Business Daily, reflect that after four or five days of Distribution over a span of four to five weeks, the markets almost always turn down.    We have had two days of distribution and one day of “almost distribution”, on both indexes.   The clock has started on Sept-3 (Distribution Day-1), and we need to monitor additional distribution days thru Oct-3 (four weeks minimum).    Lets take a look at the charts again, but with my comments on them:

NASDAQ-09-09-14-COMMENTSSP-500-09-09-14-COMMENTS

It is also apparent that the new support level for the NASDAQ is 4540 area, anything below that is undesirable.   The support level for the SP 500 will be 1983 area.     More important, well, just as important, is volume action.    If we hit say 1975, on low volume, ok, I am not losing sleep, although that is undesired action.   But if we hit 1975 on huge volume, major red flag.

To supplement my chart analysis is the Accumulation and Distribution Ratings from the folks at Investors Business Daily.   Basically, A is “good” and E is “poor”, with “A” representing huge institutional money in-flows to stocks, while “E” is heavy selling by institutional money (aka mutual funds, pension plans, hedge funds, etc.).    Lets take a look at the ratings for the SP 500 Index since Aug 27 (about two weeks ago)

ACCUM-DIST

So, going back two weeks, we don’t really see any huge changes in these ratings.   No major improvements to “justify” the recent uptrend which indeed has occurred.  I have been a skeptic of this uptrend, and chosen to pass on possible gains (those that remained in stocks did, indeed, achieve some gains) to instead monitor things a little longer.

To recap:

  1. We have two distribution days since Sept-3.  
  2. Volumes have been light until Sept-3, indicating a prior lack of interest by major money managers in accumulating additional stocks.
  3. Yes, the index has climbed upward, however this is on low volume (#2) and my opinion is the “new uptrend” is suspect
  4. 4540 NASDAQ and 1983 SP 500 are the levels to keep an eye on.
  5. I am personally 100% G-Fund

As stated previously, I am tweaking my system somewhat (not hugely, however) as many have emailed me seeking a little more risk (and possible gains) instead of being conservative.   Not everybody mind you, some appreciate the conservative approach, but there exists a clear “fan base” if you will, that has voiced a tolerance for more risk.    This modified system is still in beta-testing and is almost worthy of a patent, but since my system is largely math-based, I doubt that a patent will happen (can’t put a patent on math).  It is also primarily NASDAQ based, versus SP 500 based, which arguably is becoming “Dow-Like” (Dow Jones Index is only 30 stocks).  The inclusion of the NASDAQ as a data source is showing promise. Expect a “roll out” of this system in another month or two.  

Please continue to encourage your colleagues to subscribe to this free site, and thank you for the great emails and the interest.   As a fellow TSP Participant, I have “skin in the game” and I put my name after every post.   If a similar site (and there are many) is not putting their personal name behind their product, what does that say about the product ?   

For those who view the site via the web (versus subscribe for email updates), I would encourage you to sign up for an email subscription.   This does a few things, 1) you get the updates mere seconds after I publish them  2) once received via email, you can refer back to it without having to rely on an internet connection.  3) Emails can also be printed and thrown in your briefcase etc.  Some of the updates reflect time critical information- email subscribers get the update immediately. 

Again, I am 100% G-Fund for the present time. 

Thank You for reading… 

– Bill Pritchard

* This update published 09-09-14 at 11:30 PM CDT

Aug 29 Update – Lack of volume concerning

Hello Folks

Well as we finish up the week, my immediate observation over the last few days is that the market volumes are very low.   The fundamental/economic situation aka “background” has not changed (and how could it, my last update was merely six days ago), and I still see no justification to leave the G-Fund in pursuit of questionable upticks.  

It should be noted that the SP 500 Index made a new All-Time-High (“ATH”) on August 26, attaining 2005.04.    This is a new, all time, historical high.   Now, many will recall that I love ATH’s, and if you trade a personal stock account, when a stock makes an ATH, this is a very reliable signal to buy some of that stock.  I don’t want to get side-tracked on personal trading, but the concept is equally important when looking at the indexes.  However the ATH “buy signal” must, or almost-must, always have above average volume with it.

Above average volume is reflective that the underlying event (the ATH), is sustainable, as there are “voters” (buyers) in large numbers, behind the move.  Versus a floating sailboat on the lake which just, by the stroke of luck, caught a breeze towards Bull Market Island.   A light breeze and a random drift, even if in the “correct direction”, does not equal a clear cut path, with sustainable force.

It should be noted that Bull Markets need volume to propel and to sustain them, but Bear Markets can fall apart on their own.  Volume is not a requirement to make a market cavitate and go down.   That’s what makes this particular situation somewhat dicey, we have a mature Bull Market (depending on what indicator you are using, most accept that the current Bull Market has existed since late 2011), and the volumes are starting to dry up.   Furthermore “Institutional participation” (pension fund plans, mutual funds, hedge funds, etc.) is slowing down.   Institutional money is what moves markets, not Uncle Raymond with his E-Trade account.    Investors Business Daily measures this in their Accumulation/Distribution Rating.    Basically “A” is strong buying (which tends to send stocks upward) and “E” is heavy selling (which tends to send stocks downward).    Heavy selling is a bad sign.   Unfortunately, while our sailboat apparently caught a breeze and sent it upwards, since August-1, the SP 500 distribution has hovered between D and E distribution.  

I use the Accumulation/Distribution Rating as one of many tools to assess the temperature of the market.   See photo of my whiteboard at home, with dates and accompanying rating, below:

WHITE-BOARD-1

I do this every evening, as a “supplemental tool” in addition to other tools in my system.   Notice a few “E” ratings over the last few days.   The highly desirable “A” or “B” are nowhere to be found.

Gee Bill, that is great, but can you give us some charts of what we should see ?

Yes, of course, lets take a look at the chart of the SP 500 back in March 2003.  Note that “war” is a major catalyst for the markets (FAQ #6) and back in 2003, we were not battle fatigued like most agree our country is now.  Sept-11-2001 was still very fresh in our memories and the nation was “coming together” and being patriotic on all fronts.  We also (in 2003 to 2008) had a major housing boom (inspired as we now know) by some easy lending and mortgage activity.   People bought houses, and send bank stocks, home builder stocks, Home Depot stock, etc, higher.    Lets take a look at the 2003 charts, with no comments, and with comments.   Pay special attention to the VOLUME activity.

SP-500-2003

SP-500-2003-comments

That is what we are looking for.   Now, I doubt we will see those kinds of volumes now, as in March 2003 most folks were out of the market, having been hurt in the previous cycle of NASDAQ 2000 crash.   So the swimming pool had water but no swimmers.   In March 2003, the whole neighborhood jumped into the pool and a resulting major splash was seen on the volumes.    Today, 2014, in our three year old (or so) Bull Market, those who are inclined to buy stocks, are already in stocks.   So a legit question to be asked is “who is on the sidelines that can come in and send stocks higher.”   And by looking at the Accumulation/Distribution ratings, the institutional investors are exiting, versus entering, stocks.

Lets take a look at the charts, without comments and with.   Keep the above volume observations from the 2003 charts, fresh in your mind, as you look at the August 2014 volumes while the market is “making new record highs.”   Again, hey, I would rather have a new high versus a new low, as I am the last guy who wants to spend his life in G-Fund, but the fact remains that the volumes are low and things are still questionable, in my opinion.   Charts:

SP-500-08.28.14

SP-500-08.28.14-close-comments

Lets take a look at a closer up view now:

SP-500-08.28.14-close

SP-500-08.28.14-close-comments

You can see the clear uptrend, past the 1990 area (area of prior resistance) but the volume just isn’t there.   Now:  If we get just one day (ok, maybe two) of above average volume, with the index closing higher than the open, with clear, obvious, “thrust” upward, I will be back in C or S fund.    I will send everyone letters of apology for those who spent August in G-Fund.   Just remember, the recent “uptrend” has been on low volume.   Volume is as important, if not more important that the actual price movement itself of the underlying index or stock.  

A very easy, non-chart, way, to monitor volume is go to Yahoo Finance and look at the SPY ETF, which tracks the SP 500.  I apologize for the full size image with all the white space, I am cutting and pasting screenshots past midnight on minimal sleep….

SPY-example

So, you can use the SPY ETF to monitor volume.   If the individual trader gets a grasp of volume and trend direction, you can enhance your performance greatly.

OK, most folks are worn out by now with all this volume talk.   Long story short, I remain 100% G-Fund, pending some volume increases and “reassurance” that these new highs are sustainable.  

I will be monitoring things and any major events, I will post an update on this site.

Thanks and everybody have a good Labor Day weekend.  Markets are closed on Monday Sept 1, FYI.  Friday Aug 29 volumes should be very light, as Wall Street prepares for the long weekend.

– Bill Pritchard

Aug 22 Update / Reader Email, Trading System discussed, and other stuff

Hello Folks

Well, on August 7, I told the world (well, told my multi-thousand email subscribers, and who knows how many web-only viewers) that I was going to G-Fund, and articulated my reasoning behind this decision.

As luck would have it, the market of course resumed its uptrend just as I was exiting to the G-Fund.   The positive “spin” on this is that due to the typical two-day delay to process fund changes, I remained in stock funds and still grabbed some of the uptrend while my fund change was being processed.   However, I missed out on any gains which continued to develop in the markets once I arrived into G-Fund.   Dang it I hate it when that happens.   I just wish I could always buy the bottom and sell the top, perfectly, every time.   Of course, reality is different that that.

Not surprisingly, some of my sharp readers have contacted me regarding “my system” and my tolerance for risk.   The readership ranges literally from new rookie entry level folks with 30 years in front of them, to senior folks pending retirement, to already-retired-folks.   Some of my retired readers, if they are 98% G-Fund and 2% S-Fund, they are sweating bullets and can’t sleep at night.  So the “one tool approach” does not necessarily work for every single person, due to the variety of circumstances out there.   I got a good email from a younger reader, which I will paraphrase to protect the innocent, but it went along these lines:

Bill, I wonder if you are too conservative.  I have 20 years ahead of me, and am willing to accept some risk to get some gains.   Great site, just sharing my thoughts.

Since Bill (that would be me) is much closer to retirement eligibility than not being close, yes, I am a little more conservative.   Or maybe much more.

With leads me to discuss my system.   This is already in the FAQ Section but the FAQ section tends to get cobwebs and not read much, so I will touch on my system on this post.

The system combines fundamental analysis and economic concepts with market volume, price performance, technical analysis, and other metrics and this is what is used to determine my trading decisions.   I have taken bits and pieces from other systems, studied (and continue to study) for over 20 years, and developed my own system.    Similar to someone (Grandma) who develops their own soup recipe.   Different ingredients from different recipes and a personal twist on things and now you have Grandma’s recipe.  You can’t put a Patent on carrots or chicken broth, so Grandma’s recipe is probably not patented, and neither is mine, however I am going to go out on a limb here (remember, I will be searching for employment in the after life when I retire….) and push the envelope some, and call my system proprietary. 

With that said, I am not going to hand over the launch codes, but I will say that my system derives “Sell Signals” and “Buy Signals” based on abnormal price and volume behavior, along with mathematical smoothing and time based parameters.   It is my belief that behind the markets are people, and price behavior is a direct reflection of those people.  In addition, if “background events” such as war, bombs, new political leadership, economic policy changes, are existing and “in sync” with my system’s signals, then I will go ahead and pull the trigger (this could be to enter G-Fund or to enter stock funds, depending on the situation).  However I do not pull the trigger without having what I believe is the proper sight picture (discussed above).   It so happened on August 7, that Ukraine/Russia, ISIS in Iraq, Argentina default, PLUS the markets flashing warning signs, led me to believe that I could put rounds on target and that the sight picture was correct.

Ok, enough beating myself up.  On a positive note, the indexes are inches away from historical, All-Time-Highs, a concept discussed numerous times on this site.   This week, Aug 18 – Aug 22, the Central Bankers Summit is happening at Jackson Hole, Wyoming, and market participation (aka volume) is less than average, as most major traders and money managers probably want this week to “clear” before they jump back into things.   The general consensus so far, if you read the financial press, is that the economy is rebounding faster than anticipated, and that the interest rates may be raised even earlier than expected (currently believed to be summer or fall 2015).   So while the markets have indeed gone up this week, the volume has been lackluster, and I am waiting until mid-next week to see how the markets are behaving, prior to making any TSP decisions.     Lets take a look at some charts.   Charts are shown with no comments, then with comments, for readability.

SP-500-08-21-2014

SP-500-08-21-2014-comments

SP-500-08-21-2014-close

SP-500-08-21-2014-close-comments

As can be seen, we had some very valid warning signs last week, but a few days later, this apparent new downtrend reversed itself.

With the bile still in my throat after the above trend reversal, I am tweaking my system and making some minor adjustments.   Somebody somewhere said once that if you are not constantly learning and improving and seeking development, then you are dying, and I agree with that statement.   Thus I plan to be improving my own methodologies.  I have found (as one example) that by removing the 2008-2009 dataset from my research that my system is much improved.   This time period was the notorious mortgage meltdown/housing crisis/financial doomsday market.  But I still have work to do.  I have sought out the advice of trusted fellow traders and colleagues, to include big name folks who I am fortunate to have internet e-mail relationships with.   So this is a work in progress.  My customer base (that would be you) demands it, so I am working on some minor tweaks to the recipe.  

I would like to insert a link to an MP3 broadcast by Michael Covel, a bestselling author who is a proponent of Trend Following, which my style can be categorized as.   This 15 minute audio file is entertaining, and relevant, his views and mine have little variation and are in agreement in almost all respects.    File and audio is the work of Michael Covel.

LINK:  http://hwcdn.libsyn.com/p/3/0/b/30bd55df63fb83db/231.mp3?c_id=7096268&expiration=1408687522&hwt=72fcaa4915fa2882439369ba690d990c

The Fed Trader site has grown huge since it went “live” a few years ago, with no marketing or advertising on my part.  I must be offering something of value, something useful, something informative, and something entertaining, thus resulting in such a huge followership.    Just to refresh the disclaimer, this site is indeed entertainment only and the individual investor or TSP participant is ultimately responsible for his investment decisions.

I remain 100% G-Fund at the present time.

Thank YOU for reading and please continue to pass this site to your colleagues and coworkers.

Thanks and talk to everyone soon…

– Bill Pritchard

Aug 7 Update – I am 100% G-Fund

Tonight August 7 , per public news sources, President Obama authorized military air strikes in Iraq.    A review of both the markets since August 1 (the last update to this site, released in evening July 31) and the behavior of the SP 500 evening futures (likely “in response” to Mr. Obama’s announcement), has caused me to return to 100% G-Fund.   Note that the Ukraine situation is ongoing, as is the Gaza/Israel situation.   As stated before, “we are in challenging times” right now.

As previously discussed, on July 31, Argentina defaulted on its debt.   I argued that “Argentina didn’t matter” and I believe I was largely correct, however the indexes continued to go lower.   On August 1, the Department of Labor released data reflecting a 6.2% unemployment rate.   As discussed previously on this site, improved unemployment rates below the 6.5% threshold level are believed by many to be the “green light” that the FOMC needs to raise the Federal Funds Rate.   We now have a guaranteed future rate hike, as prior unemployment data has shown a continued trend of improvement, versus a one-time data anomaly.  Furthermore, “rate hikes” are not welcomed with open arms by Wall Street, and this will continue to cause additional indigestion for the markets.  The next rate hike will likely occur in Summer/Fall 2015.

Also, since August 1 (a mere six days ago), the Gaza/Israel and Ukraine situation has grown worse, or at the minimum, not improved.   This has caused additional heartburn for the markets.

Lets look at the long-term chart of SP 500, a one month chart of the SP 500, and charts of the SPY ETF which tracks the SP 500 Index and is helpful in order to monitor volume activity.   Comments are on the charts themselves.    Important to note is the 1930 level on the SP 500 has been penetrated to the downside and the index has not shown a desire to resume its uptrend.    Also important to note is the overall uptrend of the market, existing since early 2013, is still largely intact (and why getting on and off the “train” is fine, as long as the train is still going in the direction you want).    However it is my opinion that greater, more severe, pain may occur in the markets in two to four weeks.   I am getting off the train, which appears to be slowing down.   As the train slows, I am jumping off now (and maybe twisting my ankle and getting some bruises) versus remain a passenger, as the train approaches (a possible) a fallen bridge a few miles ahead and plunges into the river below.

SP-500-longrange-08-07-14SP-500-longrange-08-07-14-comments SP-500-08-07-14SP-500INDEX-08-07-14

Lets take a look at the SP 500 futures evening session.   Note that the only major event I can associate with tonight’s sell-off is the news announcement regarding airstrikes in Iraq.

SP-500-FUTURES-08-07-14 SP-500-FUTURES-08-07-14-commentsIn summary, I am going 100% G-Fund (request submitted tonight, will likely not take effect until Monday) for the time being.   In addition, I am placing tight sell-stop orders in my personal brokerage account, regarding my personal stock holdings.

Thanks for reading !    This post done via my MacBook (TDY right now…) so some graphics or text may end up looking different from prior posts.

Please share this update and my free site with others who may find it useful or interesting.    Thank You.

– Bill Pritchard

Argentina creams US Markets / Aug 1 Update

Well, Argentina has successfully creamed US Markets, at least for one day, by defaulting on July 31 one minute past midnight.    This default was briefly touched on in my June 29 post on this site.   Interesting is that the Argentina default was not mentioned much in the “other” sites (to include Marketwatch, Motley Fool, etc.) until now.   My June 29 post discussed my feeling that our markets will recover from this, which I still believe, but the fact remains that our markets have taken numerous hits over the last few weeks, and one is left to wonder when (and from where…) the knock-out punch will finally occur.   The fact that the markets are still hanging on, is a reflection in my opinion that a recovery is not impossible.  I don’t think anyone will argue the statement that the world is in challenging times right now.   

The Dow Jones Index closed down 317 points, with both the Dow and SP 500 Indexes down for the month of July (July is now over).   In my July 18 post I discussed some challenges facing the markets, and how the YTD returns for the TSP Funds have been lackluster.   This assumes you were in the funds since January 1, your returns have been 6% to 7%.    Now we have an additional challenge:  Argentina in default.    The various financial sites are linking today’s market sell-off due to multiple reasons (most sites have journalists behind them, not traders or folks with skin in the game).   However, I purposely stayed up July 30 night from 10PM, 11PM, thru midnight, 1AM, 2AM, and literally watched the SP 500 Futures (which trade at night) rollover and go downhill in-sync with the approaching default, and past midnight, the default.   Of course I was cringing on July 31 morning when Wall Street opened.   

Now before we panic over Argentina, let me make some observations, listed below, about why I believe (aka “opinion”) that this is not something to panic over.    Observe that I like Argentina as a tourist and have been to Buenos Aires and really enjoyed it.  But, this is not about tourism. 

Some Reasons the markets should not panic over Argentina

1.   Argentina is not a player on the world economic or financial arena.   China, England, Russia, Saudi Arabia, Japan, USA, are.   If a country, via governmental policy or political actions, can cause financial harm to the United States, then they are a player.   If not, they are not.   This is my definition, not your typical definition Money Magazine definition.

2.  Argentina produces no critical/crucial, products for the United States consumer (wine is not one of them), in which product price-change or currency rates may impact the United States.   Argentina does not produce or source products for Wal-Mart’s zillion stores (China does), it does not produce crude oil, and it’s banks are not safe-havens (far from it) for money or locations of investment.   Asia and Europe, are (amongst others).

3.  No critical thinking, ground breaking thought or ideas, are coming from Argentina or any of Latin America for that matter.   Japan brought us the Sony Walkman and the Honda Civic, England brings us a military and intelligence ally, and China brings us the ability to manufacture a zillion widgets for one dollar, keeping the price cheap for the consumer while allowing profits for the corporation.  Korea builds the Samsung phone.  If any of the above face a default, this could impact our country.   Argentina ?  

4.   Argentina does not have a huge labor force used (via outsourcing) by US manufacturers.   Such a labor force needs to be paid (currency rates), fed (food availability), retained (Company A offers better package than Company B), etc.  Mexico does (Ford builds cars in Hermosillo).   China, obviously, does (ask Wal-Mart).   India does (call Citibank customer service, your call is answered in India).   Argentina ?

So as you can guess by now, I don’t think (again, opinion…) that we should panic over Argentina.   As I have touched on in prior posts, the markets REACT to things (another reason we, the investor, should REACT to the market, versus try to predict something that spends its entire existence itself reacting to other stuff).   Panic and Greed are common reactions expressed by the market.    As most of us know, in a panic situation (think “Fire” in a movie theatre), the masses flee out the doors without looking back at the progress of the fire or verifying if a fire indeed exists.  It is everyman for himself.   If a bunch of people are swimming at the beach and someone yells “Shark”, nobody is sticking around to verify that indeed a shark, and not another type of fish, is swimming in the area.  The markets, composed of people, are no different.

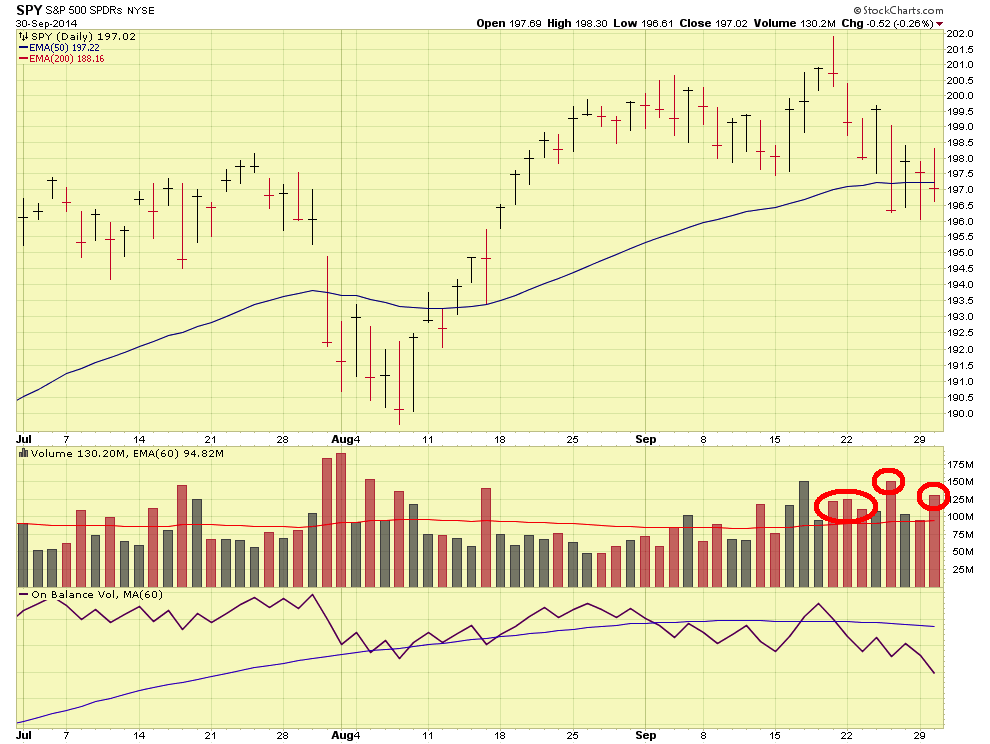
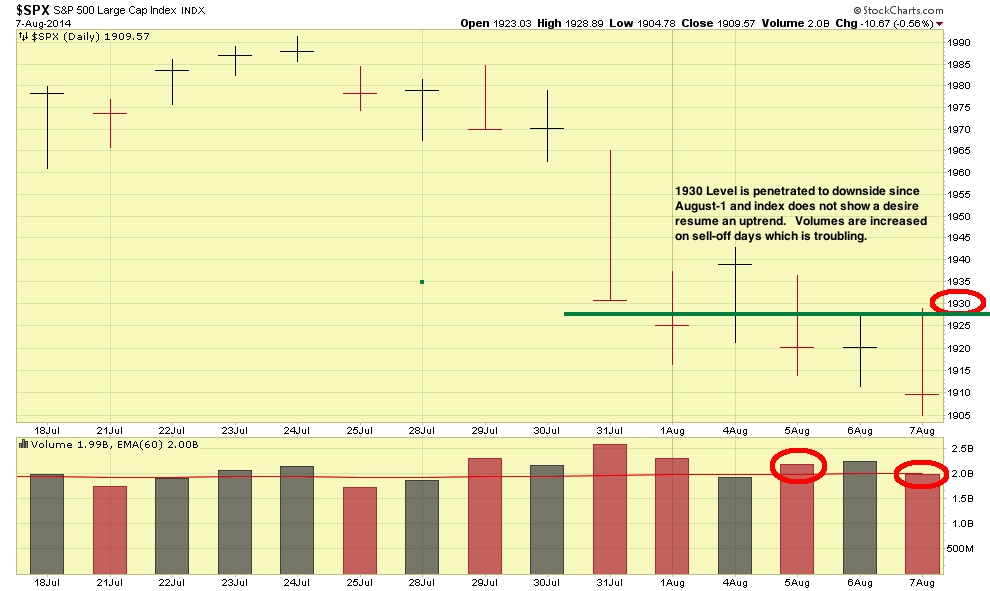
With the “you are starting to ramble” warning light illuminated, let me move forward to some charts.   My opinions about Argentina aside, the market is indeed displaying weakness and has had numerous days of “Distribution” in recent weeks.   This in almost all cases will send an index into a new downtrend.

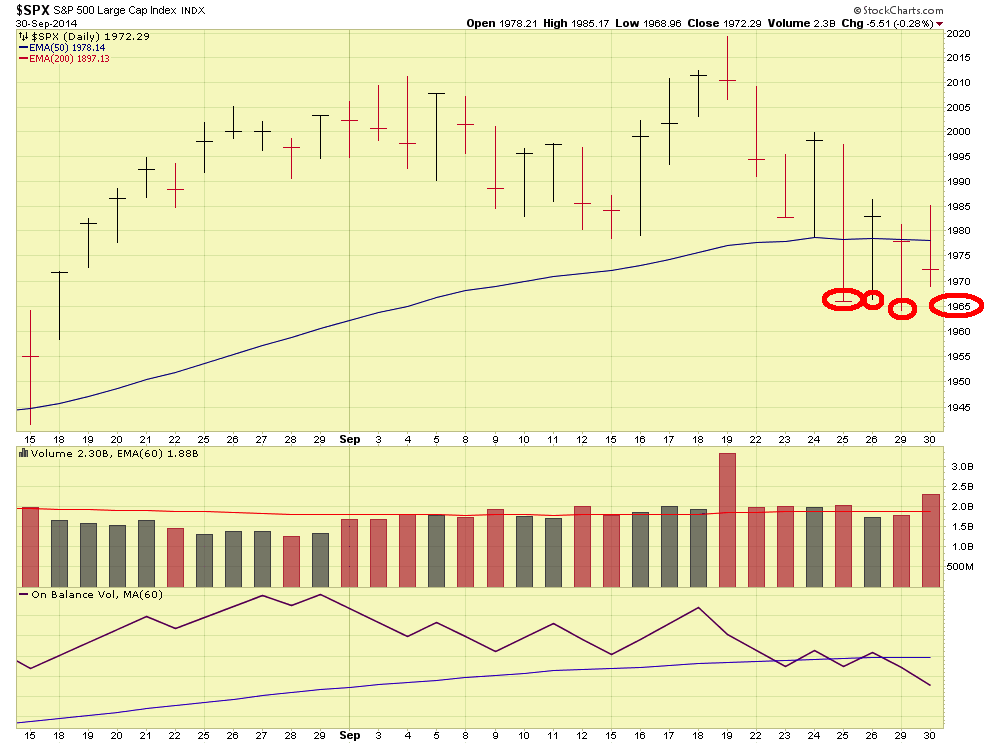
1930 is our new support level to watch for the SP 500, which was hit today and represents that the index has been placed on re-wind back to June 15.   All gains from June 15 to present have been erased.

SP-500-07.31.14

SP-500-07.31.14-comments

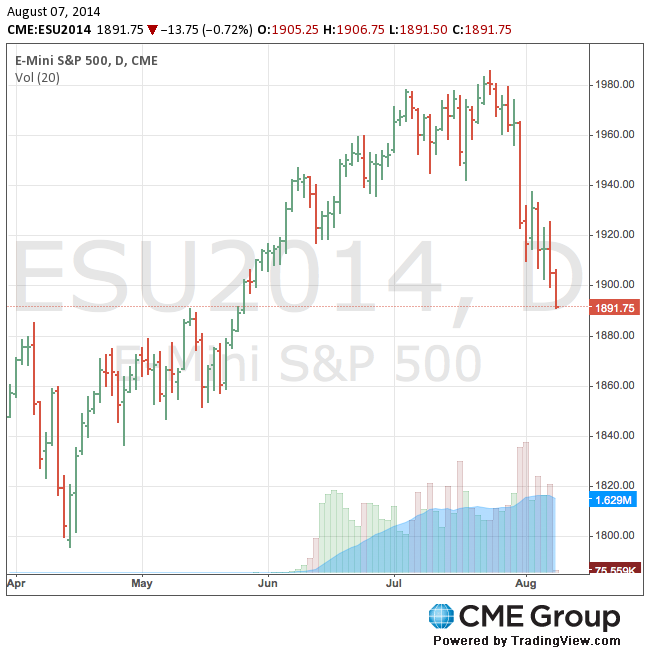
With July 31 daytime trading now over, I am pleased to see that the SP 500 Futures (evening July 31) have recovered (slightly).    This does not mean the bottom cannot fall out, but lets keep our fingers crossed.

SP-500-FUTURES-07.31.14

SP-500-FUTURES-07.31.14-comments

As can be seen above, the evening SP 500 futures session may have “come to its senses”, with trading action having not gone below the July-31 day session.

In final testimony to my “we should not panic” argument, is Gold, the default “panic currency” which basically did nothing in response to Argentina.   In theory, it should go up, as people panic because the world is about to end.   Gold did nothing.    See chart:

GOLD-07-31-14

GOLD-07-31-14-comments

In summary, I am “monitoring the situation” and as discussed, the market indeed is showing signs of weakness.   I remain 50% S-Fund and 50% C-fund however this can change at any time.   Also, we need to watch the 1930 level on the SP 500 as any action below that is undesired.

I apologize for the long post, but a 300 point loss on the Dow Jones is not exactly “short story” material.   I wanted to put forth my perspectives and opinion on what is going on.  

NOTE:  Fridays are typically bad days in general for the markets, as people tend to unload holdings prior to the weekend, in case the world ends over the weekend.    Friday August 1 may be a down day, but this in and of itself may not be “additional bad news” it may be typical Friday behavior.   The volume on the index will assist us in determining what is going on.

As always, please share this site with your friends and colleagues.

Talk to everybody soon and thanks for reading….

– Bill Pritchard

* This August 1 update released on July 31 / 11:15 PM CDT

July 18 Update / My TSP Allocation: 50% S and 50% C-Fund

Hello Folks

Well as we now know, Malaysia Airlines lost a B-777 airliner over Ukraine yesterday July 17, which was clearly a tragic event, with early reports indicating a surface to air missile being the cause.  It is my opinion, that this reflects the difference between trained, professional, soldiers, in an organized military force of a flag-bearing nation (even if “enemy”), versus caveman-savage rebels/terrorists with varsity level equipment at their disposal (Surface to Air missiles).   This is a TSP site, not a political one, so I will stop there.  I commented on a previous IL-76 cargo plane shoot-down in my June 16 post, regarding unarmed cargo planes being shot down.   One month (almost to the day) later, a commercial, civilian, airliner is shot down.

Not surprisingly, the market sold off hard the same day, and as I have commented before, almost all market behavior is psychological in nature and the result of humans acting out of fear, greed, and (at times) optimism.

I, like all of you, was taken aback by the market sell-off but I have chosen to remain invested in stocks and the TSP stock funds.    Since we cannot predict “Black Swan” events such as the above (or anything else for that matter- many talking heads on cable TV news claim however that they can predict stuff….), I choose to respond to the market itself.   In most cases, past behavior is reflective of future behavior.    It should be noted that the next day, July 18, the markets rallied, with the Dow Jones index closing up 123 points.   

The SP 500 index has had multiple days of selling, on above average volume, also called “distribution”, in recent weeks.  This is not healthy for any uptrend, and multiple days of selling can stall and reverse the uptrend into a downtrend and into a new bear market.  This activity requires that we keep our trigger fingers close to the G-Fund trigger guard.    It should be also noted that the S-Fund (small cap stocks) have taken a drastic turn to the south, largely due to the BioTech sector taking a beating in the press.   The leading fund is currently the C-Fund.

Historically, when a bull market “tops out” (reaches the highest point it can go, then goes flat, then starts into a bear market), large cap stocks (such as the C-Fund holdings) are the last ones to fall, and are outperforming everyone else.   This is because the “big money” investors (hedge funds, mutual funds, retirement plans aka TSP) typically gravitate towards larger stocks and perceived blue chip “stable” companies.   It is easier (and your customers won’t be asking questions) to invest $50 Billion into Microsoft or Boeing stock than it is into smaller company stock such as a Biotech with a pending FDA approval or a company selling solar panels for your house.   However, this very behavior (large cap stocks outperforming all others) can be used to identify turning points in the market, and shifts in sentiment.

It should be noted that in the early stages of a new Bull market, people are excited, and motivated, and tend to invest in the riskier, “next big thing” companies, which are in almost all cases small-cap stocks.  Therefore, when you see small cap stocks start to outperform large caps, and you have additional indications (volume, index price performance) that a market trend change is occurring, you can often get into position for a new Bull market way ahead of everyone else, usually with profitable results.

Lets cut to the chase, I am moving my TSP Allocation to 50% S-Fund and 50% C-Fund.   I am not going fully 100% C-Fund because I think (my opinion) that the small caps have taken some underserved hits over the last 30 days and I anticipate some health returning to that category.   I could be mistaken, but these are not “normal times” and I can’t remember in over 20 years of active trading experience, markets facing so many issues at the same time.   We have crude oil and middle east problems, and serious problems with Iraq violence.   We have a possible American exit from Afghanistan, a source country of terrorism.   We are sanctioning Russia, a country we “need” to serve as referee when other countries will not listen to us.  Many emerging market nations, as if the above issues are not enough to swallow, have ongoing debt and fiscal issues (Portugal, Argentina, etc) which can have a viral affect into world markets.

YTD returns (we are now into the second half of the year, July 2014) reflect a 7% return on the C-Fund and 6% return on the S-Fund.   While this is better than nothing, it is not that great either.   And our TSP row-boat has had to ride thru a lot of storms and waves on the way to any gains.   This is why I advocate the G-Fund in times of market turbulence.    Yes, it is hard to quantify or establish data to “justify” going to the G-Fund, especially when the market resumes up a week or two later.   However electing to not use the G-Fund as a tool in our tool box would be like electing to not pay home owners insurance, because “I have never had a fire in 20 years.”   The “past data” of no fire history reflects that you probably will not have a fire next year either.   But what if you do ?   Can you recover from that ?   Do you want to try ?  Roll the dice ?   G-Fund is akin to insurance, it is safe-haven in times of market problems and turbulence.   Yes, exiting to G-Fund affects overall percentage gains.   However it is a trade-off for peace of mind (at least for me) versus enduring elevated risk in times of market turmoil.

In summary, I am 50% S-Fund and 50% C-Fund as of now.   Due to the various international problems, I am refraining from investing in I-Fund at the present time.  We need to keep an eye on things, as the current bull market may be topping out, with a new bear market possible in the months ahead.   At the end of the day, nobody can predict or crystal ball things, and we must react to the market itself.

Thanks for reading and talk to you soon.   Please continue to share my site with friends and colleagues.  Have a great weekend everybody…..

Bill Pritchard


June 29 Update / TSP Allocation 100% S-Fund

Hello Everybody

This update will be brief, many of you are out next week due to the July 4th holiday…by the time you come back and check your emails, this will be buried at the bottom of the inbox.   With that said:

I remain 100% S-Fund, as that fund, representing small-cap stocks, reflects the top performer currently.   Second runner-up is the C-Fund, representing large-cap stocks and the SP 500 Index.   Folks who are 50%/50% S and C-Fund have a fine allocation, nothing wrong with that.

At the present time, I see no “red flags” or “warning signs” by any of my proprietary indicators to indicate problems ahead.

Iraq tensions remain, however open-source media seems to paint a stabilizing picture in the region.   Time will tell, however crude oil prices have come down somewhat, to $105 a barrel, off their Iraq-panic highs of $107.   If we could get crude below $105 and even miraculously to $103, that would be great.  Ukraine/Russia continues to be an issue, although I have lost track on what “cease fire” or “agreement to pull troops back” we are on now and quite frankly have grown bored with that situation.

I-Fund lags all the other funds, not a surprise due to its international nature and various international markets suffering due to perceived risks and problems.   One interesting development is a deadline of June 30 for Argentina to pay back $1.3B worth of debt it owes to bondholders.   If that date passes, they have an additional 30 days (the way I understand it) to reach a solution (probably August 1) with bondholders or the various credit ratings will consider Argentina in “default” status and downgrade its credit worthiness rating.   This will likely kill Argentina stock markets and may affect ours, temporarily.   Based on my research, most large USA investors in Argentina have bailed out by now, as Argentina is a “we heard this song before” situation.   In the end, speculating how it will affect US markets is playing crystal-ball, and mine never seems to work.   The financial media has not (not really) talked about this story extensively, but I expect it to pick up some traction in mid-July.

Note that the US markets close on July 3 at 1PM Eastern Time, and are closed entirely July 4.   Expect low volumes this week, and any “down moves” are really nothing to loose sleep over, unless on huge volume.   Most market players will be out of the action by Tuesday afternoon, as they (or their drivers) drive east to the Hamptons for the long weekend.

I promised to keep this update short, I get to typing and tend to ramble, my apologies.  

Please continue to share this site with your friends and coworkers, the “stickiest” marketing is word of mouth referrals, from you, to the next guy.   This site has grown tremendously in a short time, and this is largely a result of your referrals.   Thank You and if you believe this site continues to add value to your financial situation and enhance your knowledge of the TSP and markets, please share it with the next person.    I have chosen to not get too wrapped up with pumping out Twitter feeds, Facebook, Google+, etc. etc., and instead focus on delivering a quality, simple to understand, product, to you.  That formula seems to work.  Ultimately, this is your site, designed to benefit you, the TSP participant and other market investors who desire to improve their knowledge and performance.

My TSP Allocation remains 100% S-Fund.

Everybody have a great July 4 holiday !   

– Bill Pritchard