Hello Folks
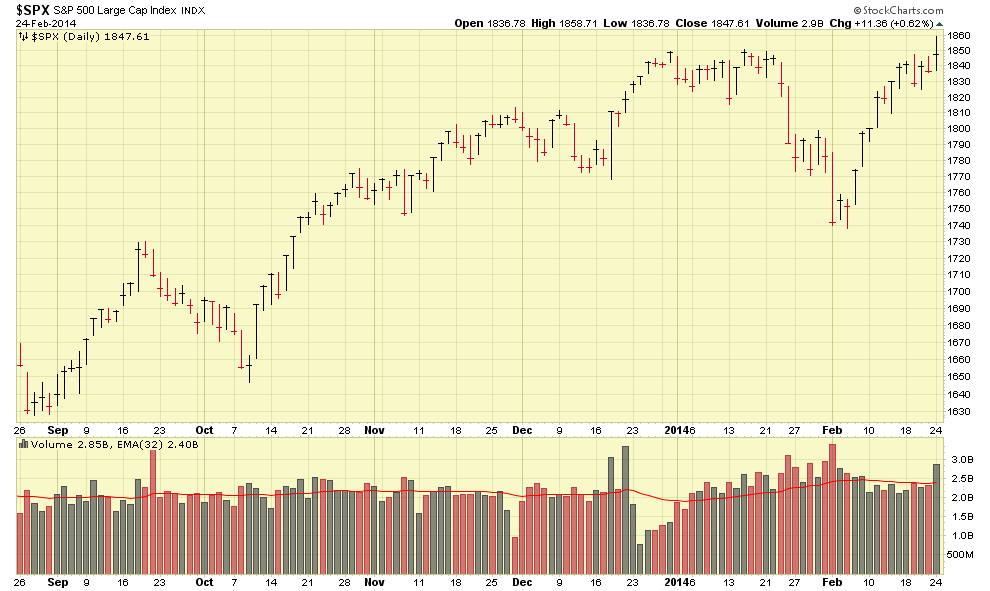
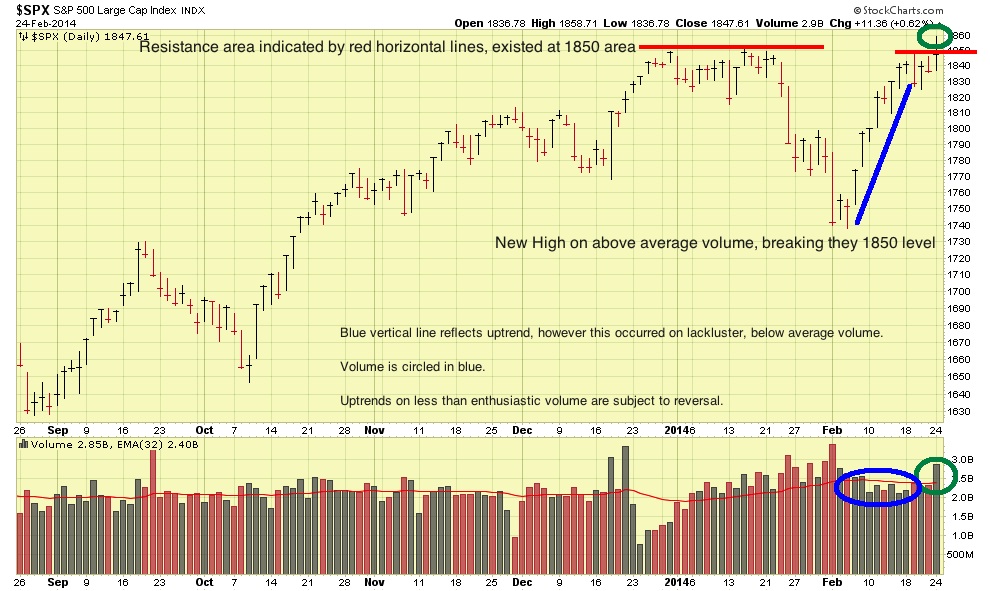
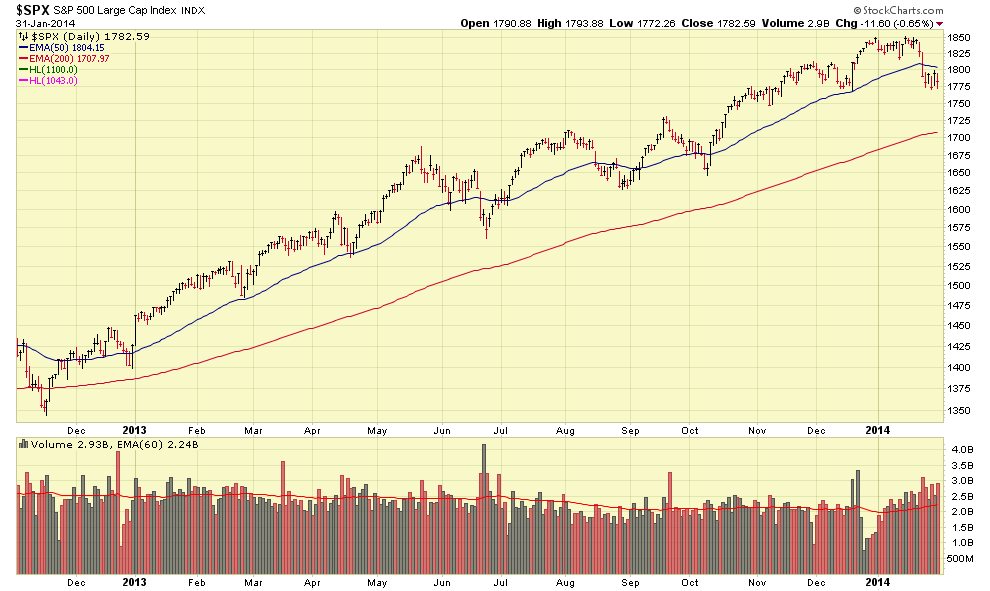
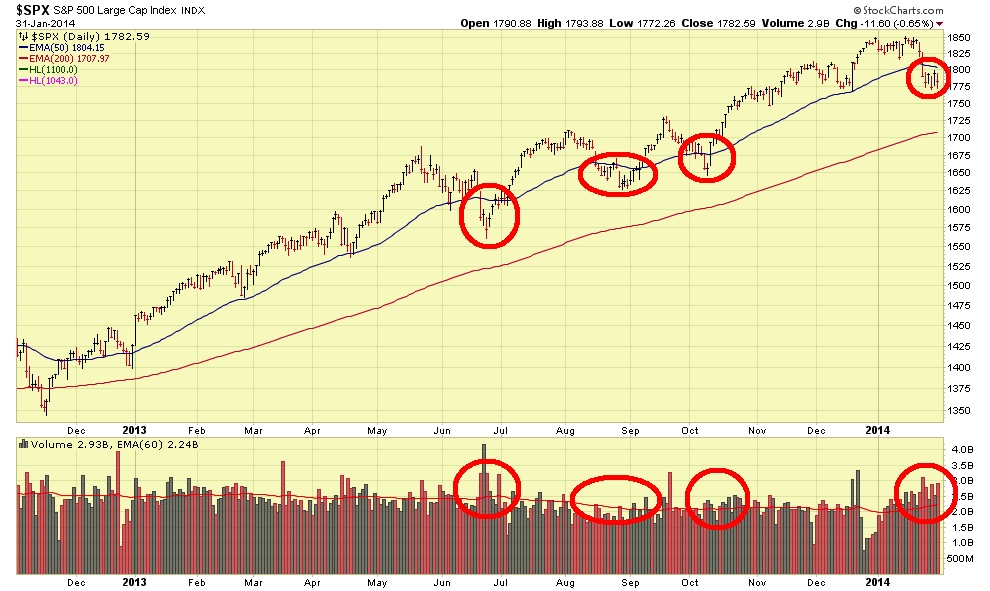
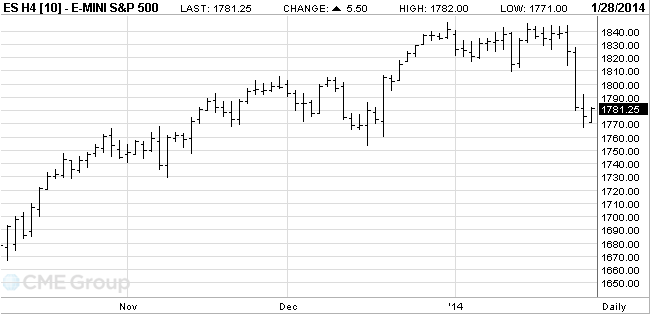
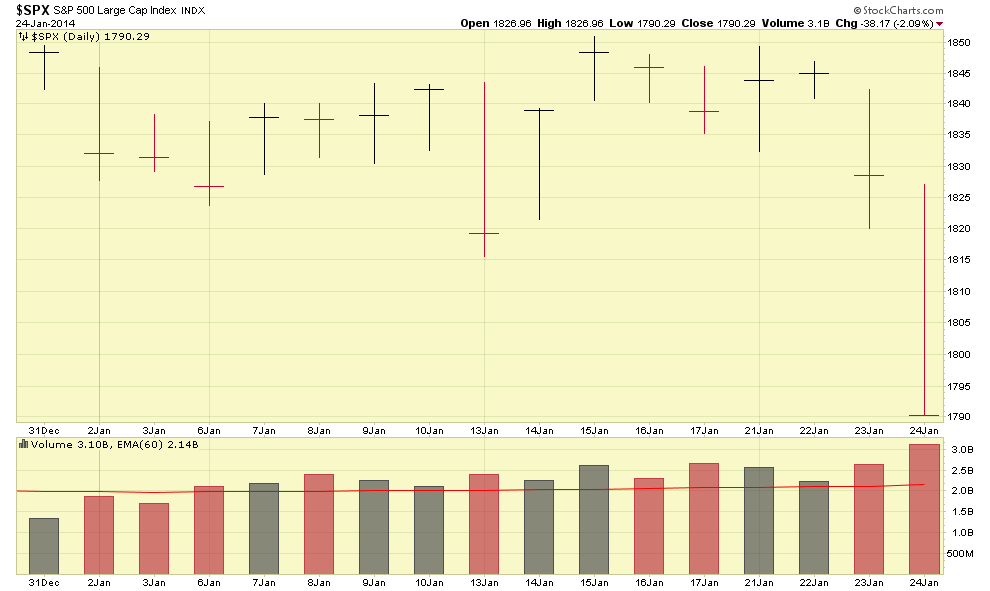
Hope everyone is doing well. The last few weeks in the markets have been rather unexciting. It seems that our SP 500 uptrend has paused, after making yet another All Time High on March 7, hitting 1883.67. It then fell into a trading range between basically 1840 and 1880 since that date. This back and forth trading has been on below average volume, indicating a lack of conviction by the market in any certain direction, not up, and not down. With that said, 1840 is a level we do not want to go below. Let’s take a look at the SP 500 chart, one with no comments and one with:


One item of interest, and possible explanation of the prior low volumes (remember we must react to the market itself, and avoid playing crystal ball or over-analyzing the “why”), is the Russian/Ukraine situation, which began late February but has dragged on until present. Another item of interest was the March 19 speech by Federal Reserve Chair Janet Yellen, in which her remarks appear to indicate a hike in interest rates by Spring 2015. One should observe that this was her first speech, so any remarks must be taken with a grain of salt, as the original intent of the message may have missed its mark or otherwise lost.
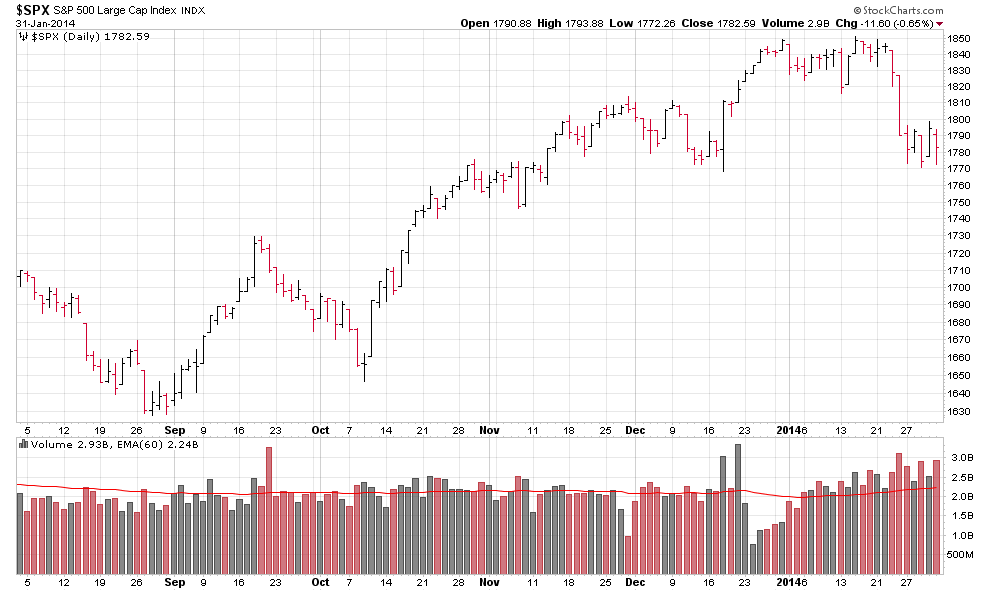
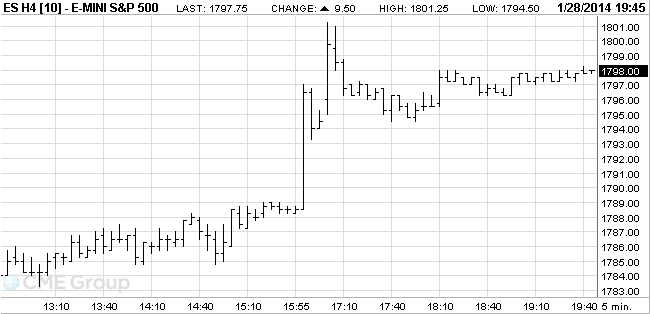
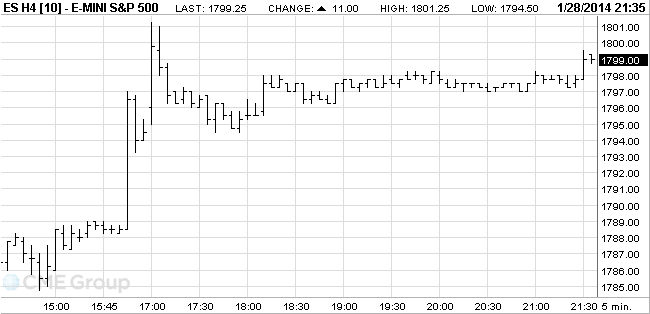
Overnight March 19 SP 500 futures did not drop precipitously…they did come down somewhat but nothing crazy, and did not trade lower than the prior trading session. See chart:

March 20 daytime market trading may be lower on the indexes due to the Yellen speech, but I think this will be digested quickly and the markets will (hopefully) return into an uptrend in the next week or two.
I would not be surprised if rates do go up, as our economy continues to recover and improve. My own “sector”, aviation, is seeing a rebound in aircraft orders and sales, both from a private aviation standpoint and commercial / airliner standpoint. Aviation is very sensitive to the economy (all though an airline is very hard to “kill”), as the slightest increase in expenses coupled with the slightest decrease in corporate earnings, results in the shareholders ordering the corporate jet to be sold. My point is, when you see aviation improving, that is a good barometer for the economy. I think we are “past” the worry and uncertainty about rising interest rates, most market players have accepted that it will happen, and I feel that this is mostly “priced into” the market at this point, temporary market drops or hiccups aside.
I had a reader e-mail me a good question recently, allow me to answer a paraphrased version here, as these posts/updates get much better viewership than my FAQ page gets:
Q: Why do you use the SP 500 index to gage the market’s health if the S-Fund (which you are invested in) is small cap stocks versus SP 500 large cap stocks ?
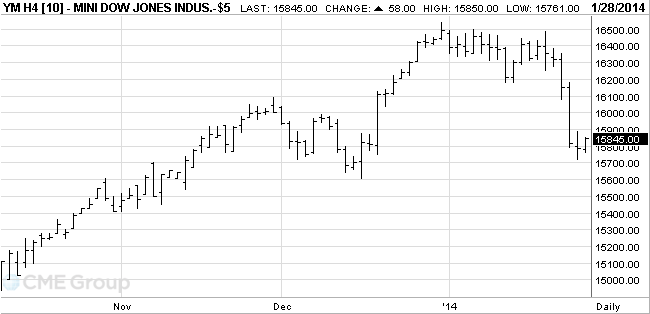
A: That is a great question. The SP 500 is my overall, general purpose, market-health indicator, as America’s largest companies are members of that index. When 500 of corporate America’s largest company stocks, many of which typically have exposure internationally also, are performing well, it is a better indicator than the Dow Jones Index (only 30 companies) or the NASDAQ (largely tech related companies or small cap stocks). With that said, I do cross-compare the various funds and analyze each fund’s health at any given time of the week, month, and/or quarter. However, of all the indexes, I have found the SP 500 to be the best indicator regarding stock market health.
With that said, the S-Fund continues to be the top performer, the C-Fund is next, and the I-Fund is last, largely due to its international nature and various pockets of tension and worry flaring up around the globe and thus affecting the I-Fund’s performance.
My current TSP Allocation remains 100% S-Fund. In addition, I see no “red flags” in the market’s recent past behavior. This of course can change. Indeed, some concern and worry exists regarding Ms. Yellen’s remarks and some tension around the globe. However I feel we will overcome this and I am optimistic the uptrend will resume.
Thank you for reading. Thank you for the great emails and requests, ideas, etc on what material is more important to the audience versus not important. Some of my charts and lingo can sound like Greek, yes I know. This site is for you and I seek to continue to improve the site material, and increase the subscriber base and viewership. It is pretty cool when you travel away from your home-base, and meet other professional colleagues, who ask “are you the same guy” with “that TSP site we all follow.” What a great vote of confidence, hearing things like that. Thank You.
If you find this site informative, please share it with your friends and coworkers.
Talk to you soon…
– Bill Pritchard