Category Archives: Uncategorized

Happy New Year message

Just a quick message to wish everyone a Happy New Year, as in less than 48 hours, we will be welcoming in 2014, and saying goodbye to 2013.    A very brief recap of the past few days action reflect that a new high was made on the SP-500 on Dec 27, 2013, attaining 1844.89 on the index.

The last few days have been on low volume, however I am always receptive to new highs on indexes, low volume or not.   Also, the I-Fund has flashed some strength, and the top funds, performance-wise, have been I-Fund and S-Fund over the past five days.

Allow me to say THANK  YOU to all of my loyal subscribers, for the great comments and words of support regarding this site.    While I do not claim to have a crystal ball or be able to guarantee performance returns, if this site has stimulated some proactive TSP management, and improved some folks returns, than I have accomplished a lot.   This site has seen huge subscriber growth in 2013, and this is largely due to word of mouth from the subscriber base.  One of my wishes for 2014 is further growth of my subscriber base, and the only way to accomplish this is via me, delivering a quality product to the subscriber, who in turn will refer this site to others.

Everybody have a safe holiday…from my family to your family:  Happy New Year. 

– Bill Pritchard


Dec 22 Update/ Merry Christmas Message

This past week in the markets was very good, with the S-Fund outperforming all funds, and C-Fund taking second place.     There are no indications that this performance will change anytime soon.   As we enter Christmas week, trading will be light, as the U.S. securities markets will be closed at noon CT on Tuesday, Dec. 24, closed on Wednesday, Dec. 25 for Christmas and closed on Jan. 1 2014 for New Years.  I personally don’t see any huge market volume or activity coming back until Monday, January 6, 2014.   In other words, December’s action, for all intents and purposes, is “over.”

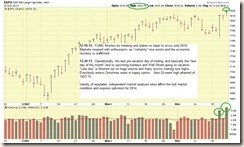
On Friday, Dec 20, the SP 500 index closed up on huge volume, hitting a new 52 week high of 1823.75.  See Chart:

SP-500-12-22-13-comments

As reported in my November 5, 2013 post, December is historically the best performing month out of the year, and while it got off to a rough start, I am quite pleased on how things have turned out (again, December is basically done now, trading-wise).   

It should be noted that on Sunday, Dec 22, the International Monetary Fund (IMF) made news by stating that it believes that the US economy is expanding faster than previously thought, and expressed a positive outlook for 2014.   This news was via statements by IMF Director Lagarde, and not in the form of an official press release/etc.   However, this has the potential of lifting the markets even further.   Readers will recall my prior hospital patient analogy, regarding the recovering US economy, and not shocking is the fact that we are starting to see independent reports and data confirm my prior statements.  I had the pleasure of eating breakfast recently with a Regional VP (for my geographic area) of a major US shipping company (I won’t name it but they paint everything one color).  This person reports directly to the HQ in USA.  Sometimes field interviews are much better than fancy reports, charts, and economic theories, and being on the street is where you see what is really happening.  I asked him “how did 2013 work out” and “are things coming back, from your point of view” and his response was overwhelmingly a “yes.”    

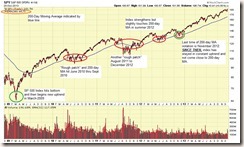
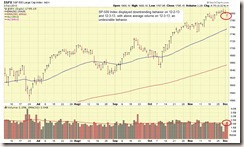
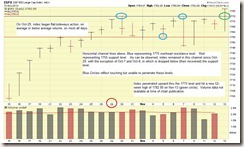
I have had some great reader mails, thank you, and a few have asked the legit question “is the market’s run is almost over.”   This is based on the observation that the SP-500 Index has been in an uptrend since basically 2009.   While true, it has only really taken off since November 2012.   I base my opinion, on two things, the use of the 200-day Moving Average as a trend signal, and the price of gold.   The financial industry typically views a penetration or “touching” of the 200-day MA as being a bearish signal, reflecting that the market/index is not fully healthy.   As my chart (with comments) below shows, not until 2013, did the index NOT touch the 200-day MA the entire year.   See chart:

SP-500-200day-comments

In addition, I use the price of Gold as a secondary indicator (remember, the market itself is #1 indicator) as to how things are playing out.  Gold, is the “safe haven” for major market players in times of economic turmoil, war, or when fear is in the air.   Money is believed by some (me included) to be like fluids, and when fluid flows from one “container” (Gold, Bonds, Stocks, etc.) this means that it must flow to another container.   Students of fluid dynamics and system dynamics believe that one component of a system affects other components, similar to a heart which determines how fast your legs can run.  The heart may be more important than your leg muscle, and both need each other for a successful run.  With that said, many believe that money (fluid) leaves Gold when equities/stock markets are recovering, and further invests in stocks, thus sending them higher, and when stocks are doing bad, money goes elsewhere, to other investments such as Gold.  Gold is also important as it is the “default” currency, worldwide. 

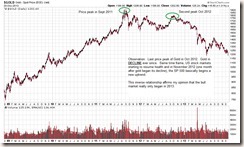
The last major price peak of Gold occurred in October, 2012, and its price has been on a decline since, reflecting money outflows, and inflows into something else.  Note that since 2009 until October 2012, while the markets, yes, were up, Gold, also, was up, indicating that the world was not quite ready to dive head first into the stock markets.  In addition, 2009 up until Nov 2012, the SP 500 index had a couple of “rough patches” and violated the 200-day MA.    See Gold chart:

GOLD-comments

However this apparently changed in November 2012 (one month after the peak in Gold prices), as this was the start of a new uptrend in the SP 500 index, and in January 2013, after assessing the November and December behavior, and post-Fiscal Cliff resolution, I made the decision to return to the S-Fund.   Many of my readers have mirrored my TSP moves, and we all enjoyed a great 2013.   It is my opinion that the current bull market only “really” began in November 2012, and that 2014 is likely going to be a good year.

My TSP Allocation remains 50% S-Fund and 50% C-Fund.   I hope everyone has a Merry Christmas and Happy New Year, and I will see everybody after the holidays.  Thanks

– Bill Pritchard

Dec 19 Update / Taper to occur in 2014 / Markets like Certainty

Hello folks

Well, to say that Dec 18 was a “good day” in the markets would be an understatement.   The FOMC released a statement, after having met on Dec 17 and 18, and said that they plan to start a very gradual tapering of QE in January of 2014.   Note that this is mostly in line with my Dec 10 update on this site, in which I stated that the FOMC would “take no action” on QE until 2014.   My opinion was somewhat correct, but not completely, as the “action” they took was the decision to start the taper.   However the actual taper will begin in 2014.   2013 will finish out unchanged and with no tapering activity.

The Dow Jones reacted with a gain of 292 points, and some sites (I have not personally done the math on it) reported that any and all losses in the markets in December, were reversed, in today’s strong action.   The SPY tracking stock, which mirrors the SP 500, traded 50% above its average volume, clearly a strong sign of credibility behind the move upward today.   This reflects that institutional money returned to the markets today, in large numbers.

The Washington Post published an opinion piece today, in which they basically repeated what I already told my subscribers in Point #4 of my December 10 post, regarding my position that the economy is indeed recovering.   Allow me to pat myself on the back and state that my subscribers received basically the same analysis eight days ago.

Small cap stocks (S-Fund) responded well, and outperformed everything else today, with large cap stocks (C-Fund), taking second place, and international stocks (I-Fund) taking third place, in daily performance.   This market reaction is in accordance with my existing TSP Allocation.  The TSP funds which gained the most, one-day, on Dec 18, were not the L-Funds, G-Fund, F-Fund, etc, but S-Fund, and C-Fund.   Readers may note that my personal TSP Allocation has been 50% S-Fund and 50% C-Fund.

Readers may recall my Sept 10 post, in which I stated that markets do not like uncertainty on important issues.   The reduction of QE, a federally driven program, and impacting world financial markets, is clearly in this category.  However for a large part of 2013, the markets have been handicapped by this fog of uncertainty, and in recent months, have displayed difficulty navigating higher thru this fog.   Not shockingly, when the FOMC made its position known today (with no taper action until 2014), the markets swallowed this like a hungry animal.   The modest taper (versus a more aggressive taper) likely contributed to this, which was basically the FOMC saying “We are tapering, but…”   Note that if the taper was more aggressive, my position remains that the market would have received this as negative news.   Instead, the FOMC decided it was time to leave the kiddie pool (ankle-deep) and move to knee-deep water.     In what appears to be a sound decision, the FOMC has decided that the diving-board deep side of the pool is not something the economy is ready for yet.

In other news, reports on new home construction reflect that in November 2013, more new homes have been built, that at any other time in the prior 5 years.   This added additional propellant to the rally.

I have no cool charts or graphics today, as my TDY internet wi-fi (thank you Residence Inn) is extremely slow.

In summary, today’s events are very positive and I am very optimistic for things in the near future.   Lets see how December finishes out.   Expect some naysayers to come out of the woodwork and some slight sell offs in the next few weeks.   However you don’t go up 292 points in one day, for no reason.     My current TSP Allocation remains 50% S-Fund and 50% C-Fund. 

Thanks for reading and talk to you soon…….Bill Pritchard

Dec. 10 Update / Market has regained some of last week’s losses / Budget Deal passed

Hello folks

I am happy to report that so far this week (all two days of it), the SP 500 index has regained some of last week’s lost territory, and on December 9, came close to hitting its most recent 52-week high, 1813.55, which was hit on November 29.   The “1800 to 1810” area appears to be the most recent obstacle course, as anytime the index enters that territory, it gets dragged down and sent back lower.   My opinion is that if the index can clear and remain above 1810 for multiple sessions, this may open up the highway ahead for additional gains and new higher territory.

The market is likely concerned over the December 17-18 Federal Reserve meeting, in which (yet again) some believe a reduction of the QE program will be discussed or decided on.   Additionally, some nervousness existed regarding the lack of a budget deal, however this should be subsided going forward now that a budget deal was agreed to this evening, as reported by the Washington Post.  The article reports that the federal government is now funded thru the fall of 2015.  The article also reports that the two-year slide in federal spending is “reversed.”   

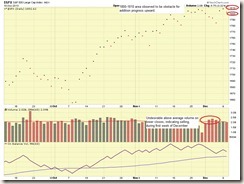
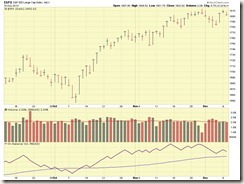
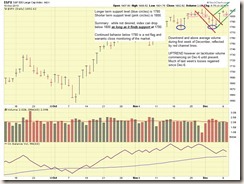
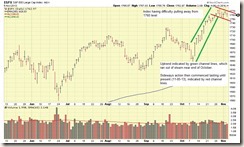
The SP-500 futures responded positively to this news, then traded flat for the remainder of the evening session.   Lets take a look at some charts to assess how the market is doing.   The first chart is “close only” chart, in other words, it shows only the closing level of the SP-500 index each day.  This is helpful to see thru the daily noise and volatility as the “close” is the point everybody went home at.  The next charts depict the normal daily trading, with the full day’s price activity displayed.   Observe that the first week of December reflected selling, based on lower closes and above average volume.   This is clearly not desired and is a “warning sign” that I look for, regarding possible new Bear markets / downtrends.  

SP-500-12-10-13-CLOSEONLY-COMMENTS

Normal, unmarked SP-500 Chart, for review, prior to third chart, which is same chart but with my comments/annotations:

SP-500-12-10-13-HLCBARS-jpeg

Same chart, with my comments/etc.

SP-500-12-10-13-HLCBARS-COMMENTS

Please send me a reader e-mail if my charts are confusing or seem like voodoo. 

Observe that this week, volume has been less than average (so far), likely due to people staying on the sidelines in light of budget uncertainty (resolved this evening) and the Dec 17-18 Federal Reserve meeting.

Being that a reduction in QE will almost certainly impact the markets, in a negative manner (for how long, is not known), my “take” on this, is that the Federal Reserve will not take any action regarding the QE program during this meeting (they will likely address it early 2014), because:

1.  Congress is on Christmas break Dec-13 to Jan-7  2014.   I doubt any decisions (and subsequent announcements by FOMC) regarding a critical economic program will be announced by Obama/FOMC/etc. while Congress is out of the office.  Some of the members of the Senate and House banking/finance committees would likely desire to be cc’ed and/or participate in any such news announcements, and they will be on break.

2.  Any such news will be initially received as negative and a sell-off in the markets will likely occur.  The private citizen aka voter, who is making holiday preparations and putting up his Christmas tree, does not want his holiday period ruined.  As such, I doubt the FOMC will be looking to drop bombshells over the holidays.   NOTE:  The FOMC is not “elected” by voters, however any bad news will be attributed/associated to the political party/politicians in office.  The FOMC Chairman is nominated by the President.   

3.  And, 2013 has been a tough year, in the politics category.   Between sequestration, fiscal cliffs, furloughs, closed government offices, locked down National Parks, etc., the private citizen just doesn’t need yet another stick in his eye this year from Washington.    I am sure the Washington consensus is “lets get 2013 over with” and then this will be acted upon in 2014.

4. Any QE reduction announcements, when declared, will have some sort of economic stimulus or similar policy attached, to “soften” the blow to the markets.  Remember, QE reduction is because the economy is recovering.   And what does the voter care about ?  Jobs.   Employed people buy products, houses, make investments, and stimulate things.   Unemployed ones do not.   I anticipate some sort of new incentive regarding additional, further job creation or worker benefits to be announced when the QE reduction announcement is made.  This, in theory, will stimulate the economy even more, and help soften any hard drops the market may have on QE reduction news alone.  Also, the administration may be sitting on already existing good news or data and is waiting to “package it” with the QE announcement.

All funds are performing close to each other, and my personal TSP Allocation remains 50% S-Fund and 50% C-Fund. 

Thanks for reading, and please forward this update to your coworkers or colleagues that may find it interesting.    Thanks.

– Bill Pritchard

December 3 2013 Update / New Edition of FERS Guide Released / Market jitters Return

Hello folks

I hope everybody returned from the Thanksgiving holidays safely.   We are now into the month of December, and unfortunately the markets have started the month on a weak note, closing down on both Dec-2 (Monday) and Dec-3 (Tuesday).  Rudolf’s pleasant  jingle bells (does he have jingle bells ?) and Santa’s jolly laugh have failed to start.  Maybe it is too early yet.  Typically the first day of the month “sets the tone” for the rest of the month, so I am going to ask Santa to bring us some Holiday Cheer, if I can find him at the mall.

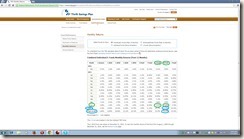
The SP 500 Index has departed the magical 1800 area, to the downside, and recent support is found at approximately the 1790 area.   In other words, any behavior below that is undesirable.  Today, Dec-3, the index displayed above average volume, while closing down, a “red flag” but not reason for total panic.   If we get multiple days like this in close proximity to each other, it may be a G-Fund Christmas instead of a white Christmas.   But lets standby for now and take a look at November’s TSP returns.  See image below:

TSP-RETURNS-NOV13

As can be seen, the C-Fund (#1 monthly performer) out powered the S-Fund (#2 performer) in November.   However, YTD and Last 12 months, S-Fund is still the leader in performance.   Since October until present, C-Fund and S-Fund have been running close to each other, and my TSP Allocation is 50% S-Fund and 50% C-Fund at the present time.   I will advise anyone if this changes.  Out of ten fund choices, my system has put me into the top performer almost the entire year, and when not in the #1 performer, it was in the #2 performer.   So all year its been Walter Payton or Tony Dorsett.   Either one on your team and you are with a winner.    Note that I was in G-Fund for short bursts during the year, due some red flags (since proved false alarms) to my admitted fear of market crashes and account balance wipe-outs.  

Once again, I watch the market itself, for signals and red flags, and respond to those signals, and hesitate to speculate on reasons behind the moves.   With that standard disclaimer, it is my opinion that the fears of a reduction of the Quantitative Easing (QE) program are back in the air.

Also, the recent reports of Black Friday Sales being less than last year’s, have sent fear into the market.   Some Wall Street folks however might take note that while Black Friday was worse than last years, the folks who did not go to physical stores (Black Friday data is based on that) to shop, instead spent time on Amazon and other sites, ordering items.  One might observe that NetFlix basically put Blockbuster’s physical stores (and the company) out of business, when folks could stay home and save gas and avoid driving to Blockbuster only to find that their favorite movie was out of stock anyway.   Amazon (a few years ago it was mostly books) is credited with putting Borders Books out of business, and is presently giving my personal favorite hang-out spot, Barnes and Noble, a lot of heartburn.   Amazon (and other online retailers) are now challenging other old-school stores.   Unless you just want to get an Orange Julius or an Aunt Annie’s pretzel, why would anyone drive to the mall, burn gas ($4 a gallon), fight the crowds, park the car one mile away, only to find out that Grandma’s sweater size is not in stock.    I don’t.   Both last year and this year, I accomplished all of my Christmas shopping, to include physical gift wrapping, for my family and relatives, in multiple areas of USA, in one day, while in my pajamas.   Yes, that means it is December 3, and I am already done with shopping.  Any shipping costs (typically free if you order a minimal dollar amount) or sales tax that I had to pay more than offset the high PITA Factor (Pain In the A** Factor) involved with shopping for Christmas.  Note that most of the items were priced less than the same item in the actual physical stores.    I mean, I didn’t even have to get dressed, much less, leave the house.  Thank you Jeff Bezos.

With that said, ok, Black Friday’s numbers were low.   Is the world ending ?   Many “bears” on Wall Street would like to claim that.   We are all trained investigators, what do you think ?  

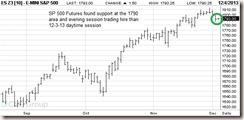
Lets take a look at the most recent SP 500 Chart (first image).   I realize we are only two trading days into December, but I wanted to post it anyway.   Observe that today the index closed lower (QE Fears and poor Black Friday / Aunt Annie numbers ?) on above average volume.    Which is undesirable.    Also, it is noteworthy that the evening SP 500 futures (white colored chart below) are trading up, and “found support” in the 1790 area, at least as of 9PM Central Time.   In other words, the low’s of the daytime session (which coincides with the daytime stock exchange session) were not violated, and the index is trading much improved during the evening session.    Charts/Images:

SP-500-12-03-13-comments

SP500-futures-12-3-13-comments

As a wrap-up, please FYI that Dan Jamison, of the FERS Guide, is retiring from federal law enforcement service after 21 years, effective Dec-4 2013.  Not surprisingly, he will utilize his extensive retirement planning knowledge in his retirement career.   Today, he released his most recent guide, which is posted under the FERS Guide link on this site.   Dan produced and authored all material himself.

Thank you for reading and if you find this site informative or useful, please share it with your friends and coworkers.     Thanks and talk to you soon.

– Bill Pritchard

TSP Allocation / November 25 2013 Update / Reader Mail / TSP Millionaire Club / Market Bears / Thanksgiving trading

Good Evening Folks

I wanted to send out an update before a lot of my audience goes out on leave / steps away from their computers during Thanksgiving week…  Some interesting topics are covered in this update, and I promise that you won’t be bored (or puzzled by over-technical terminology, which I have always sought to avoid).

I have received some great reader emails over the last week or so, thank you for the positive comments.   One common question remains “when you change your current TSP allocation, what do you mean by that”.   I ask that if you have that question, please take a look at the FAQ #10, as it is discussed there.  

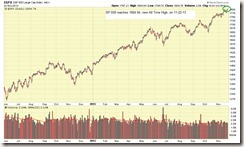
A review of recent trading activity on the SP 500, which is my personal “go-to” index for market health and analysis, shows that the index made yet another All Time High on November 22, 2013, reaching 1804.84.   See chart below:
SP500-11-24-13-comments

The new highs during recent days have been on lackluster volume, which is the only negative in an otherwise positive situation.   As I have explained in prior posts, volume is the “horsepower” behind a price move…we ideally want new highs to be made on average to (more preferred) above average volume.   However, I will take new highs, if that’s all I can get.   The prior week’s trading reflects that small-cap stocks (S-Fund) outperformed large caps, however a longer look-back reflect that large-caps (C-Fund) are still outperforming on a two to four week view.   Simple version, my current TSP Allocation of 50% S-Fund and 50% C-Fund is probably the most ideal allocation right now.

I wanted to post a 2013 article from Federal News Radio, regarding a reader letter (to Federal News Radio), from a member of the TSP Millionaires club.   As most of my subscribership knows, I feel that the G-Fund is best for safety and protection, not for gains.  I also feel that it is wise to move to G-Fund when the market itself (not somebody’s crystal ball) signals possible trouble ahead.   With that diatribe over, allow me to post a link, and cut and paste (in italics) portions of the article.   Article is property of Federal News Radio and is not mine.

http://www.federalnewsradio.com/20/3458095/Federal-TSP-millionaire-tells-how-to-join-the-club

“…I am one of the 929 TSP millionaires mentioned in your column. Not born with a silver spoon in my mouth either, for growing up, my family never even had a car. I’m 58 years old and have over $1 million in the TSP, beginning with contributions 25 years ago. Attached is a plot showing how it happened, by putting the maximum amount available (although past 50, due to other financial obligations I did not even add the catch-up available for 50+). I did make sound investments with timing, for I made double-digit growth extraordinaire during the booms, and was fortunate to avoid the busts by moving it temporarily to the G fund. I have some advice that I think you should offer the young bloods out there joining the federal government and that they must contribute their maximum amount to the TSP. That is rule #1.

There you go folks, someone independent of this site with a similar opinion regarding the G-Fund.   You know my opinions regarding buy-and-hold, versus the usage of the other funds as tactical protection vehicles.   Some other sites have differing views on topics such as Buy and Hold, the use of the G-Fund, and other stuff.  Welcome to America, we all can have a voice.   But read the TSP Millionaire’s letter, to another very reputable site, and make your own decision on what works and what doesn’t.   If folks want to Buy-and-Hope Hold during bear markets such as 2000-2002 or 2007-2009, hey good luck, just don’t take your buddies with you.

As a transition to that, I noticed in the media some Market Bears coming out of the woods.   As many know, a “Bear” is someone who believes the market will be going down soon (“soon” never being clearly defined) and that doomsday is around the corner.  Allow me to post some links

Goldman Sachs predicts 10% drop in SP 500  This is an interesting article, you have to love the folks who stick their neck outs a little bit, but not too much, as they can claim “being right” if they indeed get their predictions accidently correct, and if they are wrong, well no big deal, they weren’t predicting anything huge anyway.    Kind of like that guy at work, who we all know, who silently applied for a promotion, and when prompted by a colleague, his response is “I am not expecting it, I doubt I will be pulled away from (insert name of incredibly important project here) that I am working on” or similar statement.   I mean, if he is not promoted, this guy is “right” and can take credit for his accurate prediction.   If he is wrong, well, he gets promoted and tells everyone how “shocked” he was.   Bro, come on.    The better answer is “Yeah Larry, I applied, lets see what shakes out.”

Market may Tank  An entertaining article with interesting adjectives to include the word “overstretched” and stones going over cliffs.   Yet another mention in the press of “the economic cycle.”    Do ANY of these authors understand that the stock market is a LEADING INDICATOR of the economic cycle ?   If you WAIT for the economic cycle to become healthy/reflect healthiness, and THEN invest in stocks, you will be buying very likely as the market’s fuel tank is about to hit empty and come to a halt.   No wonder (unfortunately) most of the public cannot amp-up their returns, it’s not their fault, it is the fault of the media and the “experts” out there.   In the “don’t take my word for it” (TSP Millionaire letter is also in that category) category, lets link over to New York’s Stern Business school.

 The current index of leading indicators (it changes from time to time) combines the following series:

Leading Indicators

1. Hours of production workers in manufacturing

5. New claims for unemployment insurance

8. Value of new orders for consumer goods

19. S&P 500 Composite Stock Index

Doomsday Investors – Market may Crash  May 24 2013 article claiming market will crash.  Posted on CNN Money, with who knows how many millions of viewers.   I have no data regarding how many grandmothers cashed out their E-Trade account after reading this article.  I hope not many.   May 24 2013 SP 500 close was 1650.51.   Nov 22 2013 SP 500 close was 1804.76, reflecting a gain of approximately +9.3 %

So there you go folks, while I can’t tell anybody to completely stop reading market news (and yes, I watch CNBC, read WSJ, etc.), I ask that you exercise some skepticism when you listen to purported experts or read things (and yes this includes this site.   Put that in the “refreshingly honest” category).    Take everything with a grain of salt and at the end of the day, do what makes you feel most comfortable.

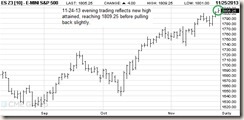
With that said, a quick Nov-24 evening look at the SP 500 futures reflect yet another new high on that index (the futures index).   See chart below
SP-500-future-11-24-13-comments

As can be seen, the SP 500 futures index hit 1809.25, before pulling back slightly.  While my crystal ball is still inop, my opinion is that this is possibly a positive response to the recent Iran/USA nuclear agreement signed over the weekend, which is apparently not a final-final agreement but a “first step” towards a larger agreement.  Crude Oil futures went lower as a result, and everybody likes cheaper gasoline for Holiday Travel (whether this will show up at the pump is yet to be seen).   However, any stability (perceived or not, perception is reality) in the middle east, especially regarding OPEC members and countries with nuclear capability, is likely a positive for the markets.  SP-500 Sunday evening futures typically are a reliable indication of how the Monday daytime trading on the stock exchanges will be.

During this upcoming Thanksgiving week, trading will be very light (markets are closed on Thanksgiving day) and as such, any behavior in the markets this week will not be genuine signals of anything important.   Expect light back-and-forth, mostly flat trading.

In closing, my personal TSP Allocation remains 50% S-Fund and 50% C-Fund.   I hope you enjoyed this most recent update, and I ask that you please share this site with your friends and co-workers (my free site’s revenue stream [zero] cannot afford advertisements in the Wall Street Journal).   

Everybody have a GREAT THANKSGIVING and talk to you soon.  Remember, one day of defrost per 5 pounds of frozen turkey.   Know that now or deal with a divorce attorney later.   Been there, done that…..  

– Bill Pritchard

November 13 2013 Update / New 52 week high for SP 500 established / TSP Allocation change


Hello everybody

On todays date, Nov-13, the SP 500 made a new 52 week high of 1782.00, and penetrated the previous 1775 overhead resistance level, which has existed since approximately Oct-29.   Since Oct-29, until today, the index has frustratingly remained within a narrow 1755-1775 channel, ping-ponging back and forth between those levels.  Today’s volume was average and nothing earth shattering, which is a disappointment in light of the new 52 week high.  I prefer to see volume 25% or more, above and beyond the average daily trading volume, to really give me a solid feeling of confidence.  The lack of volume is reflective that the new high may not be sustainable and the index may drift back down again.  However “new 52 week highs” flashing across the headlines will stimulate optimism and lift people’s spirits, and possibly encourage more investing, so nothing wrong with that.  Investors Business Daily newspaper, which is very credible and one of the tools in my toolbox, after observing today’s new high, has advised subscribers that the “uptrend continues.”

Let’s take a look at the chart below:

SP-500-11-13-13-comments

As far as the overall broader markets are concerned, today small cap stocks (represented by the S-Fund) outperformed all other stocks, with large caps stocks coming into second place (represented by the C-Fund).   Emerging markets are on their 10th day of declines and this may be indicative of money out-flows leaving emerging markets and going somewhere else.  Emerging markets are not represented by the I-Fund, which instead represents developed markets, but both have an international nexus, and most international indexes act in parallel fashion.  As such,the I-Fund is underperforming, over the last couple of weeks.

Note:  Anytime a stock or index goes down, it is because the supply/demand ratio of share volume reflects more selling than buying.   So for whatever reason, the emerging markets have not done well for the last ten trading days.

One “roadblock” acting on the markets is the yet-again concern over QE tapering.   I have discussed my hospital patient analogy numerous times here and once again, it is appropriate.   By most indications (see Secretary Lew comments below for additional) , the economy is coming back, and what happens when we get good economic news ?   People start to worry that the QE life support will stop.  This in my opinion, is a roadblock to a renewed uptrend in the markets.

From a financial/economic news standpoint (as most know, I let the market itself tell me what to do…), we have had some positive news come out in recent days.   While I don’t take news reports as gospel, I like to have a broad grasp on issues facing the economy and understand the overall climate of things.

Treasury Secretary Lew (a political appointee, who may be compelled to “present things” in a certain light…) reported that the US Economy is thriving.   I concur that it is indeed getting better, as equities markets tend to act as a lead indicator on the economy.   And the markets have been on a strong uptrend since January 2013.   Readers may recall (available via search on this site) my earlier “field interviews” and intelligence collection efforts regarding economic activity, and I reached the conclusion earlier in the year that the economy was indeed coming back.   I still feel this way today.    In addition, our friends across the pond at the Bank of England are reporting that the economy in the U.K. is coming back.

In Nov-13 after hours trading, Cisco reported less than stellar financial performance this past quarter, and shares were down 10% in after hours trading.  This is a huge move, as Cisco is a major NASDAQ component and  member of the Dow Jones Index.   Cisco shares (CSCO) may drag those indexes down on Nov-14 trading, which may falsely signal that the “markets are going down”.    This is not the case in this particular example.  Cisco was a internet-boom poster boy stock from the late 90’s, when it more than quadrupled in value.   However today is not 1998 and I am not sure how many people go to Best Buy to buy a Cisco router anymore, to hook to their Windows PC (and then log into AOL) .  In light of competition from other devices, technologies, and companies, such as Huawei , Cisco may be loosing its dominance.

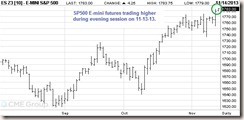
At 10 PM Central Time, the SP 500 futures are trading higher than the day session, apparently ignoring the Cisco news.   Lets hope that the daytime trading on the stock exchanges tomorrow (Nov-14) act accordingly, if yes, we may have a good day in the markets on Nov-14.   See SP 500 futures chart below:

SP-500-FUTURES-11-13-13-comments

As of today Nov-13, my assessment of the markets reflects that the C-Fund has outperformed the S-Fund on a 30-day look-back period, however for a one week period, the S-Fund is resuming it’s strength and coming back.   As already discussed, international markets (I-Fund) are underperforming.  With hard chart data and my performance analysis, I combine documented historical data, which reflects that small cap stocks commonly outperform large caps in the months of November and December, assuming that the overall market is in a positive uptrend / “bull” condition (which it is).   With that said, effective today Nov-13, I have adjusted my TSP Allocation to reflect 50% S-Fund and 50% C-Fund.  This is due to my opinion that this allocation is the “best of both worlds” as we finish out the year, as both large caps and small caps are doing well.    From mid-November forward, trading volumes start to dry up as Wall Street traders and financial professionals start to focus on the holidays and start taking time off.   So basically mid-November forward, you will not see any drastic behavior changes, IE:  one fund suddenly outperforming another one.

In summary:  The SP 500 index hit a new 52 week high today, which is good news, however this was achieved on average volume.  Ideally such moves are on above average volume.  As such, the index may fall back down below its new high.  Effective Nov-13, I am adjusting my TSP Allocation to reflect 50% S-Fund and 50% C-Fund.  It is my opinion that no major red flags exist regarding the markets, but recent average volume levels and stagnation occurring at the 1775 level continues to be a challenge.

As always, thank you for reading, and please encourage your friends and coworkers to subscribe for timely and accurate market analysis and commentary.  Hope everybody has a great rest-of-the-week and talk to you soon.

Thank You

– Bill Pritchard

November 5 2013 Update

Good Evening

We are now 14 trading days past the post-debt ceiling agreement and all the indexes are doing well, for the most part.   I say “most part” because the SP 500 Index has had trouble getting much altitude above the 1760 psychological level, first discussed in my October 25 2013 post.   This sideways action (it is actually a very slight drift downward but in my opinion not a “downtrend” per se…) has commenced on October 29, when the index lost energy and started to go sideways.

See chart, with comments, below:

SP-500-11-05-13-comments

I am not overly concerned, because of two important things:

1.  Historically, November and December are very good months for stock market performance, December being the best month out of the year, and November being the second best, out of the year.    This is backed up by documented and historical data/studies.

2.  The volume on the indexes during these recent sideways days has been mostly below average, indicating that there is money “on the sidelines” waiting for some sort of opportunity to buy stocks, and no major additional buying has occurred by institutional level managers (such as mutual fund managers at Fidelity, USAA, Vanguard, etc.) in recent weeks.  My opinion is also that no significant selling has occurred either, by money already invested in the markets.  

Note that we need buying to stimulate the markets, and propel stocks further upward.  My opinion is the debt ceiling circus left a lot of folks tired and fatigued, and this possibly put a damper on some things.  I have not seen downward price action, on above average volume, which is a red flag.  However we must be vigilant at all times.

The C-Fund and I-Fund ended up outperforming the S-Fund in the month of October, however YTD, the S-Fund is still the top performer.   I am a little skittish on I-Fund (even though it has given some good returns) due to my own admitted weariness with the never-ending fires and problems which seem to be arising internationally.    I will give it one more week and possibly modify my TSP allocation, but at this point folks, these are minor tweaks, as we have grabbed the bulk of the years gains already, and I am sure everybody’s balances reflect that.   In layman’s terms, we have been driving a Shelby Mustang all year long, and have won every race, and now we decided that we need it to go 10 MPH faster on the track, just “because”.    I try to save my TSP movements for bona-fide, justified reasons, versus trying to pick up 1 percent here and there.    I shoot for the long term trend, and I think we all accomplished that this year.  More importantly, is the usage of G-Fund as a protection fund, as if you can mitigate your losses, and allow the gains to run, then that is the difference between stellar performance and lackluster performance. 

Speaking of trends, and the importance to not fight them (also loosely categorized under “don’t buy dips”) is a story which came out regarding hedge fund Axial Capital Management, which had at one point 1.8 Billion dollars under management.  Article and video provided by CNBC.

Axial Capital Video hosted by TheFedTrader.Com


Axial had some smart folks onboard, no doubt, however it pays to not fight the trend, as Axial was primarily a short-fund / bear market fund in which it “sold short” stocks, which means basically it placed investments with the theory that they market would go down further.  Which is great, when the market is indeed going down.   However, as most of us know, this year the market has rallied with our own TSP showing 25 to 30% returns.    Don’t fight the trend.  Put the crystal ball away.  Don’t try to outsmart the market.  

Based on the news article, Axial will be shut down and closed for business, due to severe losses.

As I write this post, at 10:45 PM CDT, the night trading in the SP 500 futures has shown an abnormal jump upward, at 21:30 and 22:30, for reasons I cannot quite pinpoint.  Asian markets are also trading positively (Asia is awake right now).   If this continues into the morning, this may be a sneak peek into a positive trading day for US markets on Weds Nov-6.   See chart to observe price jump, below:

SP-500-futures-11-5-13

I will continue to monitor things and in another 1-2 weeks, will advise if I make any allocation changes to my TSP account.    If you find this site interesting or useful, please share it with your friends and colleagues.    Thanks guys and have a great week.

– Bill Pritchard

Oct 27 2013 Update / SP 500 Futures reflecting bullish sentiment

Good Evening

As is customary on a Sunday evening, I check the E-Mini SP 500 Index futures, which trade electronically on the CME Globex Platform, as this tends to give me a “heads up” as to how Monday trading on the regular stock exchanges (NASDAQ, NYSE, etc) will play out.  This also tends to affect my ability to sleep, as I will either be worried and awake, or relaxed and sleeping soundly on Sunday night.   As you may know, the E-Mini SP 500 Index futures are a “carbon copy” of the SP 500 Index, and in almost all situations, both will perform almost identically.

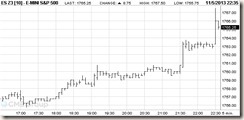
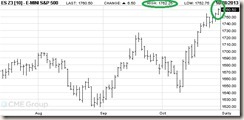
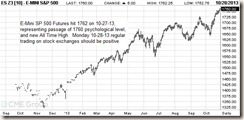
With that said, I am happy to report that (as of now) the E-Mini SP 500 futures have penetrated the ever important 1760 psychological level (discussed in a previous post) and have hit 1762.   This represents a new All Time High, and hopefully my prior posts about buying strength, not weakness, and new highs, versus new lows, has helped my readers understand my position that when a stock or index makes a new high, that is a good thing.   Thus, I am very optimistic that Monday Oct-28 trading will be bullish/positive, and since Mondays tend to “set the tone” for the week, hopefully the rest of the week is positive.   See charts below

SP500-FUTURES-10-27-13-low-density-comments

SP-500-FUTURES-10-27-13-comments

As an additional, we have four (4) more days left for October trading, which will then conclude the three worst performing trading months of the year, per Jeffrey Hirsh, the author of the Almanac Investor.   Most folks know I prefer to make decisions based on data and hard information, versus emotion and crystal balls, and thus I refer to Hirsh’s data which is basically data going back 50+ years regarding the market’s behavior.   He has discovered that August, September, and October, tend to be the worst months out of the year for stock performance.   In four days, October is over.

One noteworthy event which may move markets this week, is the Oct 29-30 Federal Open Market Committee (FOMC) meeting.   A press release/briefing regarding this meeting is expected at 2PM Eastern Time on Oct 30.   However no major economic policy decisions are expected at this meeting, and I don’t foresee any earth-shattering news to come out.    However, I have been wrong before.   The FOMC folks have expressed concern about past “leakage” of statements or at least of their “posture” and phraseology of press releases, as the slightest sneeze has sent markets reeling lately.   So I would anticipate a closely guarded meeting and zero news or rumors until the official statement is released.

I conducted another analysis of the C/S/I Funds and I intend to remain in S-Fund for now.  C-Fund and I-Fund are also performing well, however October will probably finish out with S-Fund as top performer.  

Thanks for reading…

– Bill Pritchard

Oct 25 2013 Update / Buying on Dips, Umbrellas, Reader Mail, and other stuff…

The first full market week, post-Govt shutdown / post-debt ceiling crisis, is behind us, and the indexes closed out the week with gains.   The SP 500 is at All Time Highs, which is a good thing, as highs indicate strength, and good health, for the underlying index or stock.   The 1760 level on the SP 500 is psychologically the next important level, which represents the next 52-week high.

While we have had some naysayers in the press, it is my opinion that the indexes will continue to go up, and opinion or not, I simply react to what the market is doing.   With that said, please take a look at this May 24 2013 article which appeared in CNN Money, regarding some money mangers who believe a pending “market crash” of 20% or more will happen.  It should be noted that on May 24, the SP 500 index closed at 1649.60.

On today’s date, October 25, the SP 500 index closed at 1759.77, representing a 6.5% positive increase since that article.   Time to turn off the “professional” money manager opinions and news media, and listen to the market itself.

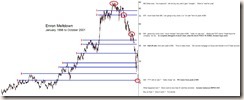
With that said, I got some great subscriber emails this week and I appreciate the positive feedback, thank you.  I had a few emails regarding “buying on dips” versus immediately returning to S-Fund, because that means we are “buying at a higher price” if we buy when the trend resumes upward.  These are legit questions and indicate that many are taking the time to actively manage their TSP.   Before I go further, let me pause and say that there are over 14,000 mutual funds in the United States with combined assets of $13 trillion, according to the Investment Company Institute (ICI), a trade association of investment companies in the United States, per Wikipedia (if you believe Wikipedia…).   So obviously there is more than one way to slice bread, if $13 trillion is out there invested in so many funds, some with poor returns, some with great returns.  Additionally, we have a few TSP trading websites out there, all with their own strategies.   That being said, folks should do what they are most comfortable with, and use a strategy that fits them, provided by a source that they feel at ease with.    Now, on to my example as to why “buying on dips” is not a strategy I recommend.  I will use Enron stock as an example.   Enron is somewhat of an extreme example but it will help illustrate why buying on dips is not a sound strategy (not to mention that “dips” are only visible after they happen, nobody can predict a “dip”).     Lets take a look at the Enron stock chart.   Disregard the blue horizontal lines on the left, as I pulled this chart from another site, and then modified it for my own use.  I am not bright enough to figure out how to edit those blue lines so I just left them.   My comments are on the right side of the chart.   Read the comments next to the red circles that I have placed on the chart.   Our imaginary investor has observed Enron make a heck of a run-up and wants to wait for a “dip” before he buys it.   Follow my comments on the right side of the chart.

enron_meltdown

As you digest the above chart, lets go back in time (like watching video tape of a train wreck) and take a look at the Enron forum over at Motley Fool, dated 2001.   The link is here, and the screen capture is below.   Look at the remarks by username TBIRDMC

ENRON-MOTLEY-FOOL-COMMENTS


Again, Enron is an extreme example, but it serves to drive my point home that (in my opinion anyway…) buying on dips is not a sound strategy.   Now, should a stock or index fall to the 50-day moving average line, and start to go flat, this is a common area where people purchase shares or accumulate additional shares, however this is part of a larger overall strategy versus waiting for “dips” because the stock is “cheaper” to buy.   Stocks are cheap for a reason.   GOOG (Google) is $1000 for a reason.   AAPL (Apple) is $500 for a reason.   In contrast, DELL is $13 (anybody enjoyed the Dell customer experience, with their spam ware/adware bloated laptops?).  Vonage VOIP stock is $3 (with Skype, Facetime, local cable internet bundled VOIP packages, and other services now in the marketplace), for a reason.

Stocks and Indexes (well, any investment vehicle, be it baseball cards, antique cars, real estate, etc.) go up and go down for a reason.   It is my goal to not identify the reason (contrary to popular belief, the reason does not make us money and I could care less “why” something goes up or down, just that it does), it is to identify the movement or trend, as early as possible, and get in sync with that trend.   Note that entire departments of Ivy League schools, units of federal agencies, and private research groups, spend their entire waking hours trying to find out reasons, when they would be much wealthier if they  instead sought out trends.  I can take 10 years worth of  weather data regarding August weather in Florida, hard, existing, documented data, and make the assessment that it will probably rain most of the month and thus require that I carry an umbrella in the car.   By using data, I have identified a trend of behavior (regarding August Florida rain).   Now, how successful would I be if I sampled the air each day, beginning August 1, and carefully analyzed it, and then researched it, sent it out to committee, then voted, on whether I should have an umbrella that month.  Heck, by the time all my research came back I would have been rained on already and missed the trend.   Do I care why it is raining ?   All I care is “Do I need to keep an umbrella in the car”.   Nothing more.   What strategy makes more sense  to reach this decision ?

Of the stocks discussed above, if you were given the instructions, “Vonage or Apple, make one investment and if your choice outperforms the other stock , you will win a prize” which one are you buying ?  Vonage because it is “cheap”,  or Apple ?   Remember, Apple is 500 bucks a share.   Kind of “expensive”.

Which one do you think will outperform the other ?  

That folks, is the question we must ask everyday as part of a successful investment strategy, and buying “cheap” or “on dips” is not (my opinion) not part of that.  Additional commentary on my March 31 2013 post.

With that said, it is my opinion that the market should continue its uptrend, as I see no red flags indicating otherwise.  I am still 100% S-Fund and cannot quite put my finger on the next best performer, as I-Fund and C-Fund are basically doing equally as well, however, not as well as the S-Fund, based on my analysis going back multiple weeks.   As we get more clarity on things, I will remain 100% S-Fund for the time being.

Thank you for reading and if the site/email updates are informative or useful, please share them with your friends and colleagues.

Take care…

– Bill Pritchard