Hello and Good Evening to everyone
The month of May is behind us, and while a few of you have emailed me regarding the “Sell in May” strategy, I advocated that we let the market tell us what to do, and respond to the market itself. It is very hard to “outguess” the market. My investing methodology can be categorized into the Trend Following category, and this past month was a good example of why this strategy tends to be successful.
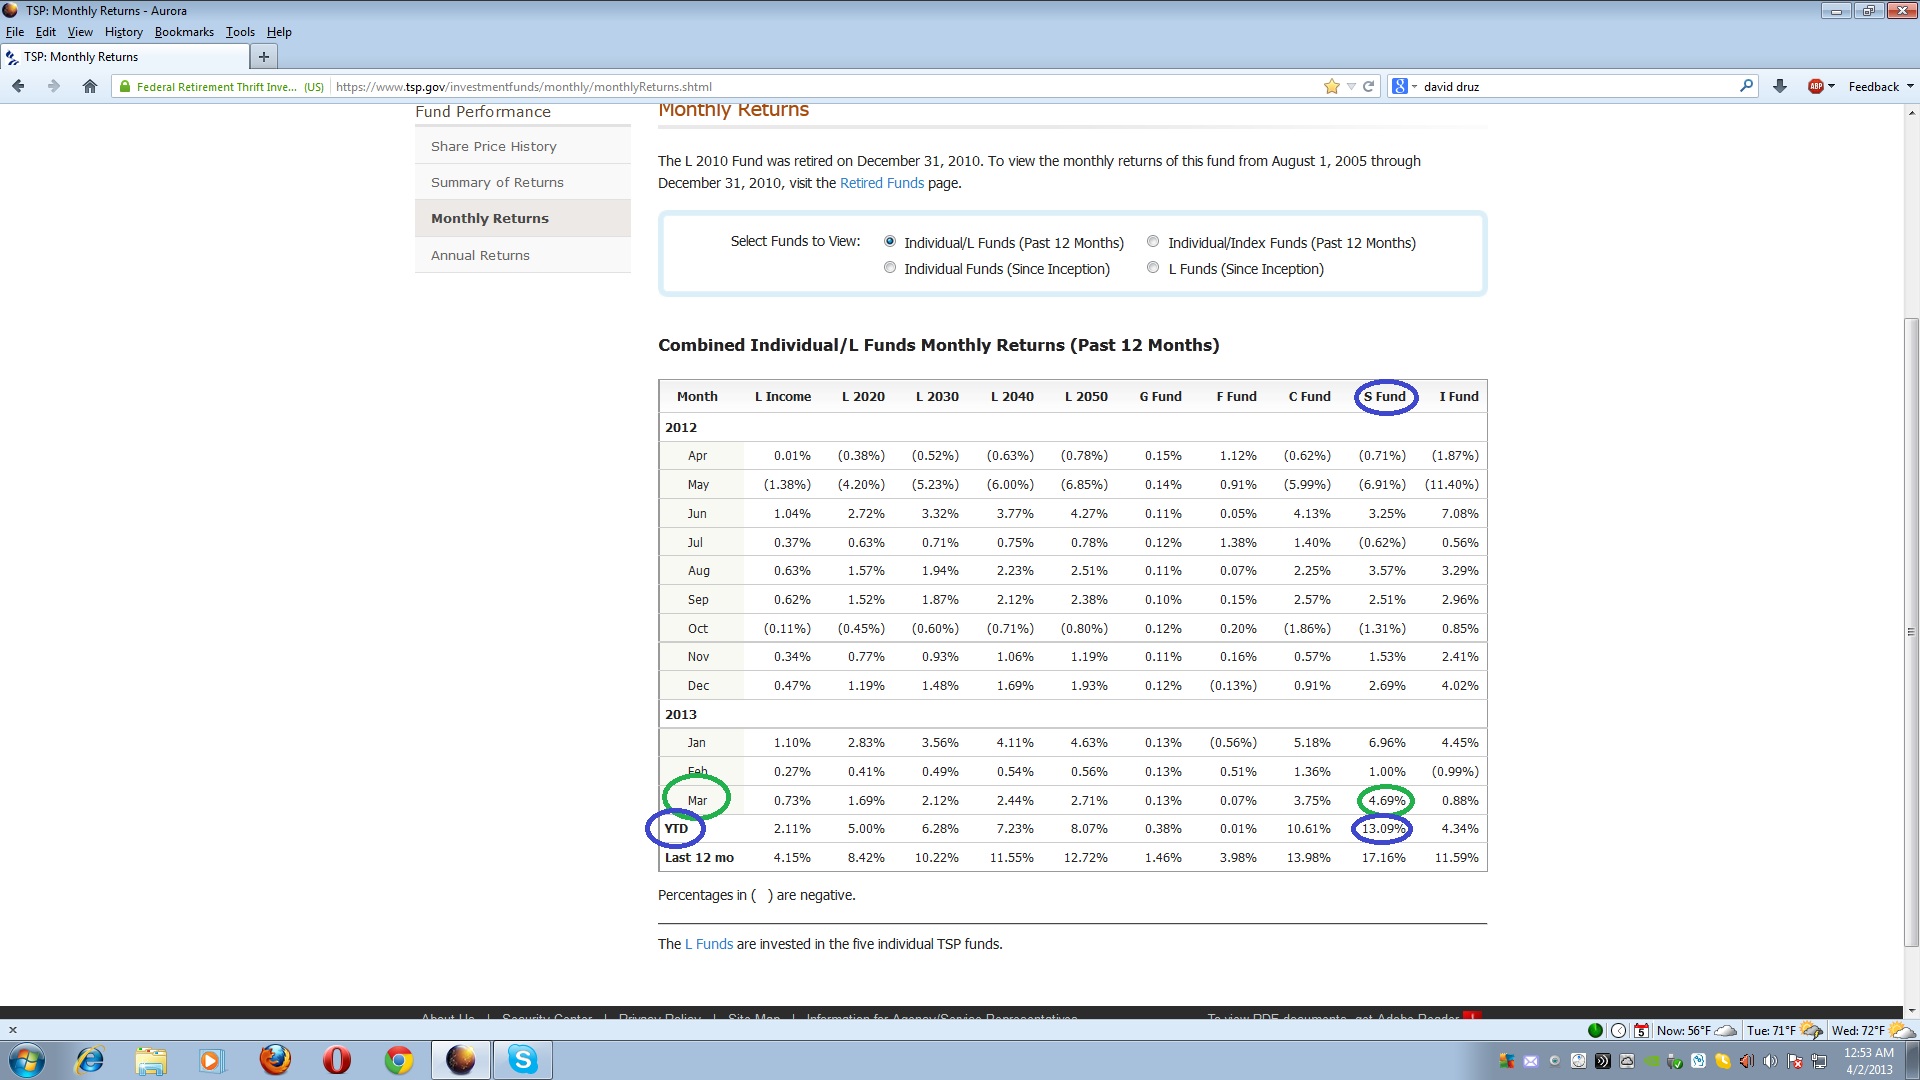
It should be noted that the SP-500 Index closed at 1582.70 on May 1, and on May 31, closed at 1630.74. This represents a 3.0 percent gain in May on the index. In today’s turbulent market climate, I am happy to take any gain the market gives us. Please see below table representing the official TSP site monthly returns.
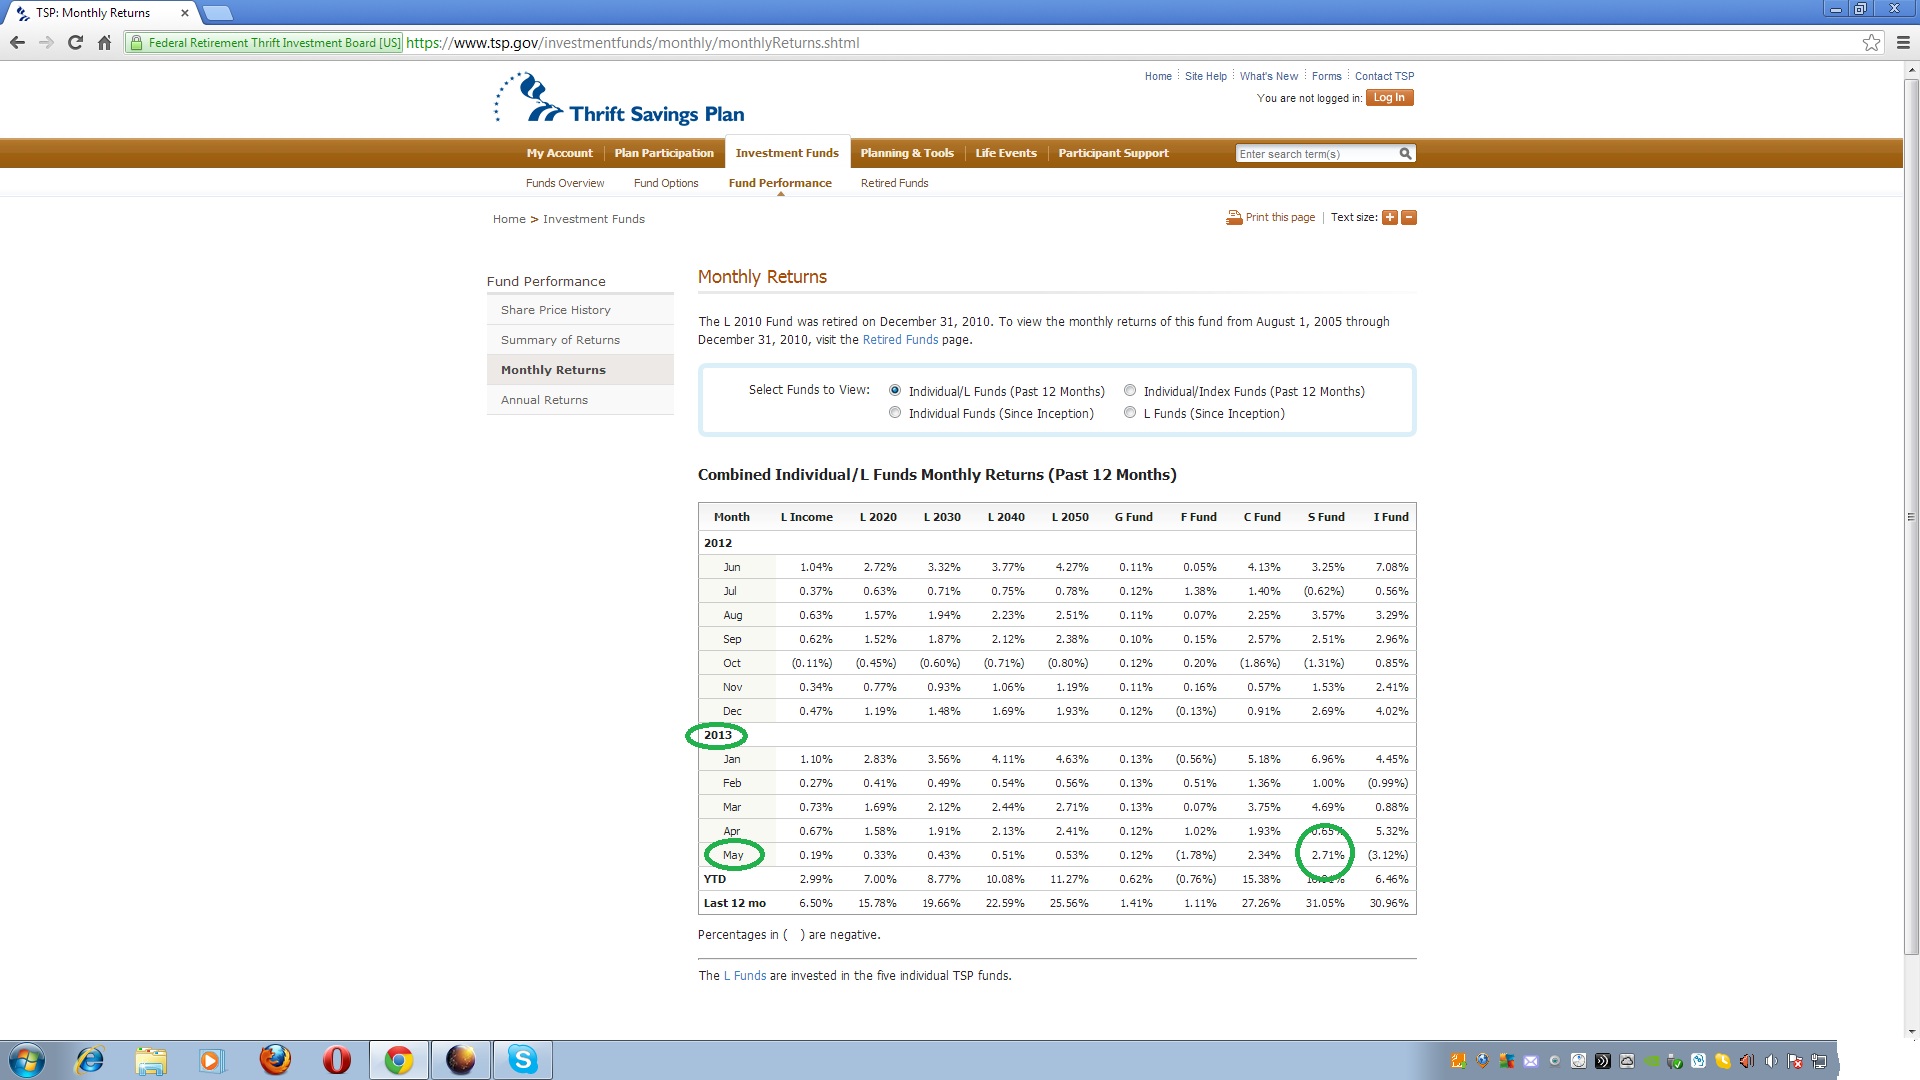
As can be seen, the top fund for May 2013 was the S-Fund. It should be noted that the I-Fund was down -3% for May. This is while the US Indexes were generally all positive. Some may recall my observations regarding the I-Fund, observing that its April performance may or may not have been sustainable. The I-Fund is a weird animal, much more susceptible to international politics and global economic turbulence. This can at times put tremendous gains on the table, and sometimes take them away. The I-Fund sometimes runs in sync with US markets, and sometimes it does not (as shown by May’s behavior). This is not a “knock” against the I-Fund…however at times the I-Fund requires that your seat belt be tightened a little more than if you are in the S/C Funds.
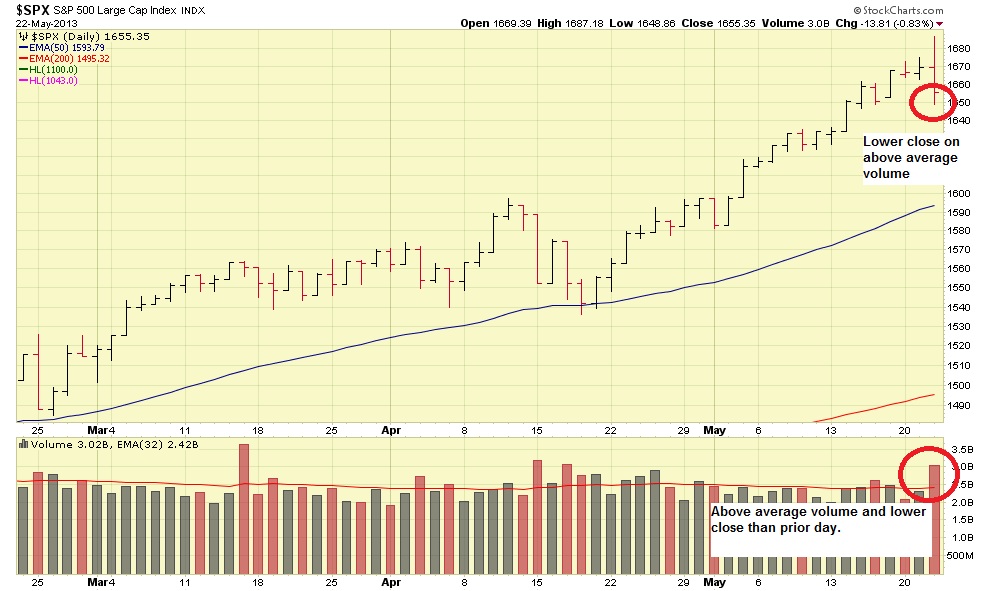
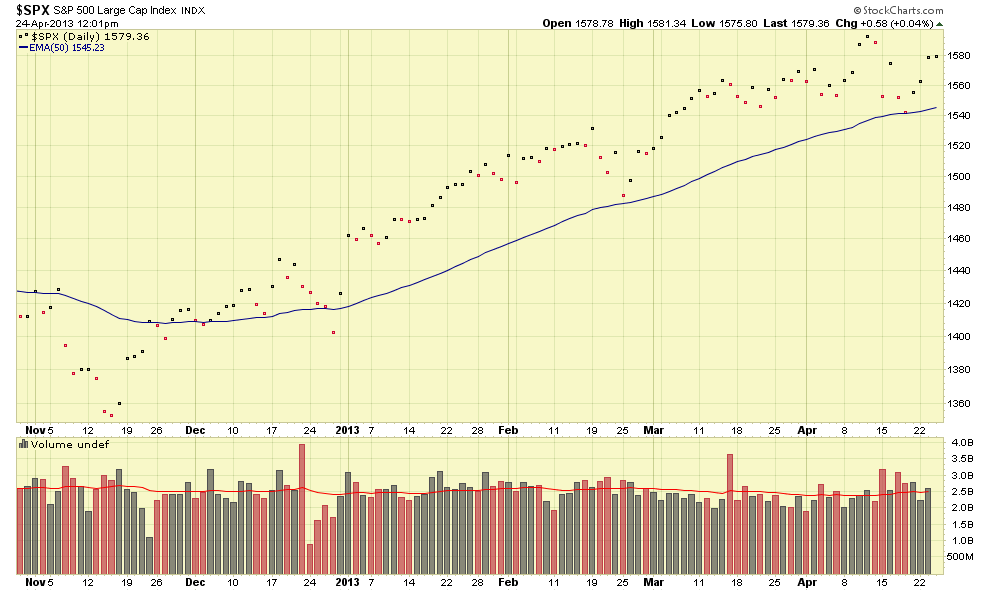
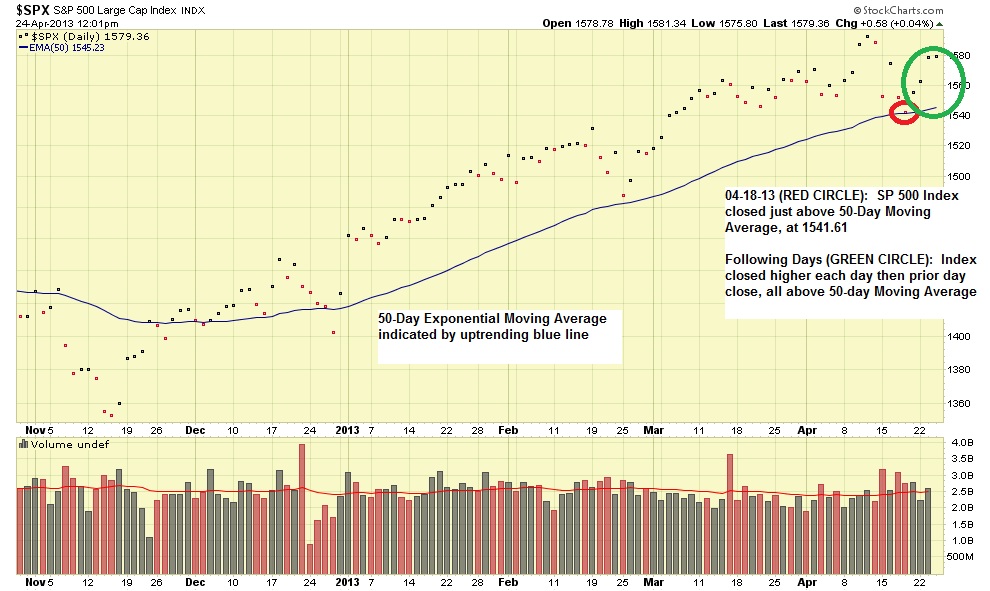
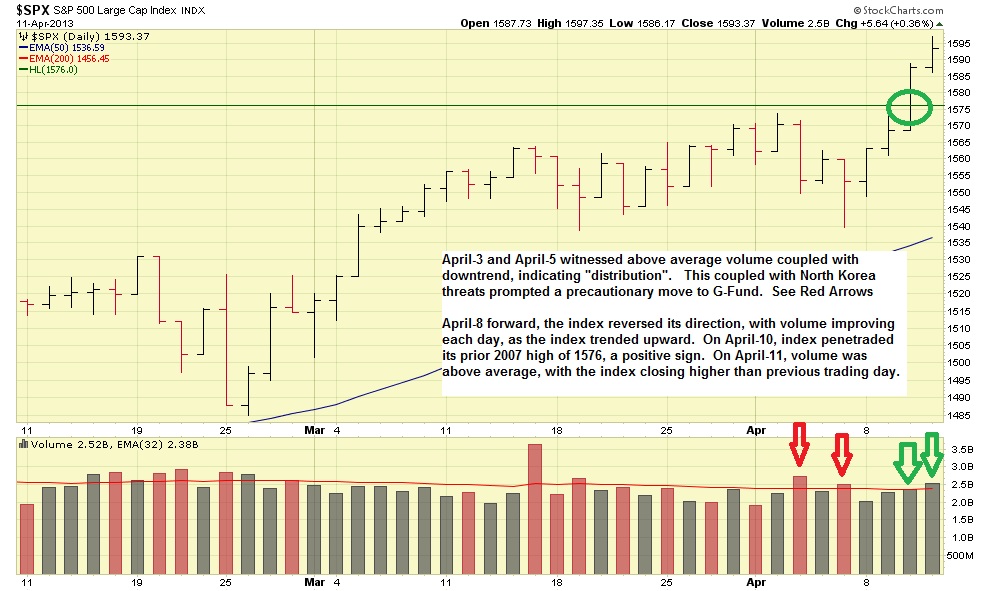
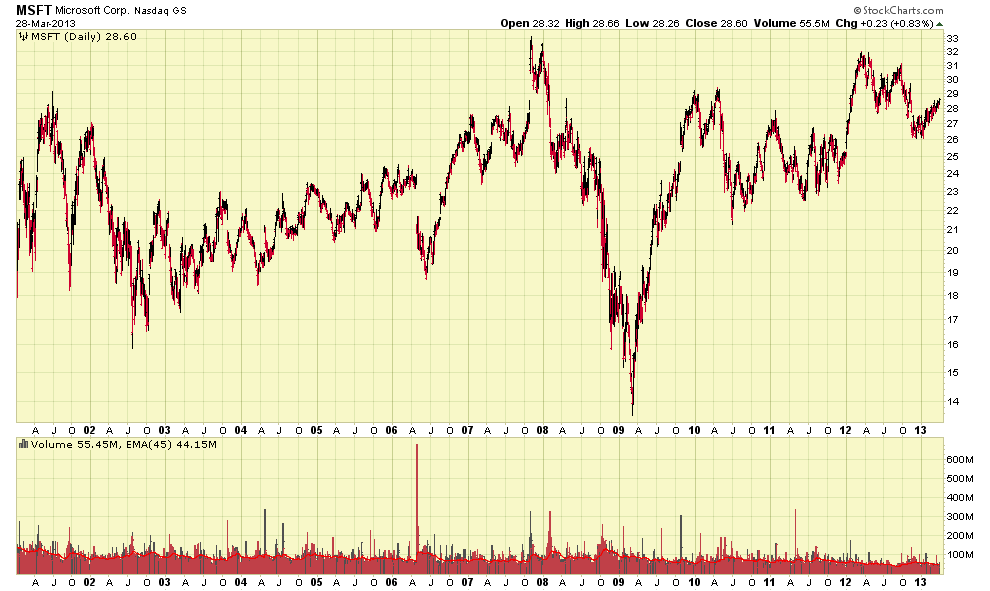
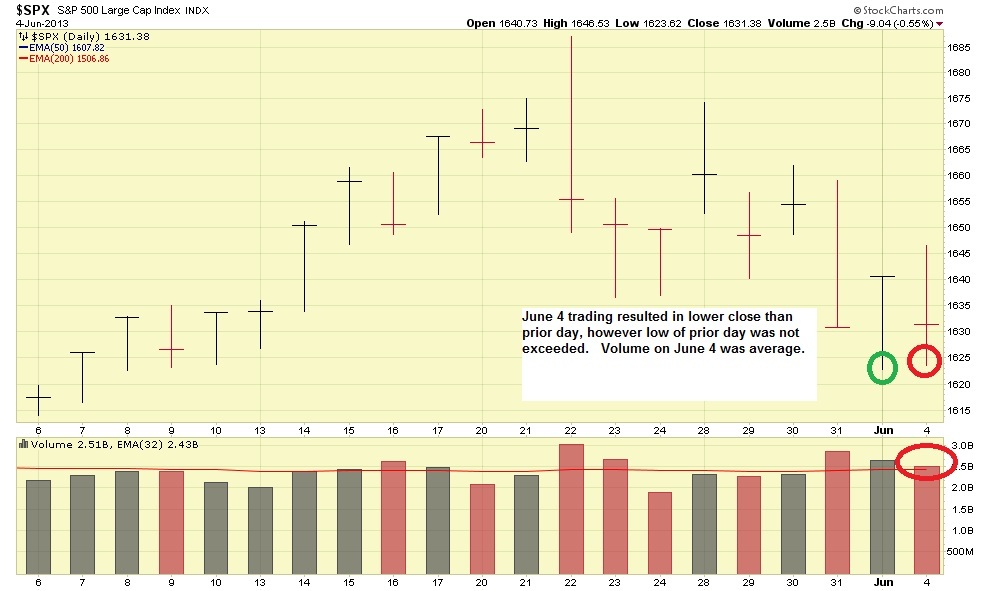
June opened up on a positive note, with the indexes performing very well on June 3, 2014, closing higher than the prior day, on slightly higher than average volume. I would have liked the volume to be a little higher, but I will take what I can get. On June 4, 2013 however, some nervousness about the Federal Reserve’s low-interest rate and bond buying programs (aka QE or Quantitative Easing) have caused the markets to go lower. One June 4, the SP-500 closed lower than June 3, on average volume. No “high volume sell off” occurred on June 4, nor did it trade lower than its low of June 3, which was 1622.72. However, we still need to monitor things and keep the trigger finger ready for G-Fund if the situation dictates. See chart below.
As a counter to this, Big-picture wise, we are seeing positive news reports regarding the economy, involving reports of rising home prices (indicating buying, versus selling of homes), reports of rising car sales, and other things. In summary, I am not (not yet) going into panic mode over the Federal Reserve market nervousness….I see other positive signs regarding the economy.
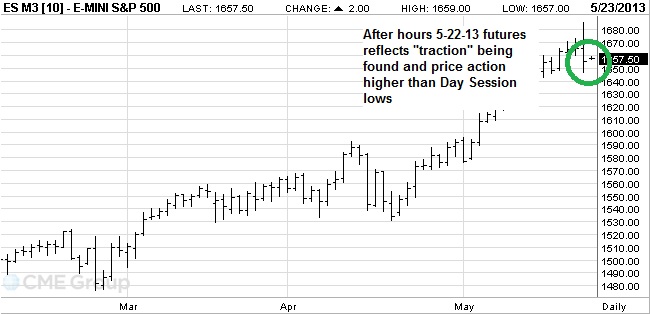
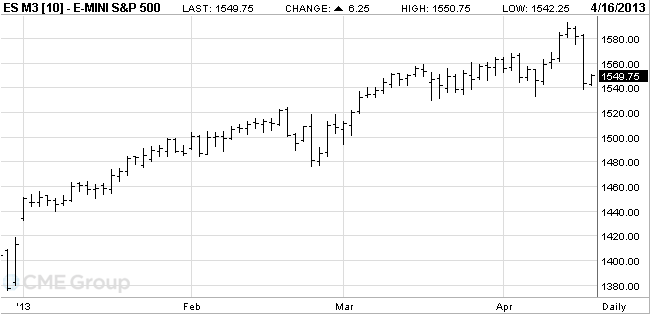
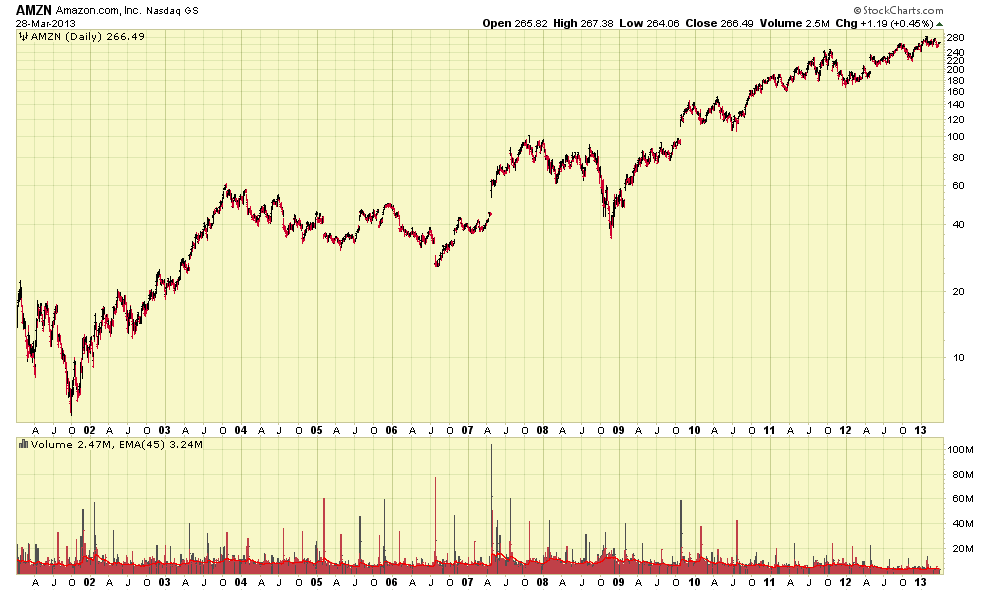
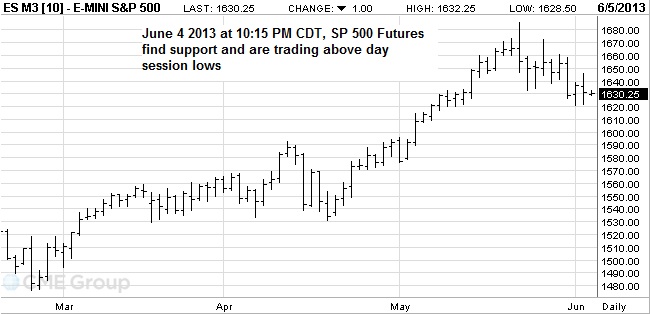
At 10:15 PM Central Time June 4, the SP-500 evening futures contract found support and did not trade below the daytime session. This usually (but not always) foreshadows what will happen on the next day’s stock market trading activity. See chart:
Once again (not bragging, but….), this site provided accurate insight into the best performing fund. Since January, I have expressed my opinion that the S-Fund is the place to be, barring the move to G-Fund in April, due to North Korea’s threat of nuclear war. However, most can agree that since January, this site has provided accurate and informative guidance into the funds, ten of which exist, and almost every month since January, I have successfully called the top fund, out of ten potential choices. An internet search will reveal many “TSP advice” websites, mostly all subscription/payment based. This site has likely outperformed them all (to my knowledge) and is free. If you find this site useful, please pass it to your friends and co-workers. Thank you for the interest and the numerous positive emails.
Thanks again for reading….
– Bill Pritchard
TSP Allocation: 100% S-Fund
Incoming search terms:
- tsp allocation recommendations
- tsp allocation advice
- tsp advice
- best tsp allocation
- tsp allocation advice 2013