Category Archives: Uncategorized

Post-Thanksgiving Update – Trouble Ahead ?

Good Evening everybody

How time flies, my last post was in July.    As you may know, I have retired from the DEA.  Let’s talk about the markets and recent developments, namely “the new COVID variant” (grumble grumble).

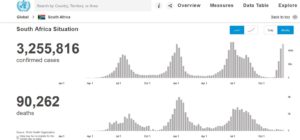
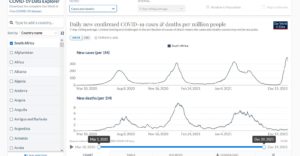
Looking backward, at the last six months, the C-Fund has outperformed all the other funds, with the S-Fund taking second place, up until about a month ago, when the I-Fund outperformed S-Fund.   Enter the “new COVID variant” which was reported to the World Health Organization by the South African health authorities on November 24, which triggered a market sell off on Friday Nov 26.

Presently, my crystal ball tells me that the funds most susceptible to damage from a sell-off will be the I-Fund, then S-Fund, then C-Fund.   I-Fund due to international exposure, S-Fund due to smaller-sized companies and inabilities to sustain economic damage, and lastly C-Fund, all super large companies with ostensibly some protection from short term “new COVID variant” damage.  Clear as mud?   Basically, in my OPINION, if you are 100% I-Fund, you might consult your professional advisors and/or make your own educated decision for your own account and consider reducing some I-Fund exposure.   My OPINION is that (especially for the retired…) a balance of 25% C-Fund (see above comment regarding protection from damage) and 75% G-Fund, the same allocation I discussed in my July post, is still a sensible allocation, again, in my opinion.     

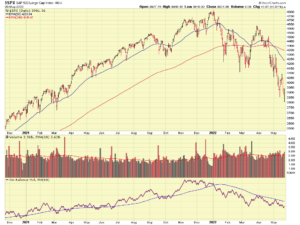
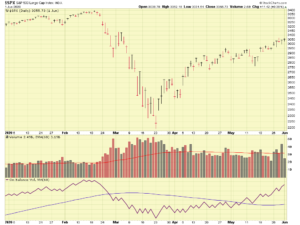
Lets take a look at the original 2020 COVID crash:

As you can see, the market began to deteriorate on February 24, 2020, and began to recover on March 23, 2020, or almost a month later.   What will happen this time?  Who knows, that is anybody’s guess.  However one observation I have is that the stock market, and the economy, in early 2020, both were at all time highs, and rather healthy.  Then COVID came along, and indeed caused havoc.   Presently, now, today, the economy has some other concerns, most notably inflation, and some areas have still not healed from COVID-2020, such as the supply chain (chips for new cars, etc.).   Frankly, the “new variant” is the last thing we need, just when things had started to recover.  I am not fear mongering but just calling it how I see it.  Also important to note is the development of vaccines, which may mitigate impact of this new variant.  As of the publication of this post, the “new variant” (being now called Omicron) has yet to be found in the USA.

Moving on, lets answer if the sell off is “real” or just panic.   Well, any sell off is real, but lets dive deeper behind the scenes, and try to determine if this is the start of a new downtrend or not.  Disclaimer, this is somewhat crystal-ballish, but lets do it anyway.  Keep in mind that Friday was the day after Thanksgiving, historically a day when most market participants are away from keyboards and their Bloomberg terminals.  Friday was also the worst performing day of the year for the Dow Jones index.

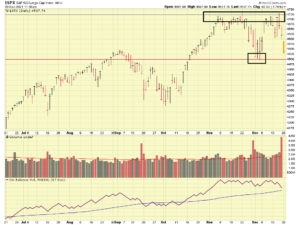
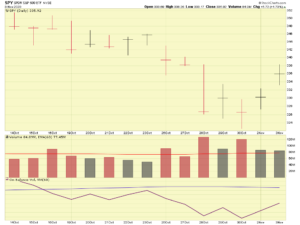
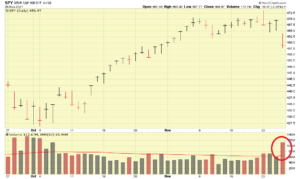
Using the Exchange Traded Funds of SPY to monitor C-Fund, and IWM to monitor S-Fund, both witnessed trading volume of 70-90% above their average volumes.   Additionally, Gold traded higher on Friday, indicating a flight to safety.   So how will Monday November 29, and subsequent days, react?   Again, that is a crystal ball but if more negative news develops on the new COVID variant, I believe the markets may continue down.    As seen below, the volume on Friday for the SPY ETF indeed was much higher than average.

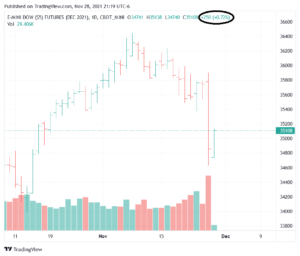
The coming days will likely determine which direction the market will go next.  Hopefully Friday’s panic does not continue.   Dow Jones futures for the evening of Sunday Nov 28 are reflect them trading up almost 250 points:

As stated before, my opinion is that 75% G-Fund, 25% C-Fund represents a good allocation in light of ongoing inflationary and COVID concerns.   My opinion is heavy I-Fund exposure may result in undesirable negative impact from any “new variant” COVID concerns.

Additional comment:  I have received some questions about “market timing” and why not just “buy and hold.”  I respect everyone’s opinion, however instead of typing out a response, allow me to direct you to a 2019 post addressing this topic, at this link:  http://www.thefedtrader.com/positive-signs-continue-for-the-markets/

Begin reading about halfway down the post in which I discuss market timing, the G-Fund, and the fact that the TSP website itself (not me…) advocates the use of the G-Fund to protect against losses.    To quote from the US government TSP website:  Consider investing in the G Fund if you would like to have all or a portion of your TSP account completely protected from loss. 

Interestingly, one website existed, of course with no obvious ownership identity or human name behind it, let’s just say the word “allocation” was in the website name, well that website is no longer working and the last update prior to going out of service was sometime in 2019.   Be careful who you listen to folks.   The only people I personally would follow for TSP commentary would be me, Dan Jamison, and Chris Barfield.   All “real humans” and actual participants in the TSP system, with “real skin” in the game.  I am not a CPA, have no planning or tax expertise (nor claim to have it) so you will not find that here.  My passion is market analysis.   With over 7,000+ mutual funds in existence, per Money Magazine , indeed there are a variety of ways to pursue investment returns and analyze the market’s moves.  Some are better than others, some are worse than others.   For every guy that tells me “gee, I could have made more money by not being in G-Fund” is a guy who says “golly jeepers, I sure feel safe in G-Fund.”  What you see here is my method.  If you find it useful or informative, please share this website with your friends and colleagues.

Thanks for reading and talk to you soon….

Bill Pritchard


Market Update: Threats ahead? and TSP change


A somewhat overdue update…

Good Evening to everybody and Hello from “retirement-land,” an odd and chaos-free world, where you no longer carry a work cell phone, you don’t have to put in a leave slip anymore, and you are not constantly deleting emails because somebody sent a global world-wide distribution (with a red exclamation mark) that some office has a FAX-line out of service.
I highly recommend entering this world, as soon as you can.

With that said, it is time for an update from your favorite opinion based TSP and stock market analysis site, aka The Fed Trader.  The last few months (sans AL-slip, and free of mandatory HQ travel notifications), have been spent white-water rafting and hiking in Colorado, then at a beach in Mexico, somewhere else watching a professional soccer game, and other fun stuff.   Updates have been sporadic I know but please don’t beat me up too badly.  However, some things indeed are brewing on the horizon so it is time for an update.   In the last few months, honestly, no earth shattering single-issue news has hit, and I have thus not reported on much, however a combination of things is brewing right now which may, or may not (“opinion based”), impact the markets and subsequently your TSP performance.  Pleasant cheerful reminder that I do not give investment advice and how you manage your TSP is up to you.  Also, this is not a political site and I try to post factual information and data, in almost all cases developed via my own analysis.  At times the data and information may have an [INSERT PARTY]-lean to it, trust me, it is not designed that way.   Moving forward…

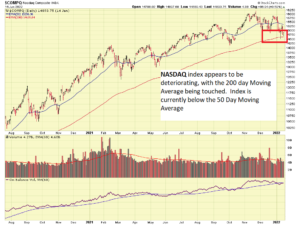
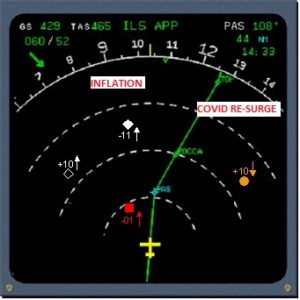
My opinion right now is we have two threats ahead, notably Inflation and the COVID Resurgeor potential panic-attacks because of a perceived resurge.
Lets first, before we start, look at the stock market itself.   Why?  Because at the end of the day, it does not matter what a bunch of market analysts, economists, me, or investment advisors think, it just matters what the market does.   So what is it doing?

If we look back 30 to 90 days, my typical investing horizon (apparently my typical website-update horizon too), we will see that the C-Fund is performing best, or “least worst” of all the funds.  We will also see that the S-Fund is getting clobbered recently, as various NASDAQ stocks and small company stocks start to feel what many believe to be pains associated to inflation, supply chain (planes, trains, automobiles), and supply shortages themselves (lumber, computer chips, etc.).  Large super sized companies, the Microsofts and General Electrics of the world, can tolerate some of those things a little better than the smaller companies.

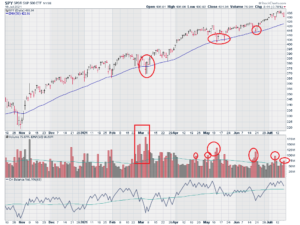
Lets look at a chart of the SPY exchange-traded-fund, a proxy for the S&P 500:
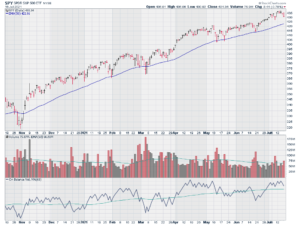
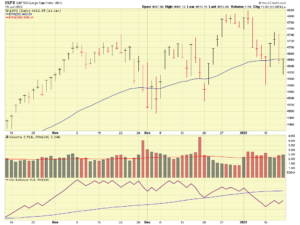
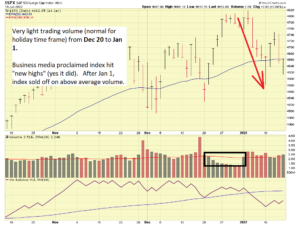
As can be seen, the SPY ETF remains in an uptrend, however it saw some selling/distribution back in March, then in May, then in June.  It remains above its 50 day Moving Average, and technically is still in an uptrend.  However I would have preferred to not see the selling/distribution in recent months.

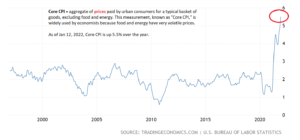
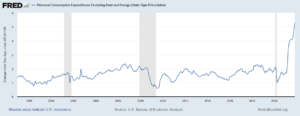
Lets talk about the “threats” as I see them.   First, inflation.  Two different price indexes are popular for measuring inflation: the consumer price index (CPI) from the Bureau of Labor Statistics and the personal consumption expenditures price index (PCE) from the Bureau of Economic Analysis. Each of these is constructed for different groups of goods and services, most notably a headline (or overall) measure and a core (which excludes food and energy prices) measure.  It should be noted that the Federal Reserve uses the PCE index as a tool when making monetary policy decisions.
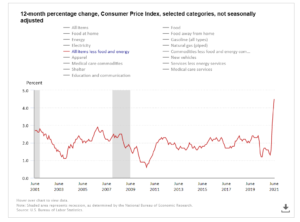
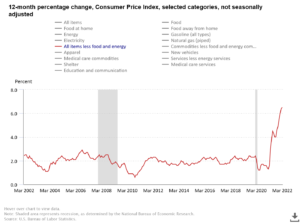
The Consumer Price Index (CPI), which is a measure of the average change over time in the prices paid by urban consumers for a market basket of consumer goods and services.  The CPI reflects the largest increase in consumer inflation since 2008 (we all know what happened that year…the housing crash….).

PCE Inflation shows a similar trend, well, inflation is indeed here, again, at all time highs in over ten years.
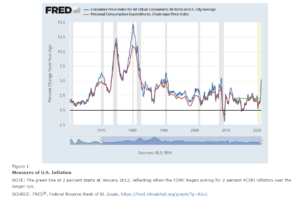
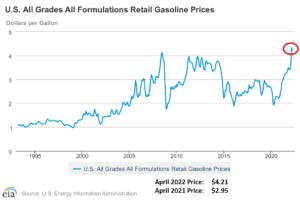
At some point, all this self-corrects.  Consumers decide that their incomes did not go up 25% this year, so they cannot afford the gas that has doubled, or the steak dinner that tripled, and stop spending.   Note:  Gas prices are up 45% since summer 2020:
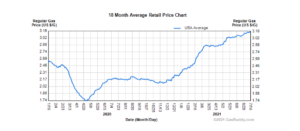
Did you get a 45% raise?  Probably not, and this is a simplified demonstration of inflation.   Goods start to cost more than people can afford.  Like I said, at some point it self-corrects.

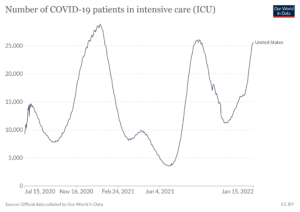
The final threat, in my eyes, is the perceived (but sure looks real-to-me), COVID resurge, notably the Delta variant.  My uneducated research reveals that the majority of the newly infected are either not-vaccinated people, or unfortunate others in 3rd world countries who received various Russian and Chinese vaccines with reduced efficacies.  They are “vaccinated”, masks come off, and back to regular business.  However infections start soon thereafter.

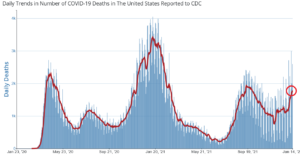
Looking at “body counts” and “deaths”, the following charts appear to reflect a reversal of the COVID death trend:

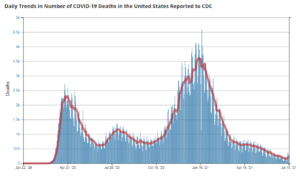
The good news, is INSIDE America, COVID seems to be “under control”, the economy is coming back, and summer travel is booming.  But this can be subject to change with the Delta variant, reportedly more contagious than other strains, and also the now dominant strain in the US.

So there you have it folks, “things as I see them.”  Note, due to my retired status, I am very risk-averse with my TSP and as such, have changed things to 75% G-Fund, 25% C-Fund.  Before all the Kevins and Karens cry or post on LinkedIn that I am too conservative and use the G-Fund too much, the above allocation is basically the same as the L-Fund.   Yes, Wall Street fund managers want you to NOT SELL your investments when times get rough, those managers get paid for assets under management (AUM).  “Hang in there Mr Investor” / “Think about the long haul” / etc.  Furthermore, yes, the G-Fund can be part of your road to wealth, albeit slower, per this June 15, 2021 article in Federal News Network:

https://federalnewsnetwork.com/mike-causey-federal-report/2021/06/wanna-join-the-tsp-millionaires-club-ask-one/

Quote:  “……Many years ago, I spent lunches with co-workers, and we would discuss the TSP and where everyone planned to invest their accounts. Back in those days, our only options were just the G, C, F, and I Funds, a small fraction of current TSP funds. Many believed the economy looked promising and spoke about investing aggressively in the C fund. Others chose a more cautious path by not taking any chances and investing 100% of their account in the G fund. In my opinion, both paths of investing — whether aggressive or cautious — can lead to success; you just need to make the choice that will let you sleep at night……”

Wow, powerful.  “Let you sleep at night.”  I have only said that a zillion times on this site.   Glad to see this concept supported over at Federal News Network.  Remember, the TSP official website itself, states that investors should consider investing in the G Fund if you would like to have all or a portion of your TSP account completely protected from loss.  That is not from me, that is from the TSP.   I didn’t “invent” the concept of moving to G-Fund to be protected from loss. 

Summary:

1.  Some threats exist, Inflation and COVID, on the path ahead.

2.  For my personal risk tolerance and ability to sleep at night, I will be changing to 75% G-Fund, 25% C-Fund.

Hope you enjoyed this update, if you feel it is useful please share it with friends and coworkers.  A few TSP analysis sites have come and gone over the years (all claiming to be a “different approach”) but this one remains strong, with continued subscriber growth each month and multi-thousands of subscribers from every federal agency under the moon.  Thank you !

Talk to you soon….

-Bill Pritchard


March kicks off with turbulence…


Good Evening everyone

The first trading week of March is now behind us, and it has been quite a week.  Please bear with me as I share my opinions and my assessment of recent market activity.  My personal TSP Allocation of 100% S-Fund has not changed.  Why not?  I am not a TSP day trader, and instead prefer a long term view of the funds.  A variety of theories, strategies, beliefs, etc. exist out there (just Google search “TSP”) regarding the best way to manage your TSP- just do what works for you.  “Works for you” may mean absolute total returns, it can also mean “be able to sleep at night”, or a combination of the two.  8,000 mutual funds exist in the USA, how many ways exist to invest in stocks?  8,000?  Not sure, but apparently it is a big business if 8,000 funds exist.  Ok, enough soap-boxing, lets move on to what I think is happening in the markets.

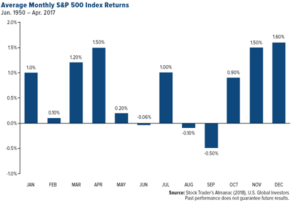
Interestingly, the first day of March 2021 was the best S&P 500 day since June 2020.  This was a great way to kick the month off, a month that historically has given us good performance as shown by the below graphic:

Less than desirable however, was the subsequent “mini crash” the various indexes had after March 1, arguably fueled by the rise in 10-year Treasury Yields which many believe is associated to risk of rising inflation.  (Note:  the Dow Jones finished Friday 572 points up for that day…..)

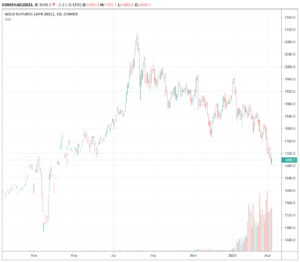
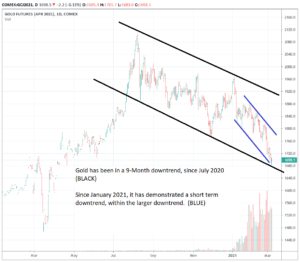
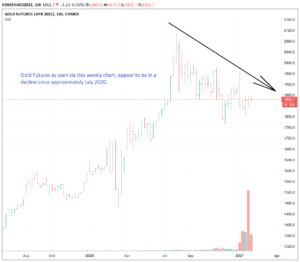
This subsequently causes a fear that the Federal Reserve may change monetary policy and thus some nervousness enters the markets.  However, I am not personally getting too wrapped around the axle about Treasury Yields, not yet, because my other “indicators” (that is checkpoint-speak) show (relatively) smooth roads ahead.  What are these?  They are gold, crude oil, and the overall trend of the indexes.   Lets look at gold, the default safe-haven investment.

As can be seen in the chart, investors are not suddenly flocking to Gold, because “the markets are tanking.”  Gold is down hard, reflecting outpouring of investment.

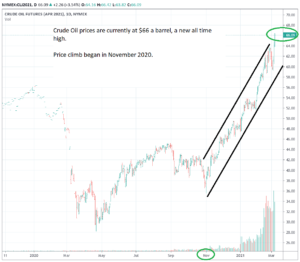
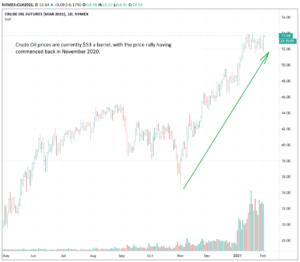
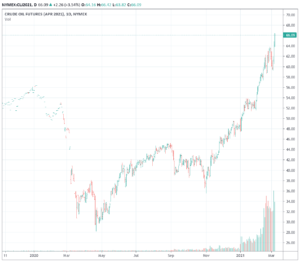
Lets take a look at Crude Oil, which has seen a spectacular rise in recent months, great news for the oil industry.  I have spoken about this before; many believe rising Crude Oil prices reflect a strengthening economy,  and Crude Oil is increasing rapidly:


The price climb is obvious on the above charts, a climb which began in November 2020.  I recently spoke with a friend from West Texas, an owner of an oil service company, he reports that the industry expects a very positive 2021.  This is further supported by this article:  https://oilprice.com/Energy/Energy-General/Why-Big-Oil-Expects-Record-Cash-Flow-In-2021.html

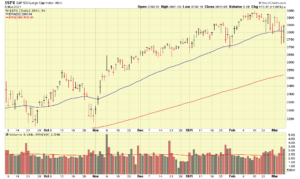
So we have two fairly reliable (in my opinion) indicators which seem to paint a positive picture.  That leaves us with the S&P 500 index itself:

While this week has been volatile, the overall uptrend is still intact.  The index has only closed below its 50-day moving average once, and that was on March 4.  Indeed volume has increased on the “down” days, but we have seen some positive volume on the “up” days also.

With that, I conclude this update.  Again, my TSP Allocation has not changed.

I hope everyone is doing well and for those traveling or vacationing on Spring Break in the coming weeks, have a safe vacation.   Also, please continue to share this site with your friends and colleagues.  For those who need benefits and retirement program information, beyond market/TSP analysis, always keep in mind Dan Jamison, who authors the FERS Guide book.

Thank you and talk to you soon….

-Bill Pritchard


February 1, 2021 Update

Hello Folks

The new year is off to quite a start. This includes my own recent retirement from the federal government, under the FERS “25 years of 6(c) = retire at any age” provision. It was truly the best career in the world, with awesome coworkers and colleagues from other agencies and departments. Old habits will die hard…I am not sure if I will ever stop checking my phone for “missed calls” (nobody called…) or if I will be able to change the way I speak, asking my wife “what is the status of the soccer game” or “are you enroute back home” or “what is the game-plan for tomorrow” type of stuff.  Picking up our kid from track?  “Who is transporting” or (alternatively) “who is covering the pickup of….” etc.  I know, crazy.  “Would you like dessert sir?”  Negative.   It will be hard to de-1811ize myself, after all these years.  With that said, I hope to have much more time for this website, and I have some other ideas and projects being contemplated regarding investment education and market analysis. Stay tuned.

Moving onward, time to talk about the markets and the TSP. Back in mid-December, I posted the below regarding small cap stocks:

My point above was that the S-Fund was probably the best place to be for the time being, in my opinion.  Not shockingly, recent returns published on the TSP website reflect that out of fifteen fund choices, the S-Fund has been the top performer Year-To-Date for 2021.  Link:    https://www.tsp.gov/fund-performance/

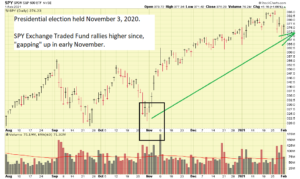
Note that in my opinion, this will likely continue, and my personal TSP allocation is indeed 100% S-Fund.  I do not advocate day trading your TSP, and instead I seek to capture long term trends.  As many know, I am not afraid to use the ultra conservative G-Fund as a tool in my toolbox, even if it means foregoing gains in a riskier investment.  Presently, it is my opinion that being fully invested in the S-Fund, or a combination of S, C, and I  Funds, is something for the TSP investor to consider and research.  My own analysis of the various funds and index performance indicates that small cap and international stocks may outperform other categories in the next three to six months.  As outlined in FAQ #6, a new President (any party) can serve as a catalyst for a new Bull market.  Let’s take a look at a chart of the SPY Exchange Traded Fund, a useful proxy of the S&P 500 index:

As can be seen, this ETF, and the S&P 500 itself, has rallied since November.   Moving past this, a look at the weekly price of Gold reflects that investors are leaving Gold (a “safe haven” investment), which would seem to reinforce my theory that stocks are taking on a new Bull posture:

As I have stated in numerous prior posts, Crude Oil is a barometer of the economy, being a supply/demand product, many believe that low crude oil prices are indicative of poor economic conditions.   A check of the Crude Oil chart reveals a price uptrend since November 2020:

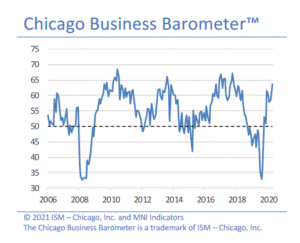
Additionally, another tool I use for a fundamental analysis of the economy is the Chicago “Business Barometer”, an index which measures manufacturing in the Midwest USA.  Values above 50 indicate growth of manufacturing activity.  The recent January 2021 release, comes in at 63.8, the highest reading since July 2018.  See image:

It is not my goal to bury the reader in charts and graphics, so in sum, my opinion is the stock market may see a new Bull movement, and go higher, in 2021.   My opinion is that the S-Fund will be the best performer, with the I-Fund and C-Fund, being second and third choices, for the near future.

With that said, what do you think the stock market will do in 2021 ?  I am interested to see what the audience thinks.  Please complete this poll (link below), which includes a comment feature if you are a Facebook user:

POLL: https://linkto.run/p/WZCV0DOK

Thank you for being a subscriber, if you find this post informative or useful, please encourage your friends and colleagues to subscribe.

-Bill Pritchard


Market Analysis – Dec 12, 2020


Good Morning folks, I hope this update finds everyone well.  Now that we have the Presidential election behind us, let’s take a look at the markets and surrounding events.   Bottom Line Up Front:   The S&P 500 has risen 9.64% since November 2 (the day before the election), and small cap stocks appear to be the best performing category for the time being.

As many know, a few major events have occurred since the election, which is important because elections are major catalysts which influence the markets (see FAQ# 6):   The US Supreme Court recently denied a Texas lawsuit seeking to overturn the vote in Pennsylvania, Michigan, Georgia and Wisconsin.  Additionally, President Trump signed a stopgap funding bill keeping the federal government open until December 18, and the FDA approved Pfizer’s COVID vaccine.

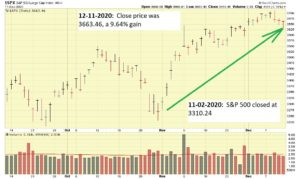
As stated above, the markets have rallied since the election.  “Why” is a complicated question, however in a very general sense, the markets do not like uncertainty or unknowns.  Let’s take a look at the S&P 500 chart:

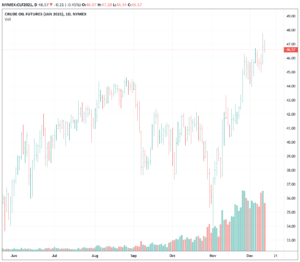
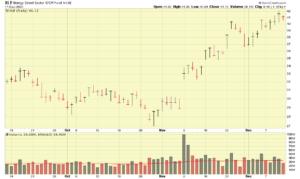
On November 2 (the day before the election) the index closed at 3310.24.   Since then, it has risen 9.64%, a respectable number given the fact that it represents approximately one month of days that the markets were open.   The energy and oil sector, an important jobs creator in Texas (and other areas), has witnessed oil prices subsequently rise, as demonstrated by the below Crude Oil and Energy Exchange Traded Fund (ETF) charts below:

I have posted previously on this site that a desirable price per barrel for Crude Oil is $55.   With the current price above $45, we are making some progress towards that desired level, which results in profits for our large oil companies (and jobs), and still keeps the price at the retail gas pump at a level affordable to the consumer.

The energy sector ETF, ticker symbol “XLE”, has risen also, propelled by oil prices and optimism in the energy sector.  Note that oil prices tend to rise in good economic conditions, and tend to fall when the economy is faltering.  Rising prices arguably may be a harbinger of things ahead.

Since the election, small cap stocks have outperformed all others.   Investment in small cap stocks is done via the S-Fund in the Thrift Savings Plan.  The TSP investor may desire to research this further and use that information as he makes his own investment decisions.   On a 30-day thru 90-day basis, the small caps are strongly outperforming the large cap (C-Fund) and international stocks (I-Fund), some weighting in the C-Fund might be a consideration for further research.

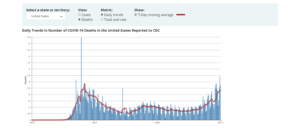
With the FDA vaccine authorization (and other countries also authorizing vaccines), this should further help the economy.   Current death rates from COVID, using CDC data, are approaching April 2020 rates:

Airlines, restaurants, in-person retail, hopefully will see a rebound once vaccines are widely available.  Not suffering is E-Commerce, as consumers order online and have everything shipped to their house.  E-Commerce was booming before COVID, now it is on fire; as it solves a problem and makes life easier for millions of people.  In summary, if you have a smartphone, you have a shopping mall, a grocery store, and a movie theater, all in your hand.  Pretty powerful stuff, the future of which is basically unlimited, in my opinion.

Regarding the federal budget, this is a huge unknown, however my opinion is the stopgap funding until December 18 will then expire and the government may see a shutdown after that.   Hopefully Congress can agree on the COVID stimulus package prior to that.  Again, my opinion, but the way I see this, the one week stopgap funding gets the federal workforce a full pay period “worked”, which will get the workforce paid for Christmas (EFT on/about Dec 24).   However after December 18, we have Congress who may wish to go home for Christmas break, and the fact that the “new” Congress takes effect on January 3, 2021 may also complicate things.   The January 20, 2021 inauguration is fast approaching also.  I guess my point/opinion is we have a lot of stuff going on ahead, and I am not sure if a shutdown can be averted.  My prediction (hope I am wrong):  We shut down on Dec 19 thru ??? possibly January 3, 2021.

This concludes my current assessment of the markets.  I hope everybody has a great weekend and is healthy and strong, as we wrap up a challenging year.

Please continue to share this website and email updates with friends and colleagues.  They can subscribe via this link:  http://www.thefedtrader.com/contact-us/

Thank you

-Bill Pritchard


Election 2020 market update


Good Evening Folks

Well here we are.  Arguably one of the most watched elections in recent history, and with record voter turnout.  Let’s talk about what has happened and what the markets have been doing.

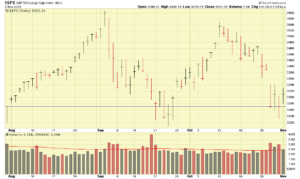
First, the Dow Jones “overnight futures markets” the night prior to the election (November 2) traded up, ranging from 150 to 200 points.  This continued into the regular stock market trading day of November 3, with the Dow Jones reaching 600 points to the positive during the morning.  This is a welcome change from the prior week, as it signals the week starting on positive footing.  Please see below S&P 500 chart of the recent roller coaster we have been on:

Tuesday’s action witnessed the Dow having the best trading day since July 14.  This action follows Monday November 2, which was also a strong up day.  On both days, volume was above average, indicating accumulation, or buying of equities by institutional investors.   Please see below chart of the SPY Exchange Traded Fund (ETF):

The day after the election, Wednesday November 4, witnessed the Dow Jones index trading 600 points to the positive.  The I-Fund, interestingly, ended the week as the top performer.  In addition to US markets, stocks in France and Germany also rallied.

Not to be outdone by equities markets, Crude Oil futures also traded higher, rising to $39 a barrel.  Note that crude oil typically behaves in unison with equities.

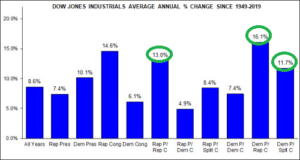
I have posted on this site before the fact that the markets typically outperform under a Democrat as President.  This is factually correct, however this should be clarified that the best performance is when a Democrat is President, with Congress under Republican control.  The market seems to prefer a checks-and-balance mechanism.  I am not advocating for one party or another (and the stock market is just one part of the universe, which must include law and order and a strong military), nor am I telling you who to vote for in the now-past election.  I am merely posting historical market facts.  See chart:

All of the recent action has been on above average volume, with the QQQ and SPY ETF’s gapping up.  This is a very bullish behavior, and is further explained at this link:  https://www.investors.com/how-to-invest/investors-corner/breakaway-gap-the-art-of-the-breakout/

The solid performance continued into November 5, with the Dow Jones going up 600 points.  That day, the tech heavy NASDAQ had its best 3-day run since April.

On Friday November 6, the markets “sold off” somewhat but this is reasonable to expect as most Fridays witness sell offs prior the weekends.  Combine this with the huge run up during the week- it is normal for folks to take some winnings off the table.

Now that we know what happened with the markets, what do I expect to happen with the election?  Let’s use parties, not names of candidates for this opinion based discussion.

Entering Friday night, the election results are still being processed.  Quite incredible in today’s age of modern technology.  At the center of my crystal ball is the State of Nevada.  Also important is Arizona.  Note that Fox News, my preferred source of news, has Arizona already called for the Democrats, which I agree with.  You cannot win Arizona without winning Maricopa County, period, the end.  62% of Arizona’s voters reside in that county alone.  And Pima County historically always votes Democrat (county overall).  Pima County represents about 16% of Arizona’s voters.  If Maricopa and Pima both prefer the same party, at 78% of the State’s voters, the math simply does not work for the other party to out-climb the wall in front of him via votes from the rural areas.  The various late night cable shows that “Arizona is still in play”….in my opinion it is not.

This takes us to Nevada.  With 6 Electoral College votes, if the Democratic candidate wins here, he wins the election, because per Fox reporting he already has 264 out of the needed 270 votes.  He is already ahead in Nevada.  Nevada is interesting because nobody who lives there, is actually from there.  Well, almost nobody.  Nevada has more residents from California, than from Nevada.   Guess how California typically votes.

We also know that even in Red States, such as Texas, the “metro areas” voted more Democratic than they did Republican.  This did not occur in Oklahoma and other strongholds, but those metro areas indeed were “less red.”   In most all states, outlying rural areas voted Republican.  Hold that thought.   Let’s return to Nevada’s “still counting ballots” situation.  As of Thursday night, Nevada elections officials stated that there were about 190,000 ballots still to be counted as the state continues to remain too close to call in the U.S. presidential election.  About 90% of those remaining ballots, or about 171,000, are from Clark County.  Source:  https://twitter.com/NVElect/status/1324459947493519361?s=20

Clark County is the county that the city of Las Vegas sits in.   With 2M+ population, this is clearly a metro area and as stated above, already has demonstrated a leaning towards the Democratic Party, at 53.7% Democrat, 44.5% Republican as of Friday November 6. 

Short version:  90% of the yet counted ballots are from Clark County, a Democrat leaning county of metro area Las Vegas.  We have documented history reflecting strong Democrat leaning in most metro areas across USA.  Also, most residents of Nevada, are actually from California.  Summary:  My opinion is Nevada goes in favor of the Democrats.  If it does, game over.

Arizona:  already a done deal, per my commentary above.   Per news media, Clark County will finish ballot counting on Sunday (Nov 8), and Pima County will finish on Monday (Nov 9).   So it may be a long wait over the weekend.

Georgia:  Despite a Democrat very slight lead, I expect this to ultimately go in favor of the Republicans.  Going back to 1984, from the electoral college standpoint, Georgia has voted for Republicans, with the exception of 1992 when they voted for Clinton.   For my purposes, I believe Georgia ultimately will finish ballot counting and it will favor Republicans.

In conclusion, we may know something in the coming days.  It will be important to study how the markets respond, and react accordingly.

If you have not already done so, please participate in my reader poll:  https://www.quiz-maker.com/poll3070068x478E43f6-95

Everybody have a good weekend….

-Bill Pritchard


October 10 update


Happy Columbus Day weekend everybody.   More and more I am only finding time to update this free website on major holiday weekends or during a “lull” in numerous family events that are going on right now.   Sports, music, Scouts, etc.  No excuse, so here we go with today’s update, where I share my opinion on what the market has done, and why.

This recent week (10-05 to 10-09) witnessed the market’s best week in 3 (three) months.   This is really great news.  Hence a good time for this update.  My overly conservative (I get beat up over being conservative on this free no-cost site, and about my “over use” of the G-Fund, oh well…) opinion that 75% G-Fund and 25% C-Fund is the ideal allocation is likely being met with frowns from the audience.  As such, the standard disclaimer remains:  Manage your own TSP as you see fit.  If you are a 22 year old Border Patrol Agent, with 35 years ahead of you, most of it at the GS-13 level and higher, maybe 100% G-Fund is not the place to be right now.  If you are 56.998 years old, retiring in a few months, maybe 100% I-Fund is not the best idea either.   Talk to you financial advisor, planner, etc.  With that said, a more aggressive approach, presently, will likely result in more gains, due to the market’s recent strong performance.   On a long term view, the C-Fund has been outperforming the other funds, however more shorter term, the S-Fund has been the top performer.   Sure, you can “invest all of it in the C-Fund and never look back” because “the C-Fund always goes up.”   News flash to thousands of mutual fund managers, CFP’s, retirement counselors, university MBA and finance programs, and Jim Cramer:  you can all quit now, your services are not needed….we have found the magic recipe for investment success.   I digress…

Important:  Historically speaking, when small cap stocks suddenly display a fresh energy, and outperform large caps, this is one indication of a new market uptrend underway.  Let’s take a look at a chart of the S&P 500:

As you can see, the market crashed somewhat, most of September.  Most believe this is associated to political fighting over the COVID stimulus package.  While opinions abound from both sides (and I have my own also…) regarding socialism and “bailing out” businesses, versus letting free market forces take effect, at the end of the day this is America and we have a duty to protect the weak and defenseless.  What does this mean?  It means that we have thousands of unemployed folks, with no medical care, no paychecks, and an uncertain future, because of the COVID situation.  Small, entrepreneurial businesses are especially hit hard.  The bakery that closed because no more birthday parties, and no more cake orders.  The local restaurant that just couldn’t make it thru the shutdown.   Etc.  As such, some positive energy exists that the stimulus package will be signed and put into effect, helping trigger the market’s rebound.

COVID itself appears to be under control, at least overall, across America.  Some states (South and North Dakota) have seen a spike, but if we can keep the COVID cases under control, ideally below 5% positivity rates, more calm will return to the markets.  We only recently went below 5% (overall for the country) in August.  See chart:

So two elements to the market’s continued health include the control of COVID, and the stimulus bill itself.   Which brings us to the next element, the election.  I will attempt to be bipartisan and agnostic as I discuss this market driver, and keep the elements of my discussion to be economic/market focused.  Observe in my FAQ #6, political change indeed is a huge catalyst for the market.

Historically, the markets do better under a Democrat President, versus a Republican.  Lets return to our discussion of the recent uptrend.  It began on September 24, a Thursday, then we had the weekend, then on September 29, a Tuesday, we had the first Presidential debate.  I am not going to comment on who won or who did not win, but the pollsters at Real Clear Politics aggregate all the polls around the country and develop their own score regarding which candidate is seen more favorably by the voters.   Since the debate, Biden has been outperforming Trump in the polls.   Simultaneously, the stock market uptrend which got started a few days prior to the debate, has grown stronger.   See chart:

Is there any linkage between the market uptrend and the recent polls (assuming the polls are accurate) ?   Maybe yes, maybe not.  The polls have not negatively impacted the market uptrend.  So while you and I may have our own personal preference at the voting booth, the stock market may be deciding its own preference right before our eyes.

With that said, the election is 23 days away.  Basically two pay periods and the next Commander in Chief is elected.  In my opinion, the election will rest on the states of Florida, Ohio, and Iowa.  All are “toss up” states and contain a large number of Electoral Votes within.  Most political analysts consider Florida a “must win” for any candidate; one cannot be President without winning Florida.  So once that is done, Ohio and Iowa will be important.  Pennsylvania is important also, with 20 Electoral Votes.  Hence the state’s name was mentioned three times at the first VP debate.  However, sometimes politicians have a detachment from reality- fracking jobs are a direct result of the price of natural gas, a Pennsylvania leading industry.    Natural gas prices have been in a decline since the year 2008, simply a matter of supply, demand, and pipeline infrastructure.  See chart:

Not sure any politician, from any party, can wave a magic wand and bring the natural gas and fracking industry back.

There you go folks….two pay periods of time and we have a new President.  The markets have been doing very well in recent weeks, hopefully this continues.

I wish everyone a great weekend.  If not already done so, please complete my poll regarding your sources of TSP information.  Link:  https://www.quiz-maker.com/poll3070068x478E43f6-95

Thank you for reading !   Talk to you soon…

-Bill Pritchard


August Update, Reader Poll


Good Afternoon Folks

My apologies for a delayed update- the summer has been very busy for me, it seems that I no longer get “me time” anymore-  I know many are in the same situation.  Add the “lock down effect” into the mix, once the local parks and recreation areas opened up (with appropriate safety measures in place) for use, my family was out of the house.  I even almost near-drowned being towed behind a ski boat (my skills are market analysis, not water sports behind a ski boat) as I enjoyed my freedom.  COVID has reminded me to appreciate the outdoors…just simple walks outside have become very enjoyable.  Before COVID, if my neighbor asked me to “go for a walk” I would look at him like he had five eyes.

Back to the markets and the TSP.   Note that I have included a Poll link at the end of this update.  Please complete this poll, as it helps me stay in tune with my audience.  I had a reader email me regarding “other TSP sites”, as one site (or discussion forum?) he mentioned has demonized being conservative and having the majority of your TSP in the G-Fund.

I do not subscribe to negative energy, so I told the person above who emailed me (he was close to retirement) that he needs to talk to a professional advisor for an official opinion, with that said, he needs to do what he is comfortable doing.  This reader correctly identified the fact that we are in a “pandemic” and in a global recession.  Remember, the TSP site itself identifies the G-Fund as being useful for preservation and stability of your money.  I did not invent or patent the non-cosmic idea of being conservative.  With that said, please complete the Poll at the end.

Let’s continue on to my opinion based analysis of the markets….

Allow me to start with the chart of the “Spider” “SPY” Exchange Traded Fund (ETF) with tracks the behavior of the S&P 500 Index, my default barometer for the markets.  Volume analysis of the SPY is a little easier for me, hence my use of it:

As can be seen, the markets rallied in late March, triggering an uptrend which still exists.   The top performing TSP funds are S-Fund as top performer, and C-Fund as next best performer.  It is important to note that summer volume has been rather light in the markets, adding credence to the theory that retail investors, versus institutional investors, are the active participants in recent months.  This means “smart money” is staying away.   To dispel/prove this, lets take a look at the price of the de-factor safe haven currency, Gold, something most retail investors do not dabble with:

Based on the gold chart, it appears Gold has rallied since March (interestingly, so has the stock market…hence my “retail investor” theory).   Gold rallies when economic conditions are poor or worrisome, which indeed they are.   Allow me to use this as an opportunity to state that the stock market and the economy, are two different things.  Yes, they often behave in unison (RE:  2007-2009 Financial Crisis) but at times they do not.  This is known as “decoupling” and that is in effect now.   To begin my economic discussion, lets take a look at the GDP chart:

Recent economic reports and indicators paint a bleak picture of the economy.   The most recent GDP report reflects a -32.9% contraction in economic activity during the second quarter.  This follows -5% GDP for the prior quarter.   Two consecutive negative GDP reports fulfill the textbook definition of a recession.  As such, the United States is currently in a recession.   Important to note is that this is almost entirely the result of the COVID situation, and not anyone’s “fault” or from any mismanagement.  The CEO of American Airlines cannot be blamed because nobody is flying right now.  When a local bakery closes its doors, and goes out of business, because the town is “locked down” and nobody is buying custom birthday cakes for now-cancelled birthday parties, it is not the bakery owner’s “fault” the business closed.   That is why this COVID situation is so delicate, it threatens our health, our economy, and more importantly, our futures.  With that said, the cold hard truth is that the U.S. is in a recession.  Furthermore, the International Monetary Fund (IMF) has stated a recession exists globally.  Since 1900, no sitting US President has won re-election to a second term during a recession.  None.  This is important as we make investment decisions in October and face a possible change in administration.  Whether the current President gets penalized for this recession, it still yet to be determined.

Unemployment data (again, not anyone’s “fault”) is at all time highs, however has started to recover since March:

Currently, 10.2% of the labor force is capable of being employed, but is jobless and unemployed.  This is down from 14.7% back in April.   Irrespective of cause or “fault”, 16.3M people in our country are unemployed, which impacts discretionary spending and other things, which have impact to the economy.

With that said, school is opening soon and soon we will know if, and to what extent, COVID impacts our youth, as schools have been out of session since March.   This may play into further “shut down” decisions.  Thankfully, kids seem to have a resilience to COVID, typically not getting sick at all.   Some theorize this is associated to numerous vaccines obtained at a young age, for whatever reason, these vaccines may be help keep COVID away.  In any event, we will know soon enough.

For the reasons above, my allocation of 75% G-Fund and 25% C-Fund, similar to an L-Fund, will continue.  I am optimistic about our great country, and about our ability to overcome obstacles.  I hope a vaccine is developed soon, and that we can resume life as we used to know it.

Thank you for reading, I hope everyone has a great rest of their summer.   Please complete the poll below.   Thank you

POLL:   https://www.quiz-maker.com/poll3070068x478E43f6-95

– Bill Pritchard


June 20 Update – Uptrend resumes but challenges Remain


Hello Folks

Bottom Line Up Front:  Markets resume an uptrend while facing numerous challenges ahead.   The following reflects my opinion based analysis of the market’s behavior in recent weeks.

As many market watchers have observed, the markets have resumed an upward direction since approximately April 23, which coincides with various “reopening” activity across the country.  This indeed is a good thing, however the volume behind the move upward has been lackluster (in my eyes), which tells me that institutional conviction is still largely on the sidelines.   Furthermore, the price of Gold, a typical “safe haven” investment, is also up.  This tells me that the investing universe is still not fully committed to stocks/equities, even in light of the reopen of the world.  The S&P 500 index has approached its late February highs, but is encountering resistance at the 3250 area on the index.

Please see charts of Gold and the S&P 500 Index below:

To analyze volume action, I typically employ the SPY ETF “tracking stock” which mirrors movement of the S&P 500 index.  That chart is below:

Apparent in the chart are volume spikes, coinciding with reopening announcements, and on purported good news on the vaccine front.  While welcome events, the market still has numerous hurdles ahead.

On June 8, the National Bureau of Economic Research (NBER) declared the US economy officially to be in a recession, based on the huge declines in employment and in production.  Other groups classify a recession as two consecutive quarters, or more, of negative GDP.   Our last GDP report on April 29 was -4.8%.  The next report is expected to be released on July 30.  If this is negative, then by all measures, the economy is in a recession.   Interesting factoid is that William McKinley (deceased in 1901) was the last US President to win a re-election after a recession occurred during his first term.   No President since has repeated that.  What this means is political instability later this year may be another threat to the markets.

In addition to declining GDP, another barometer for the economy is the Chicago Business Barometer, summarizing current business activity, which is also known as the Chicago Purchasing Manager Index or Chicago PMI. The Barometer is considered to be a leading indicator of the USA economy.  A recent chart of this barometer reveals that the current 32.3 level is on par with 2008-2009, a period of one of the worst economic downturns of the United States.  Chart:

So we have two indicators, GDP, and Chicago Business Barometer, painting a stark picture of the economy.   Additional action in the form of stimulus and tax cuts may be warranted, however with the Senate out until July 20, this may not happen for many weeks.

Other things threaten the markets, most notable is the Coronavirus/COVID-19 health pandemic.  I will attempt to remain apolitical here, and use my home state of Texas as a discussion point.  Texas, a conservative leaning, pro-NRA, largely Republican governed state, is the largest state of the contiguous United States, and has everything from beaches, ranch land, forests, and urban city environments.  A variety of demographics exist in regards to residents of Texas.  The way COVID is impacting Texas is probably not dissimilar to how it impacts the rest of the USA.   With that said, death counts, and the positivity rate, is increasing in Texas.  Not sure about other states, but Texas has stopped using antibody tests in the calculation of the positivity rate.  Medical experts believe the viral test (nose/throat swab) is the best test for detecting current victims.  The antibody test, merely checks for antibodies and proteins in your blood which may exist because of exposure to the virus.  Ostensibly, one may be exposed, you body fights it off, and you never got infected at all.   Should we lump this into the case counts ?   I believe some states are indeed doing this, with the media not helping as they amplify and enflame the facts.  Quest Labs themselves disclaims the use of their very own test for the purpose of ruling out COVID-19 infection:

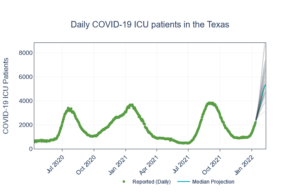
Some images from the Texas Department of State Health Services are below:

I am using Texas because I have faith in their reporting, there is no political angle to “spin” the reporting against the current administration, and they have removed antibody testing from the case counts.  If anything, they have a possible tendency to “present” the information in a favorable manner.  With that said, death numbers have increased, as has the positivity rate.

What does this mean?   It means (in my non-medical opinion) that obviously COVID continues to infect others, even in light of social distancing, mask usage, and other measures.  Big picture, this may result in restaurant closures, or another “shut down” either officially declared, or self-imposed, by the consumer.   This will impact the economy, and the stock market.  As we “re-open America”, we are likely to see increased infection rates.   The goal is minimize impact on hospital resources, but if more people get infected, the need for hospital resources only grows.  Fun fact:  We don’t need ICUs or ventilators if nobody is infected. 

In summary, the market is uptrending, but some challenges await ahead.  Some big dates ahead include the “jobs report” on July 2, the return of the Senate to Washington DC on July 20, and the 2nd Quarter GDP report on July 30.  When the Senate returns, we may see additional stimulus and economic measures which may benefit the markets.

Presently, the S-Fund is outperforming the C-Fund.   Participants may want to consider this when making allocation decisions.  My allocation of 75% G-Fund and 25% C-Fund, similar to an L-Fund, has provided me with the ideal risk/reward comfort level for the present time.

That is all for now.  If you find this free site to be informative, please share them with your friends and colleagues.  To subscribe, please use this link. 

Thank you for reading !  I hope everyone has a great weekend and Father’s Day.

-Bill Pritchard


Hope and stimulus triggers Bounceback


The stock indexes have entered May on negative footing, the Dow Jones index trading 600 points to the negative on the first day of the month of May, with the losses on April 30 (Thursday) and May 1 (Friday) effectively erasing all gains during the week.  Indeed, the last few weeks have been quite turbulent, with the market largely rebounding from the lows witnessed on March 23, 2020.   This rebound has largely resulted from hope and stimulus and not on positive economic news, which is quite lacking.  I will discuss all of the above.  Unfortunately, the damage done by Coronavirus/COVID-19 has resulted in a negative TSP performance for all stock funds, both for the last 12 months, and Year to Date.   My personal TSP Allocation of 75% G-Fund, and 25% C-Fund appears, in my opinion, to be the appropriate allocation for my account, offering me the ability to benefit from the “up days” in the market while still having some G-Fund protection.   My allocation is very similar to the TSP L-Funds.  For additional information on diversification, please visit the TSP site at: https://www.tsp.gov/PlanningTools/InvestmentStrategy/beforeyouinvest/diversification.html

Lets take a look at the S&P 500 Index:

Evident in the chart is the rebound which started after March 23.  This rebound witnessed headwinds on April 30 and on May 1, impacted by negative economic news which included jobless claims and poor corporate earnings.

A variety of events have spurred this rebound, notably hope and stimulus, in the form of fiscal “bail out” styled packages from our Treasury Department. Indeed some of these packages have strings attached, and must be paid back with interest, but if the receiving company goes bankrupt and liquidates, there will be no pay-back that I can see.  Payroll protection, stimulus checks, loans and grants have been provided, and rightfully so.  Clearly our leaders are looking out for America- the COVID-19 virus itself and the resultant federal response has brought us into uncharted territory in many ways.

A variety of vaccine and drug studies are underway, to include Remdesivir, a product used to treat Ebola, that first came into existence in 2009, and produced by Gilead Science, and Hydroxychloroquine, used to treat malaria and Lupus.  These medicines appear to expedite the victim’s “return to service” and recovery, but do not appear to have vaccine properties or other preventative properties.   They are possible treatment drugs. Remdesivir requires intravenous injection, aka IV-bag and hospital bed, etc.  It does not align with mass applications to thousands of people in one setting. Hydroxychloroquine can be administered via a tablet.  These drugs, and others, have provided people with hope, a necessary and desirable thing to have in times of despair and uncertainty.

On the economic front, news is not good.  Let me be clear:  there are no fundamental/economic-based news to send the market higher.  The April 29 Gross Domestic Product (GDP) release reflects that GDP decreased -4.8 percent in the first quarter of 2020, according to the “advance” estimate released by the Bureau of Economic Analysis:

In the event that next quarter’s GDP is negative, that will reflect the “official” start of a recession, which is a GDP decline in two consecutive quarters.  Many economists are already saying a recession is here now, akin to a Category 5 hurricane offshore and declaring the beach house “destroyed”, even before the Hurricane arrives.  In any event, next quarter’s GDP will be telling.  Additional negative news includes 30 million jobless claimed filed in the last six weeks, and a reduction of housing market optimism as reflected in the Housing Market Index, a monthly poll of builders and construction professionals.

So what is going on with COVID, which caused this mayhem?  Most experts agree that our economy was fine until COVID came along.  COVID statistics and metrics are probably the most polarizing topic in modern times, aside from talking about religion and politics itself.   How are death rates calculated ?  Do people die of COPD, lung infections, or is it labeled “COVID?”  If the medical examiner in NYC does things one way, does the medical examiner in Seattle do it the same way ?   What about hospitalizations ?   Reports exist that hospitals “want” COVID patients, to allegedly obtain high value reimbursements from the government.  I doubt this is the case, nobody wants a walking HazMat case to coming into any building.  Hospitals can make money in a lot of other ways anyway.  Others report that this very reason is causing hospitals to turn away patients who are non-critical, thus resulting in a walk-up patient, indeed with COVID, who is sent home to recover.  This is not a “hospitalization.”  A very superficial assessment of Hospital ABC, with no COVID patients (they all got sent home at the door), will cause someone to believe that there is no COVID in that town.  Also, as testing expands across the nation, case counts will naturally increase. One could spend hours reviewing COVID data and still not understand the scope of the problem.  Sensationalist media (basically all channels besides the Food Network) does not help.

For me, all I care about is daily rates.  Not cumulative.  A graveyard is cumulative.   Today it contains 50 deceased persons.  Tomorrow, 3 graves become occupied and the graveyard now has 53 deceased.   Naturally, over time, more people fill the graveyard.  When sensationalist media claims two (2) COVID deaths in January, and 60,000 in April, well, yes, that is correct.   As people die, the numbers increase (sadly).   What I care about is daily rates, of hospitalizations, and of deaths (aforementioned date methods aside).  See charts:

For the weeks ending on April 4 and April 11, the weekly hospitalization rate (there is no daily rate from CDC) was 7.5 and 7.4 persons per 100,000 people.    We obviously do not want that to increase.  My personal “worry level” would be 10 persons per 100,000 people, as that is clearly abnormally high.    Lets move on to death rates:

Evident in the cart is the fact that the daily new death rate (for April) is basically 2,000 to 2,500 a day.  We had a spike of 2,603 a day on April 22, and a huge spike of 6,393 on April 17.  I am not sure if the reporting criteria changed that day or what happened, but if we remove that from consideration, we are looking at 2,000 to 2,500 a day for new deaths.   My “worry level” is if we see 3,000 a day for new deaths.

Which leads to the lock-down discussion.  If we have no vaccine, no preventative medicines, and only via self-quarantine and social distancing, have we managed to reduce daily rates to the above levels, what happens when we “open back up.”  More importantly, what will the decision makers do ?   Hypothetically, lets say USA is “open” (albeit wearing masks, social distancing, etc) on June 1.   Lets say masks and other measures indeed have some positive impact. However, new infections and new deaths are still bound to happen.  Lets say we go all of June then we see hospitalizations and deaths spike in July, as a result of the May/June “re-open.”  I am not being pessimistic here but it is what it is.  School typically resumes late August.   The decision to return to school will probably be mid-August.   So in my opinion, July is a very important month.   It may set the tone for a return to school and other things.   Keep an eye on the above rates.  Elected Governors and Mayors know that you can shut down testing and magically have “No COVID cases” and high five each other that the problem is solved.  But if someone dies from COVID, or is hospitalized with COVID, that is hard to dispute.   My worry levels are 10 hospitalized per 100,000, and 3,000 deaths daily.  By the time July arrives, we should have the May and June data which will paint the picture of where COVID is headed.
Lets keep our fingers crossed as we begin the new trading month of May.  My personal TSP Allocation remains 75% G-Fund, and 25% C-Fund.

Thank you for reading, please share this email with friends and colleagues who may find my opinion based analysis of the markets useful…the link to subscribe is:  http://www.thefedtrader.com/contact-us/

Thank you

-Bill Pritchard