Good Evening
This will likely be the last post for 2019, as we are mere days away from 2020. Fortunately, I have plenty of positive things to write about, most notably, the market’s positive behavior as we approach the end of the year. The market is likely responding to a number of positive developments- with that said, we are also in “Santa Claus rally” mode, which is the time period beginning the last week of the year, and into the first week of the New Year. Bottom Line up Front: My TSP Allocation remains 50% G-Fund and 50% S-Fund, however I may return fully invested in stock funds at the end of January, 2020.
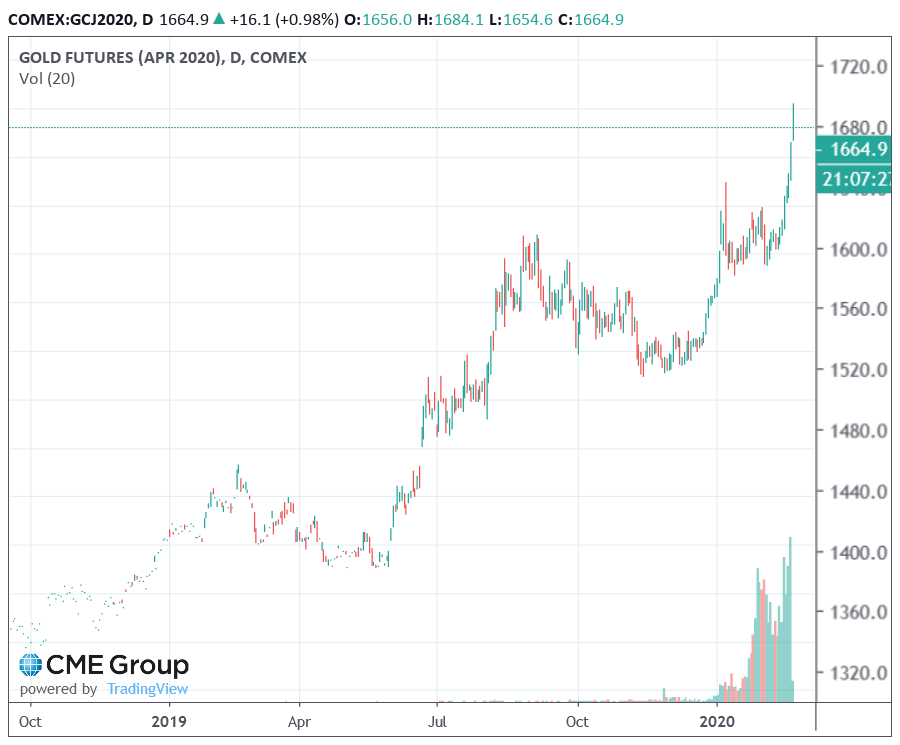
Let’s talk about recent TSP fund performance. Preliminary data from a variety of sources (not just the historical, it-already-happened, TSP.GOV website), reflect that the S-Fund will likely remain the top performing fund in the near future. The next runner up will likely be the C-Fund. Being that the S-Fund represents small cap stocks, and the C-Fund represents large cap stocks, their recent strength is tied to underlying economic conditions and positive news, detailed below.
On December 13, 2019, President Trump announced that a “Phase One” trade deal with China was official; this deal contained the following provisions:
- Tariffs on Chinese goods planned for December 15, 2019 are suspended
- September 1, 2019 tariffs reduced from 15% to 7.5%
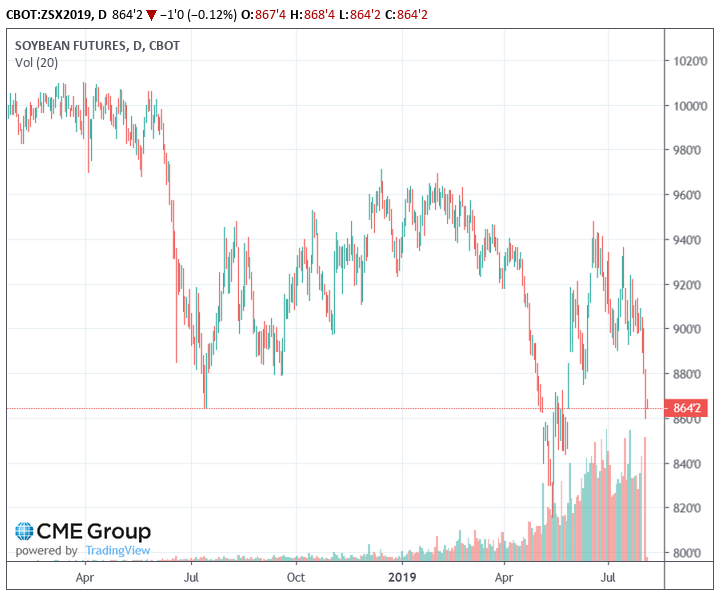
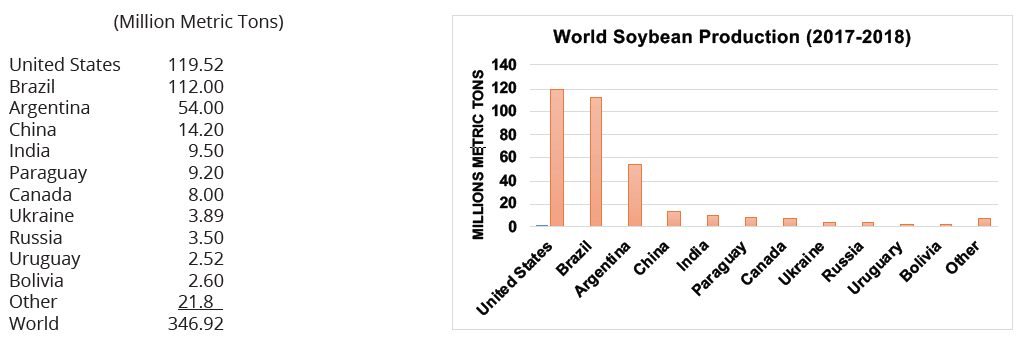
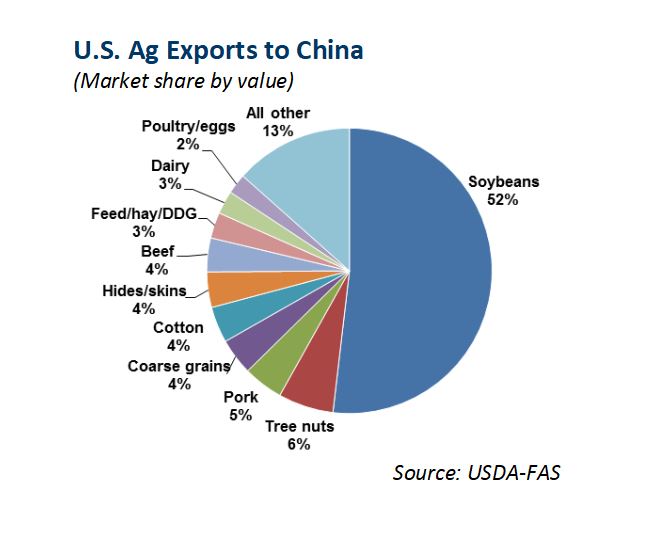
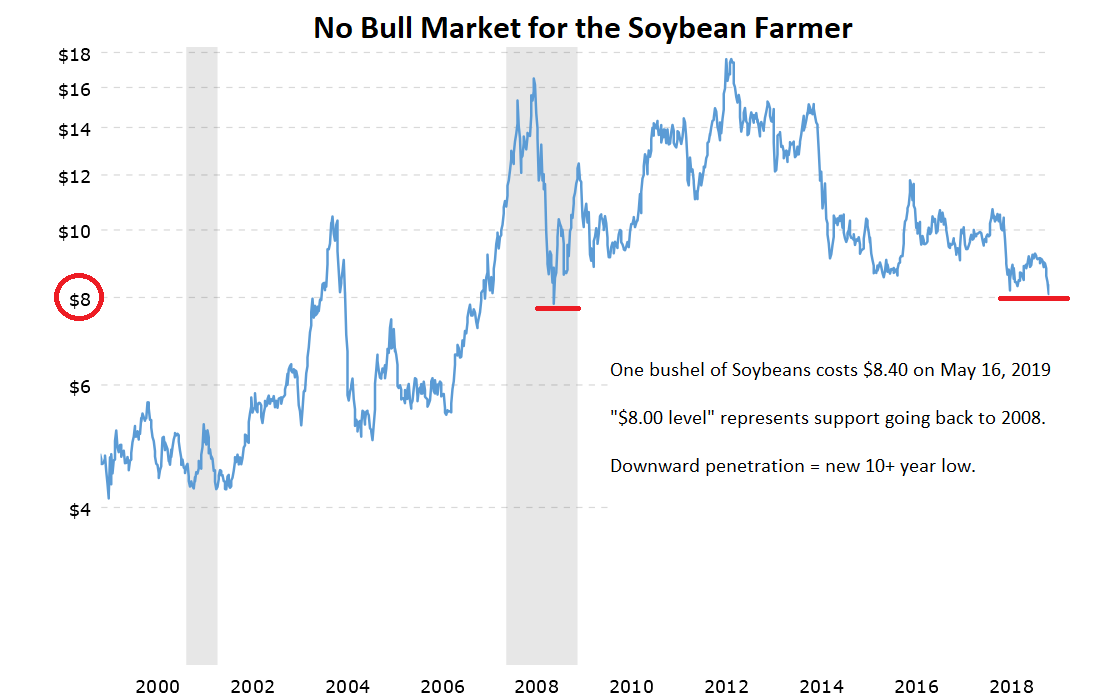
- China agreed to purchase $32 Billion in US sourced agriculture over the next two years.
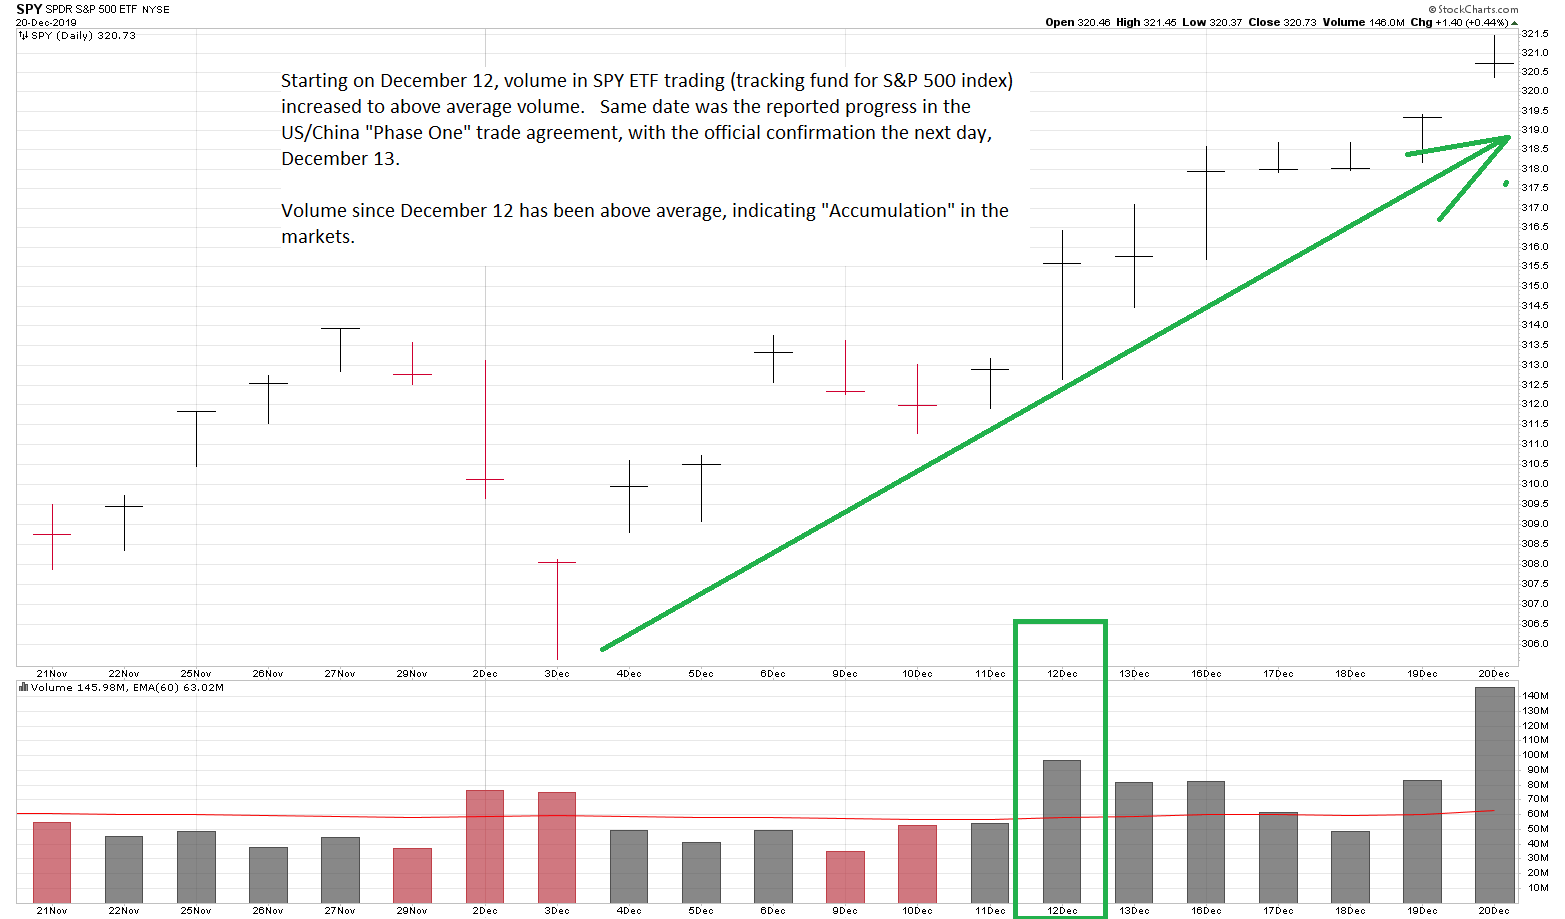
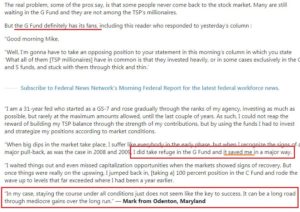
Not surprisingly, the markets responded strongly to this news:
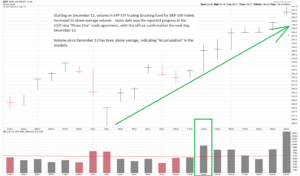
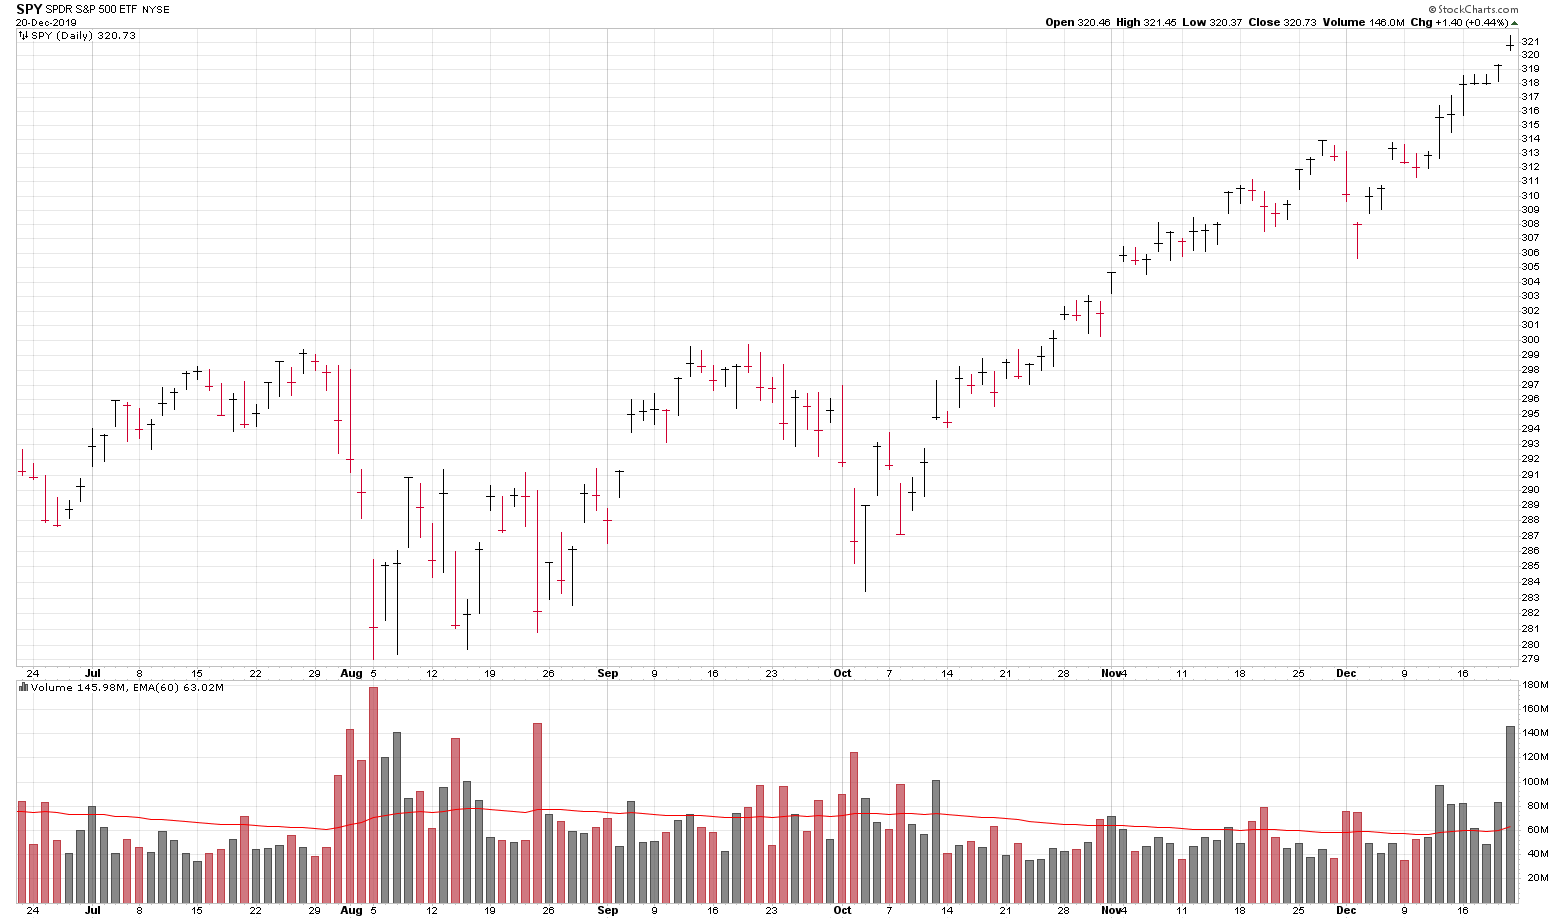
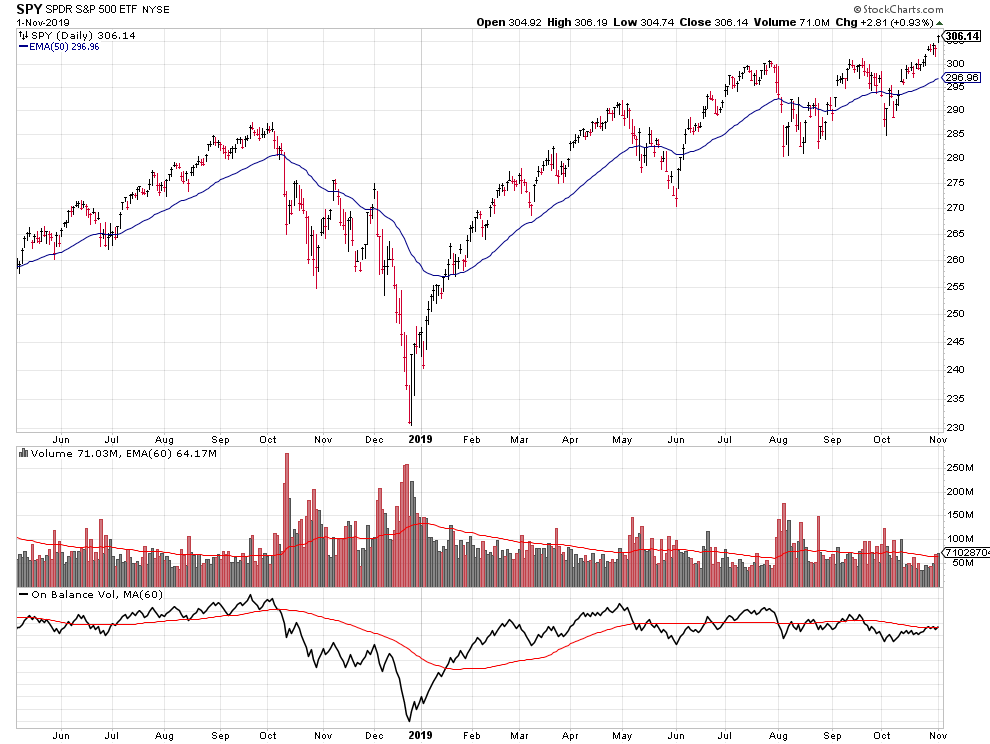
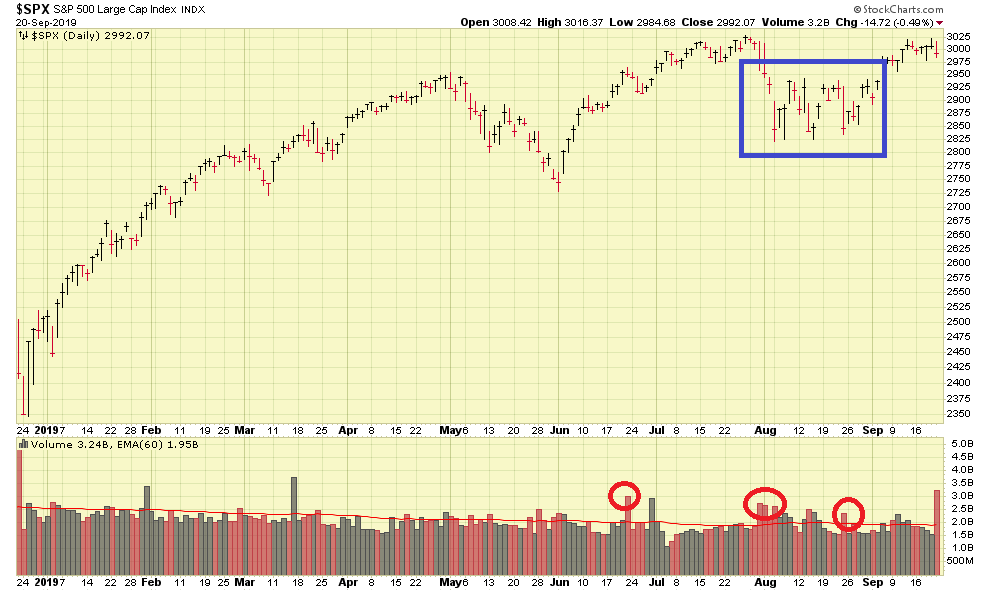
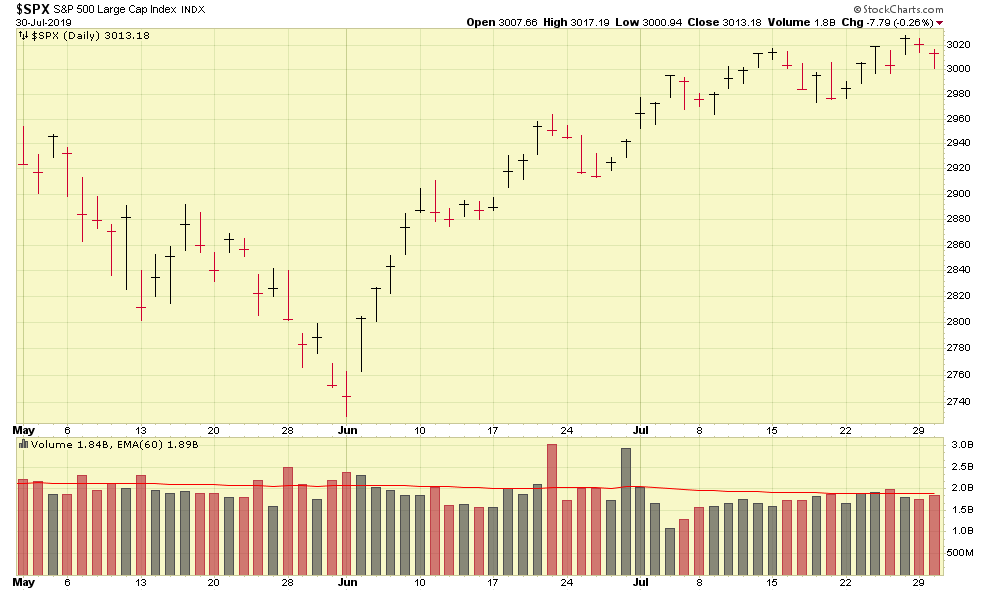
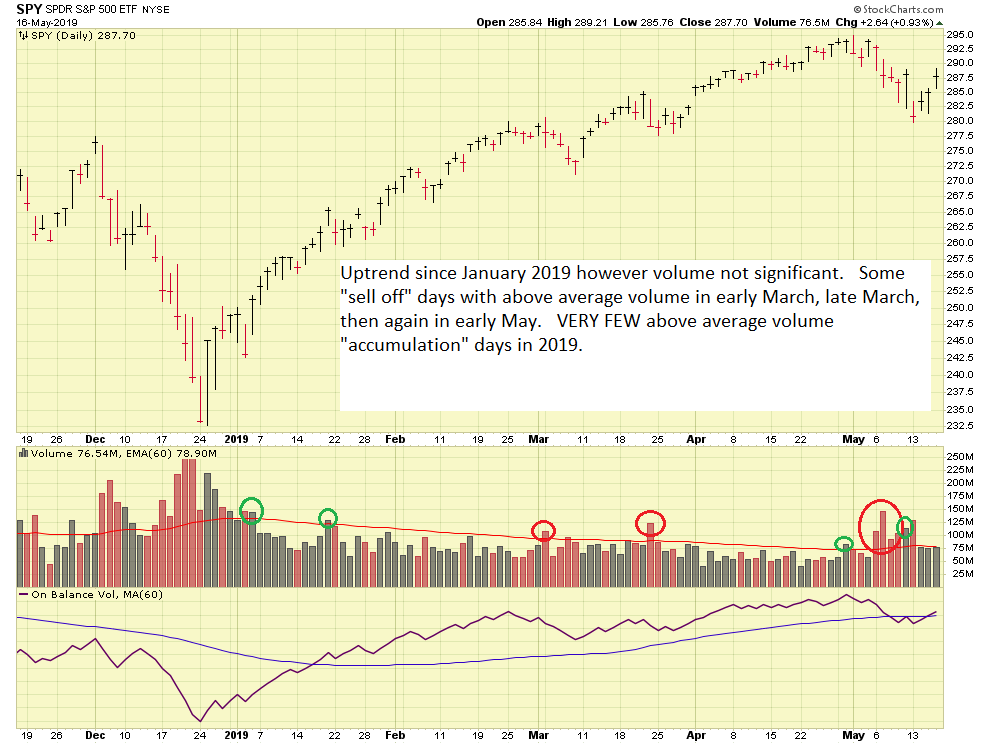
The above image is a one month view of the SPY Exchange Traded Fund (ETF) which is a proxy for the S&P 500. Below is a longer term view:
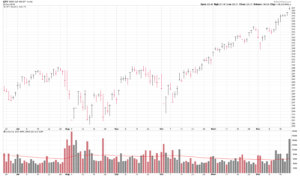
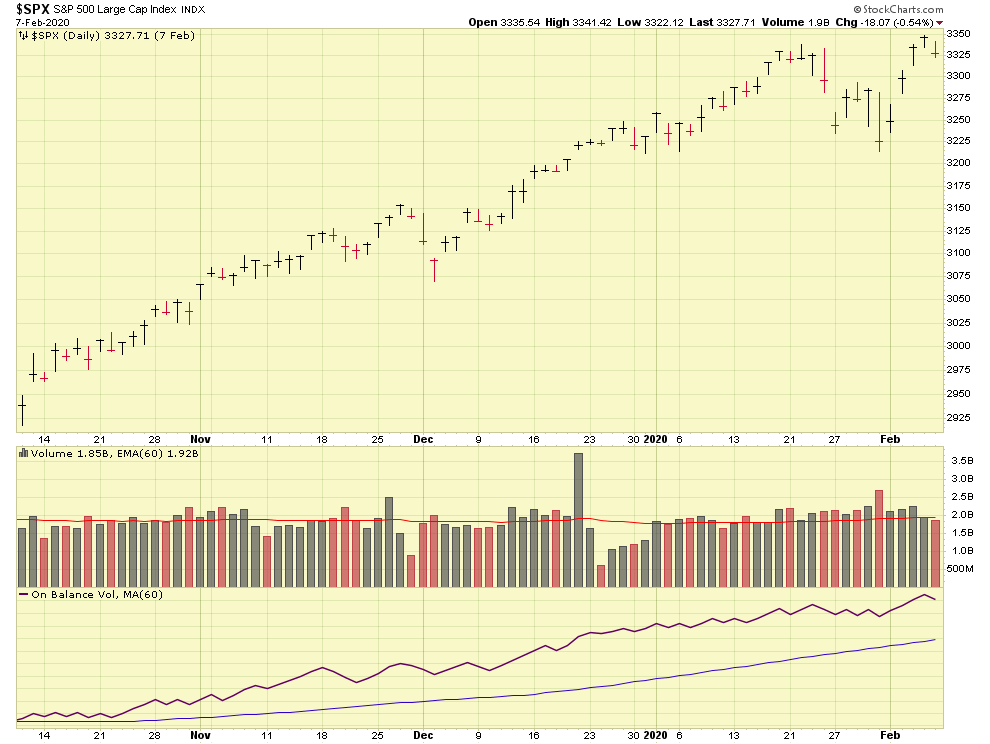
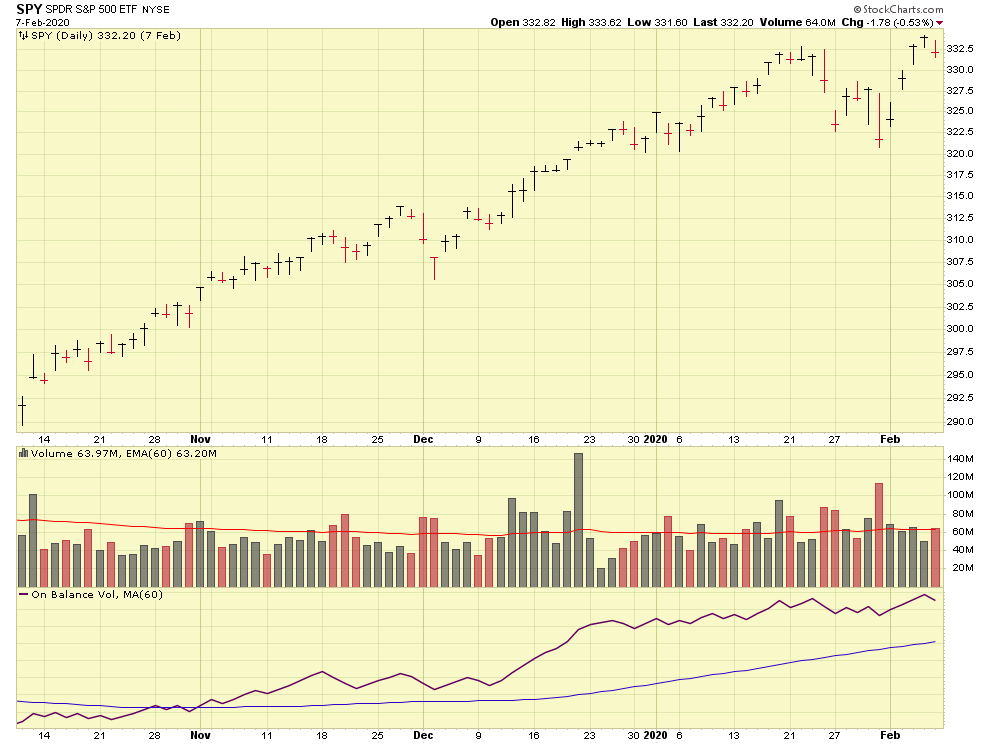
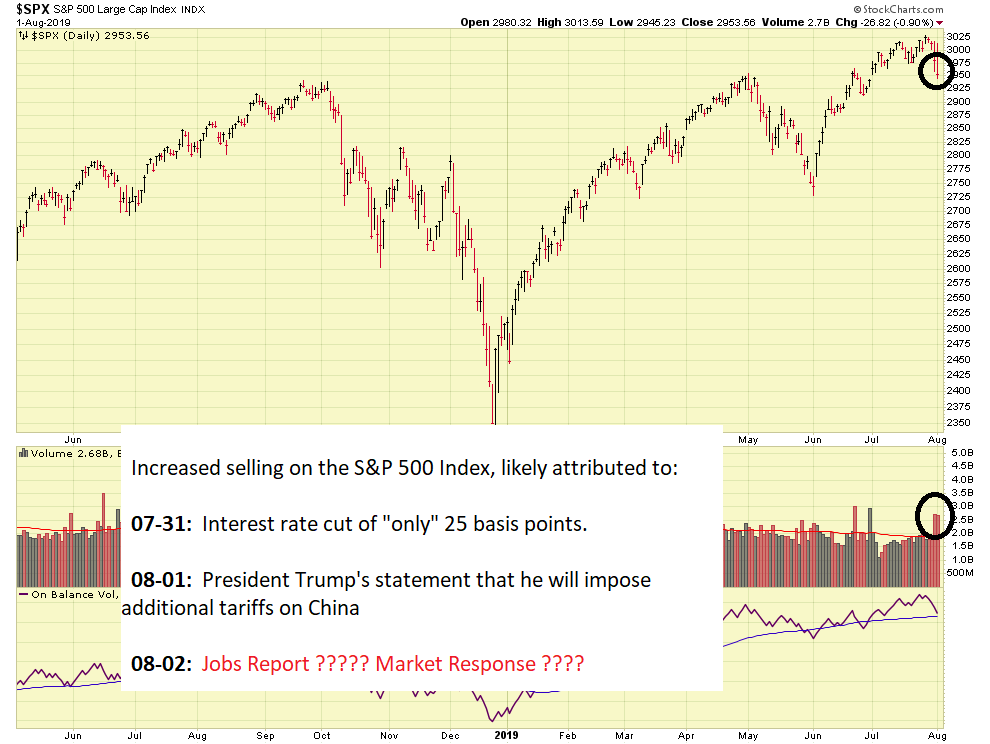
If you take a look at the volume, it is plain as day the fact that volume has increased, indicating “accumulation” or investment by institutional investors such as banks, retirement plans, and mutual funds. Volume “validates” the move of the index or stock in question. Sure, a stock can go up, but what is the volume ? Only with volume can we be confident in regards to what is transpiring.
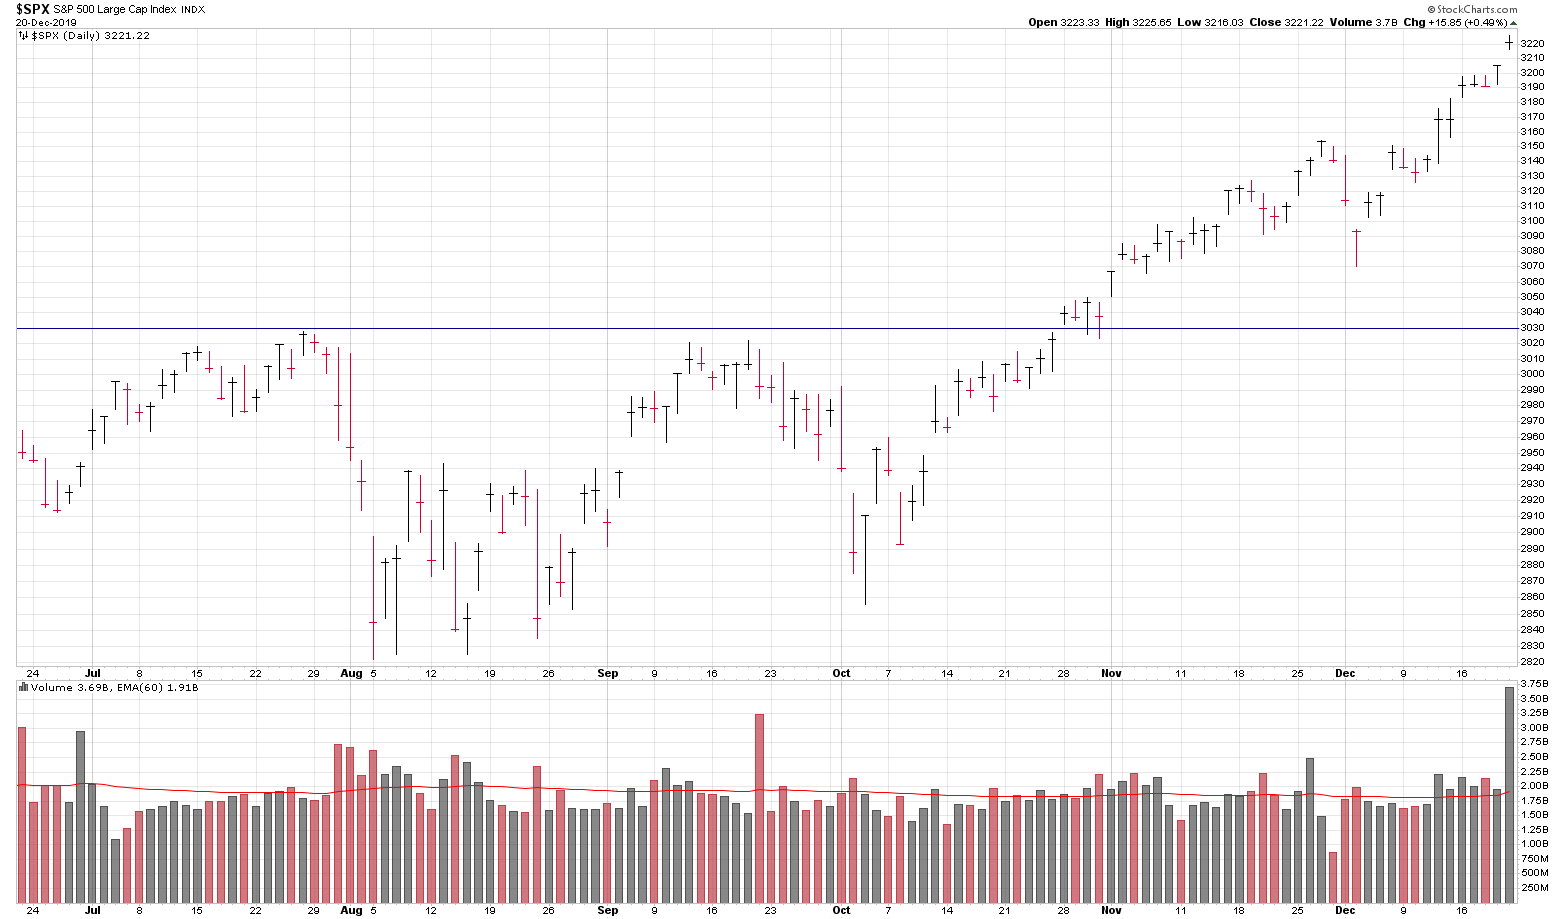
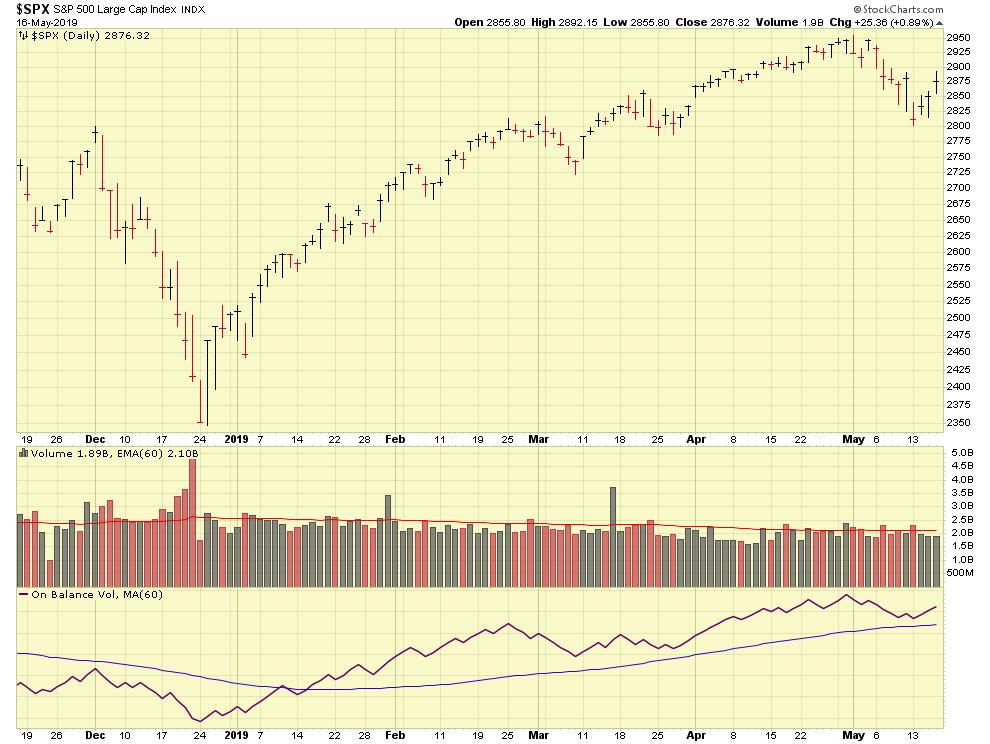
A look at the S&P 500 index below, reflects that the “recovery” began the first week of October, with a new All Time High being attained on October 29. Volume was occasionally above average, I attribute this to nervousness associated to the then-looming US/China Phase One trade talks.

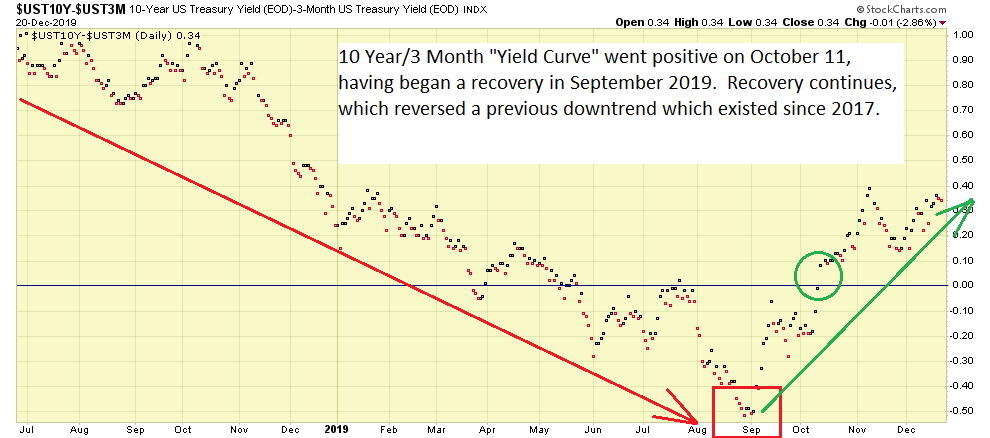
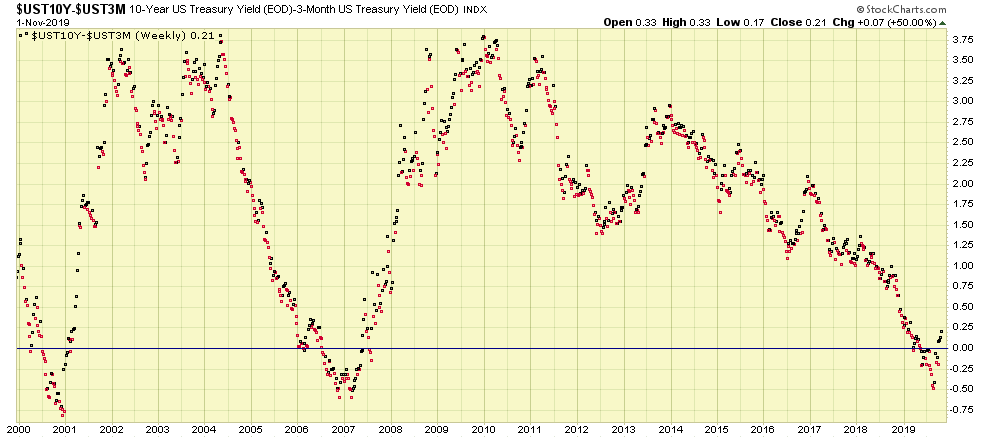
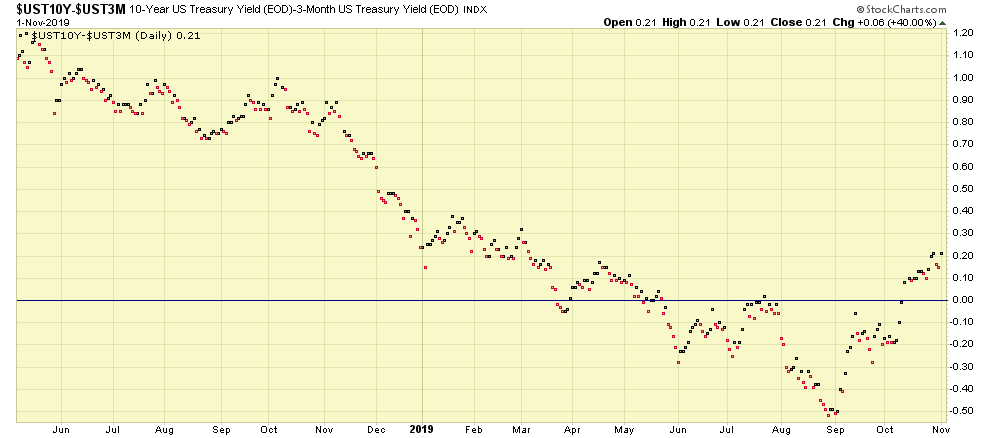
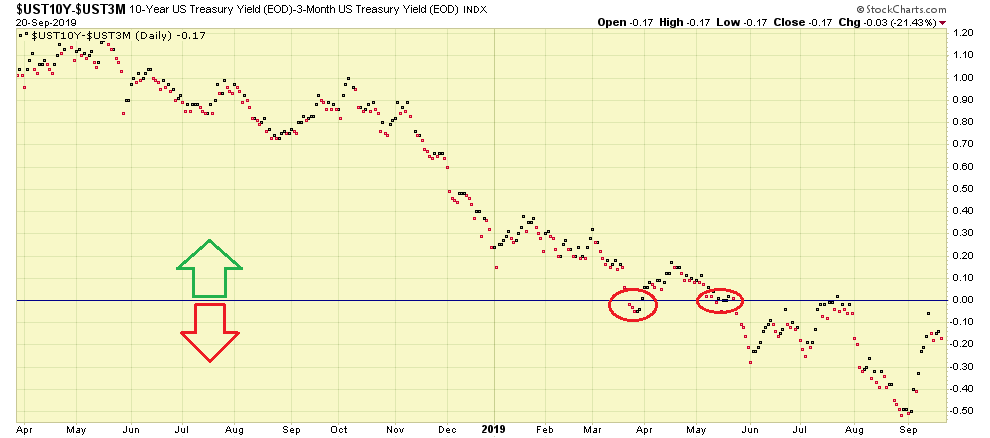
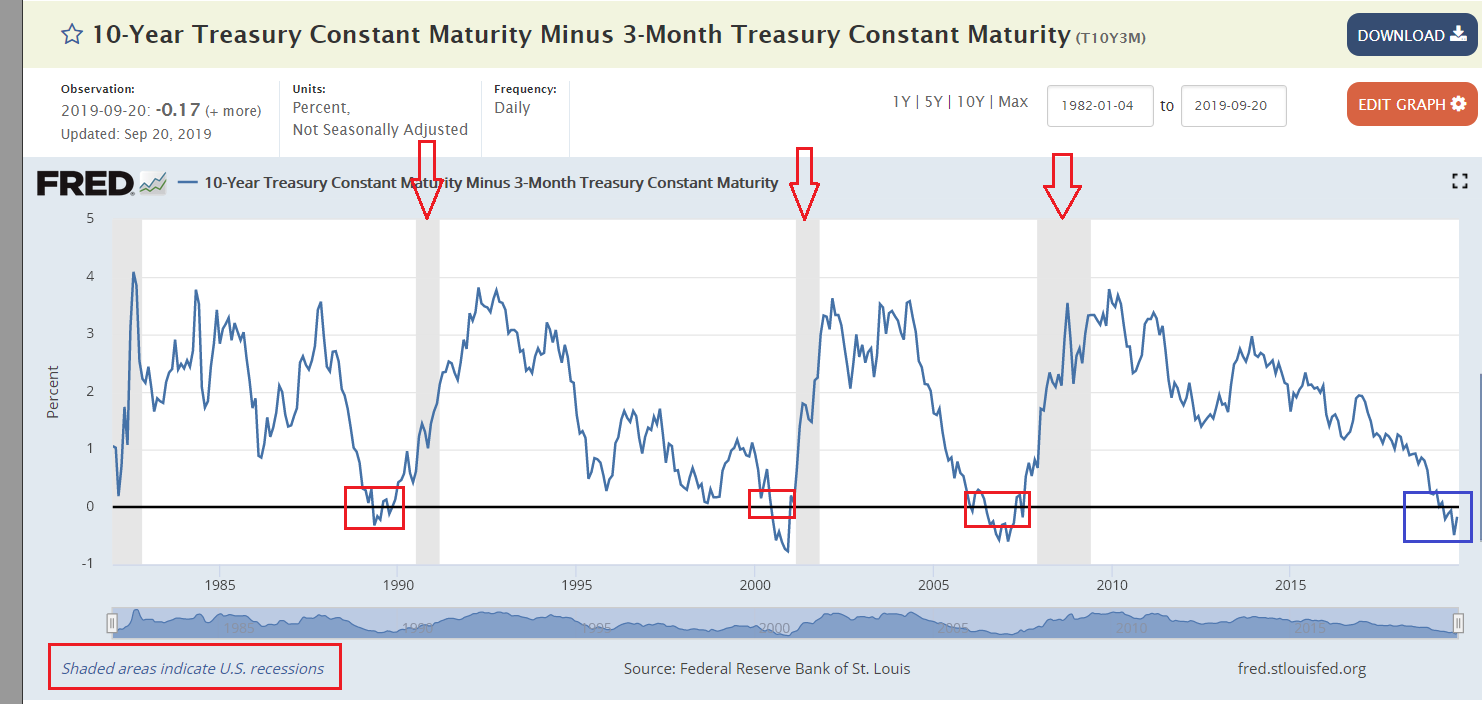
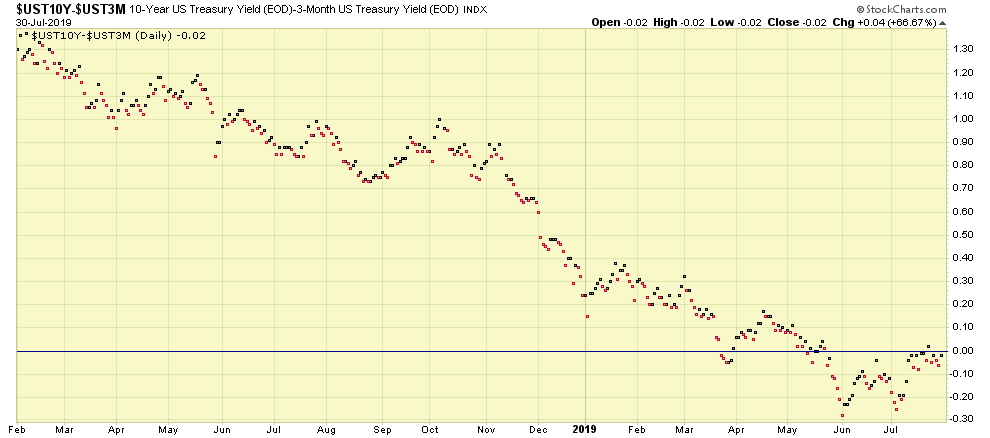
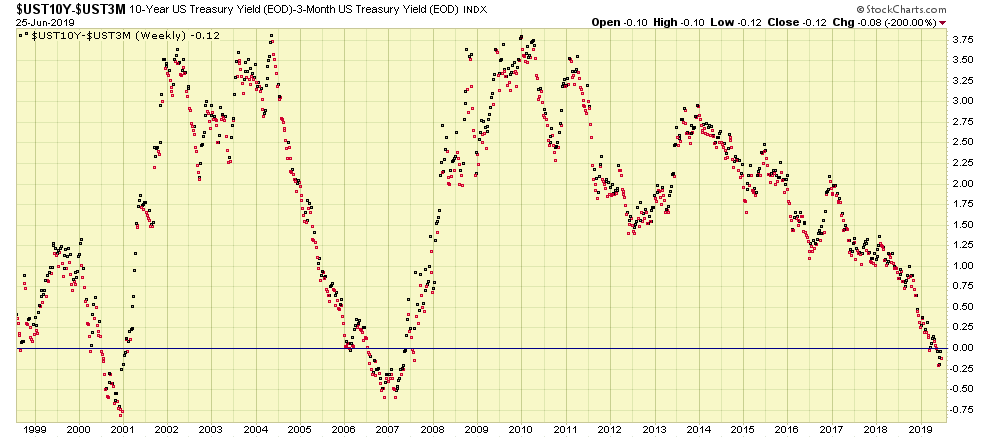
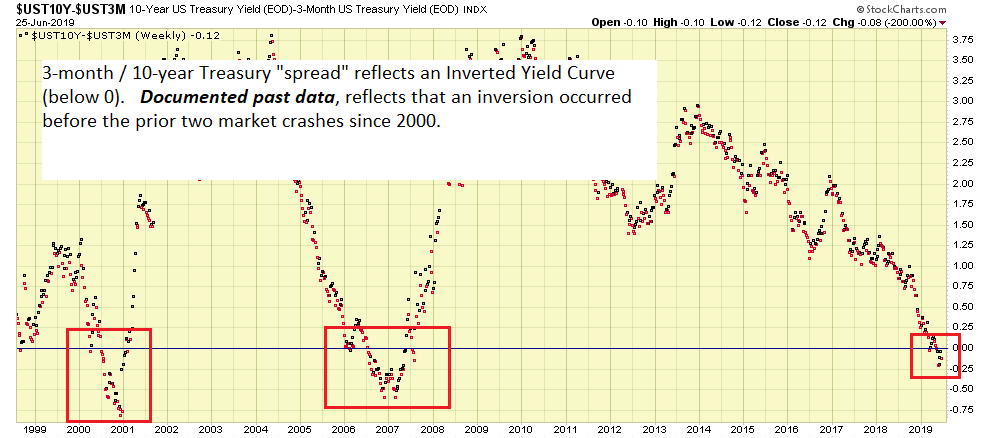
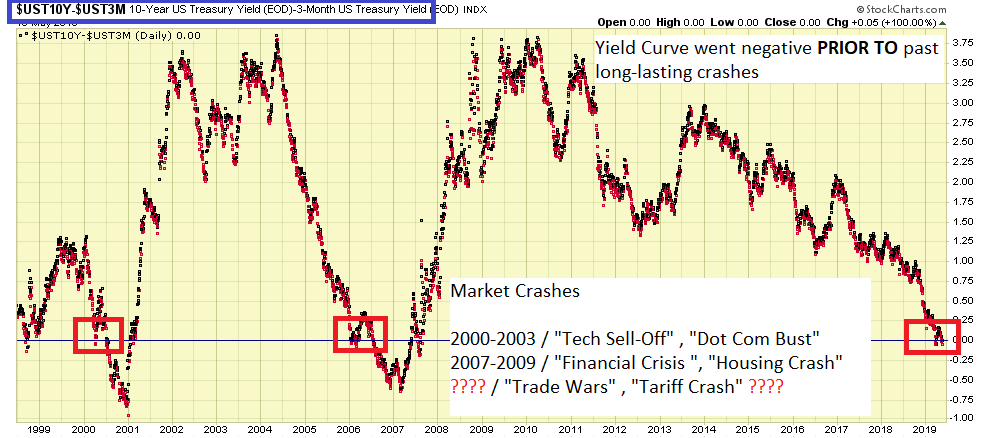
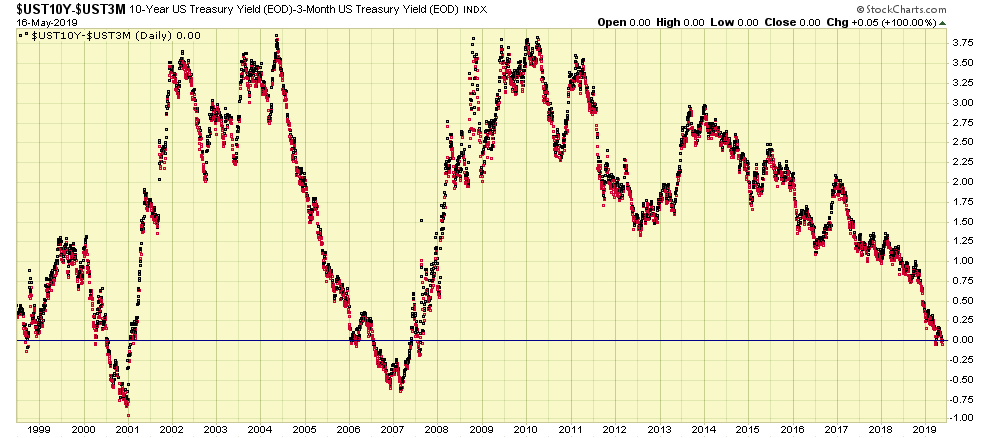
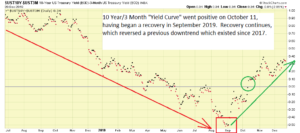
The Yield Curve, with a proven track record of forecasting recessions and bear markets, has also recovered. It was “negative” all year long, and went above zero, into positive territory on October 11:
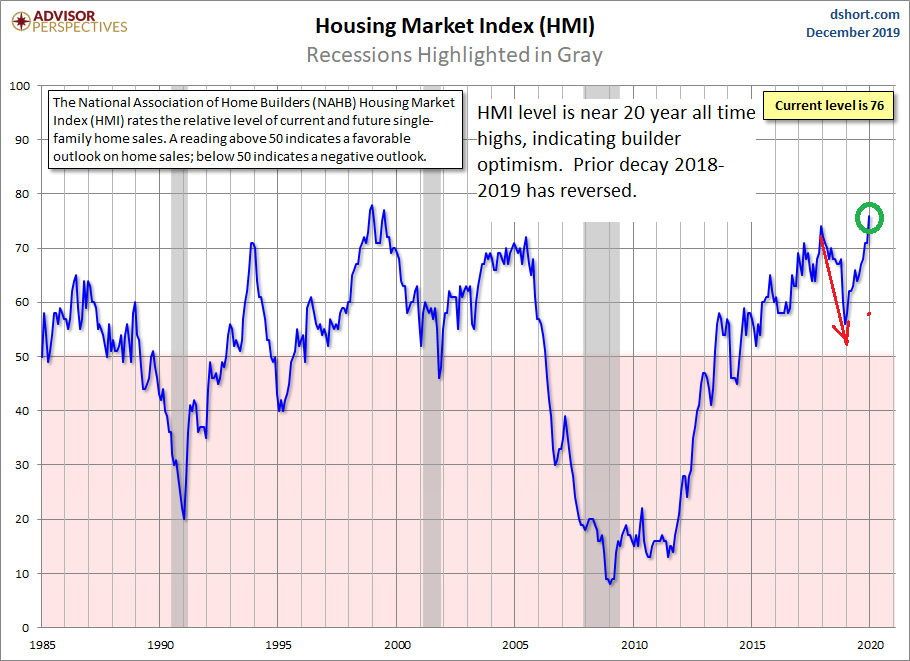
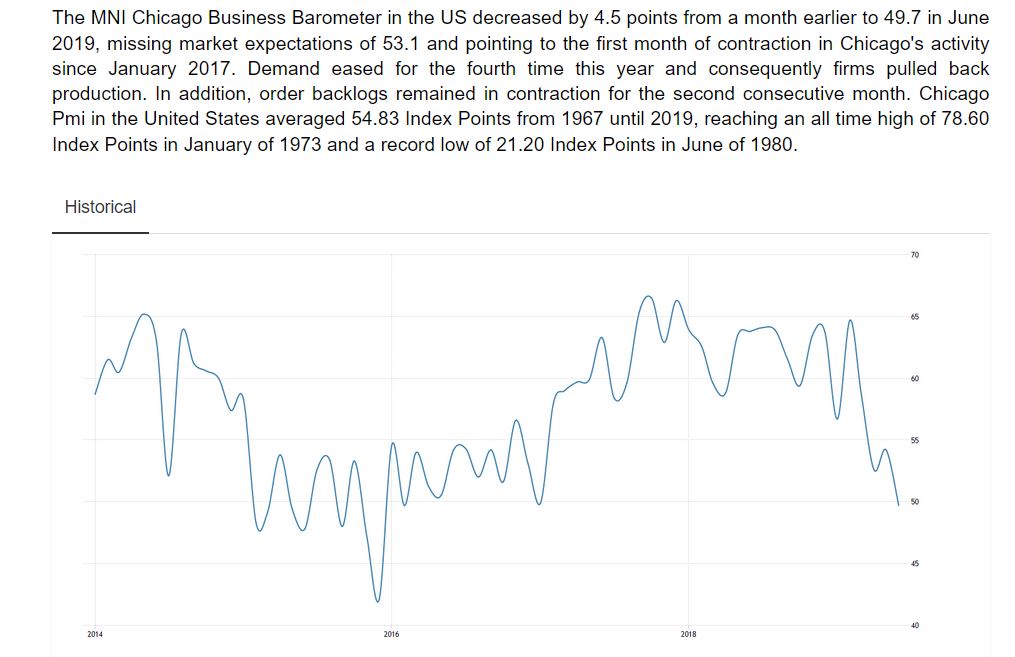
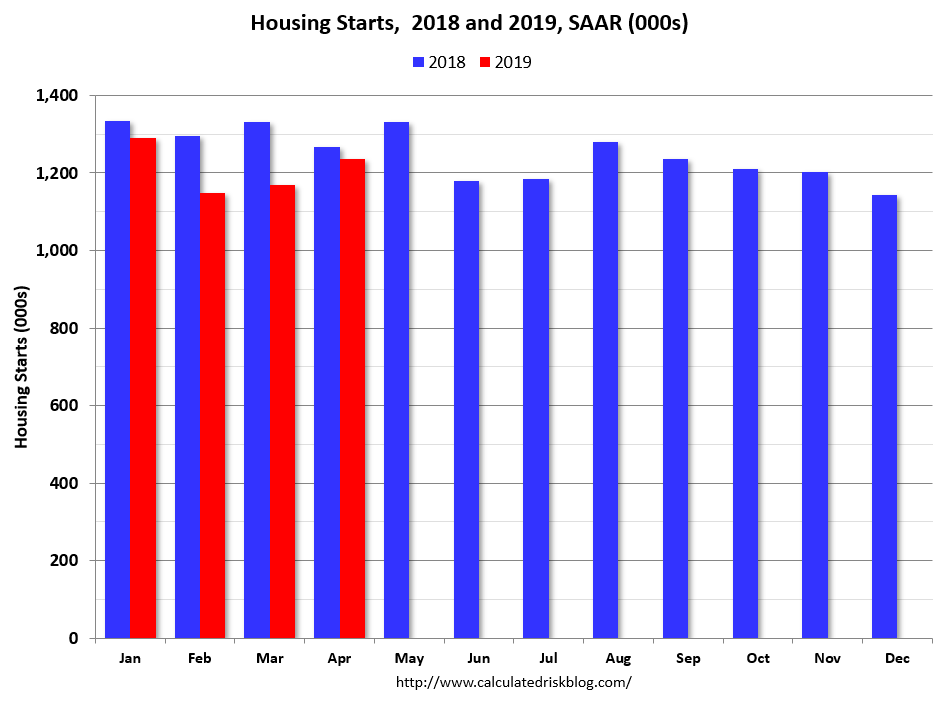
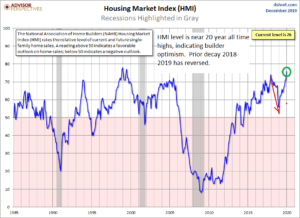
Another barometer used to assess the health of the economy is housing data, more specifically, the Housing Market Index (HMI). This too, has come off a recent downtrend and has made new highs. The HMI is an assessment of home builder sentiment regarding the real estate situation:
So we now have multiple positive indicators and news that supports my theory that stocks will continue to go higher, with the S-Fund and C-Fund being the likely best performers in the coming months. With that said, allow me to talk about an investment strategy called “Market Timing.”
Some have asked me if my approach to the TSP and investing in general falls in the realm of “Market Timing.” A variety of definitions exist regarding this strategy, most state that market timers use charts, indicators, and other seemingly witchcraft-like methods to try to buy the low, and sell the high. Which is probably the complete opposite of how I approach my investments: I prefer to buy the high, and hold it forever, only selling (ideally higher) when a certain criteria is met, and free of emotion. I liken the “buy the high” approach as being akin to buying a college football player: If your “indicators” include the award of the Heisman trophy, the SEC player of the year, and the College All-American award, and the player is a college senior, you are “buying high” in stock market lingo (the player has basically won every award possible, and is in his last year of college) but you know this is “just the beginning” of something great. Nobody in his right mind would say “don’t buy that player, he has already done everything he can do.” But that is what 80% of investors do. They try to look for that cheap, bargain basement stock or investment, and time things so that they sell it when it goes higher. Good luck with that.
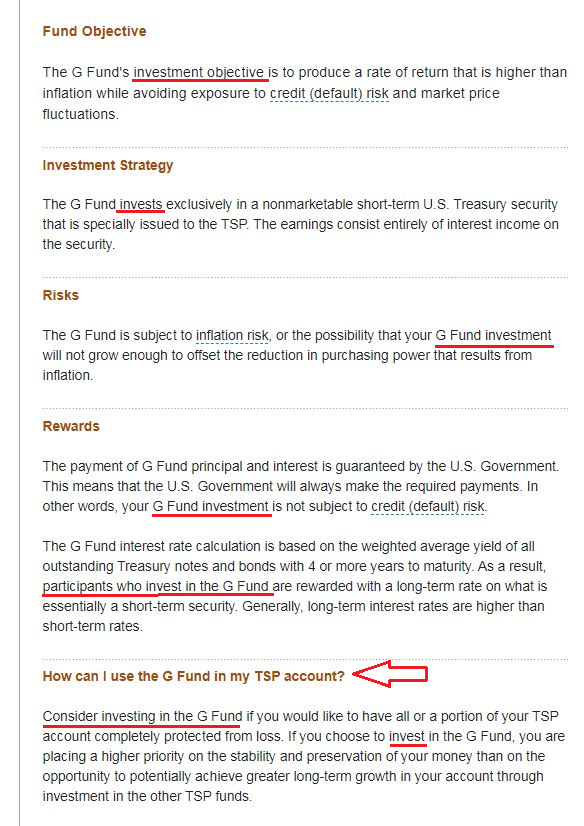
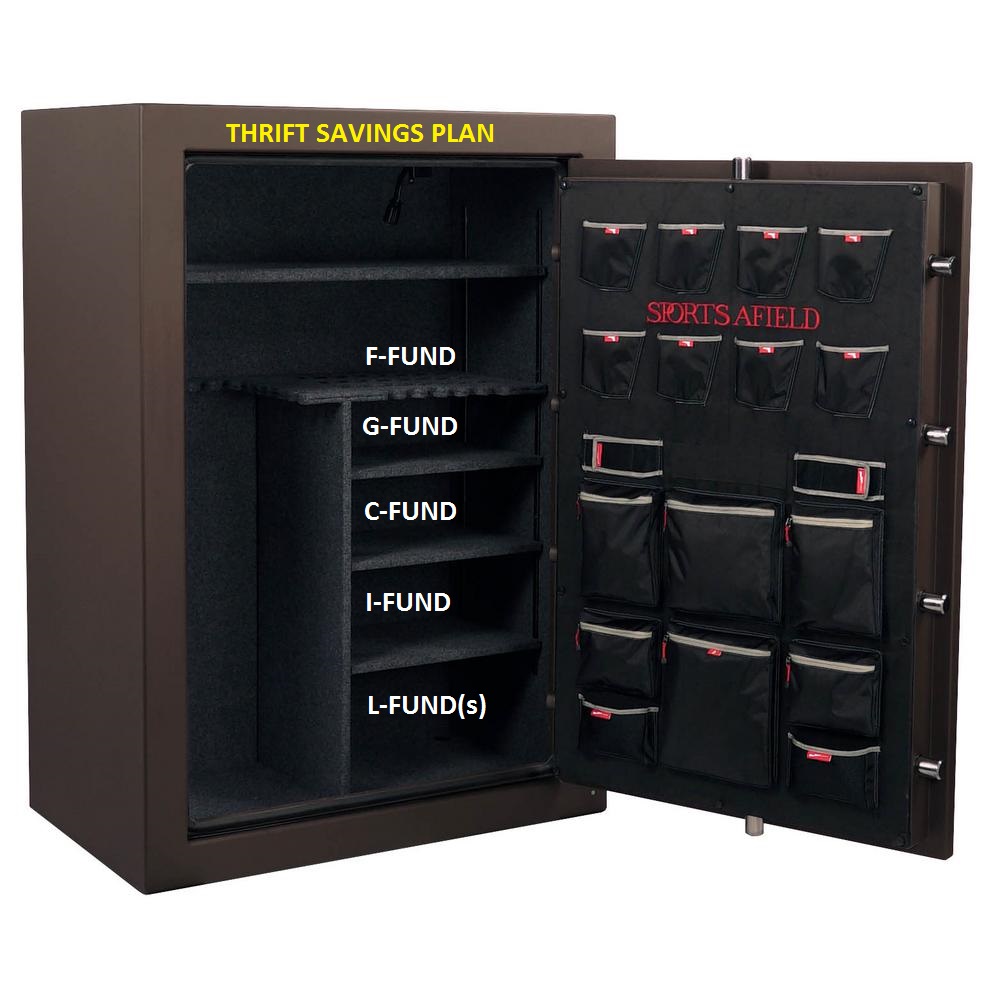
This brings us to the TSP itself. The TSP is simply a box, a container, that contains your retirement money, all of which is always invested in something. Wait, what ? “Always invested ?” First time I have heard that you say ? There is no “cash option” in the TSP, there is no “cash out my funds and put the money aside” in the TSP. The closest thing to this is the G-Fund. But the TSP themselves (not me, the TSP says this…) considers the G-Fund an “investment”:
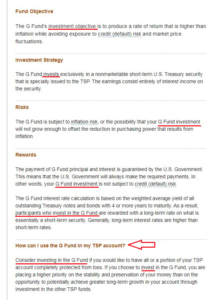
Thirteen (13) times on the above page alone, the G-Fund is referred to as an “investment” by the TSP (not by me, I did not invent this concept…) themselves. Furthermore, they come out and say: Consider investing in the G Fund if you would like to have all or a portion of your TSP account completely protected from loss. Wow, pretty powerful stuff. Again, the TSP, not me, says this.
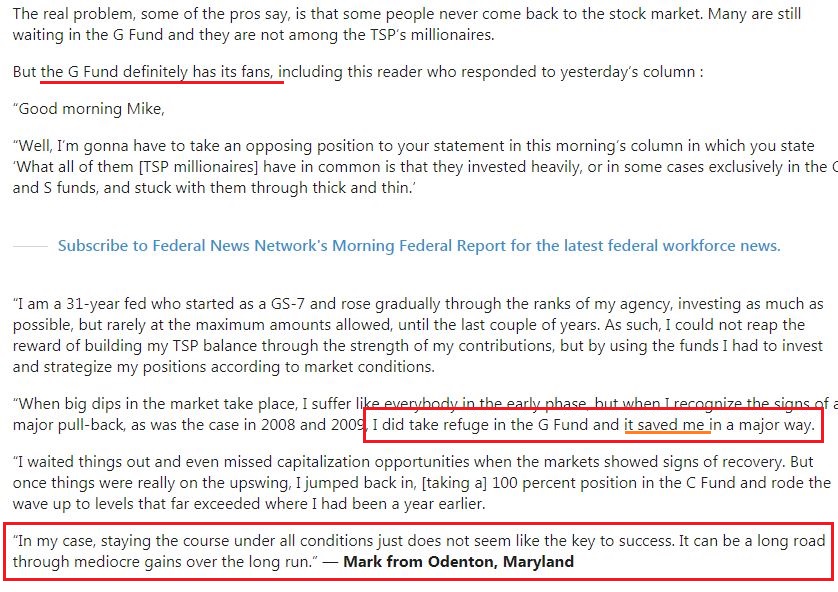
Did you know that a few of those TSP Millionaires actually use the G-Fund as part of their strategy? Here is one:
Once your retirement money goes into the magic container called the TSP, it must be placed somewhere inside (this is called allocation). It cannot be accessed from this vault (absent severe penalty) until retirement from the federal service, and even then, depending on what age you retire and some other things, additional provisions may exist. What the TSP looks like, in my mind:

In summary, if you are in the TSP, then like it or not, you are invested in something. If you are in the TSP, you are spending time in some market, be it international stocks, bonds, small cap stocks, or short term Treasury securities. In the TSP, you are in “a” market, somewhere. Which finally gets us closer to this website, and my philosophy. There is no doubt that I use technical analysis (charts, etc.) in my investment process, but it is not done in a vacuum. I also use fundamental data and information to help orient my compass in regards to the health of the economy. GDP, CPI, PCE Inflation, Housing, and other information is used to complement the charts. It is my opinion that asset allocation choices should be made using data and information, and not emotion. I would not invest in the I-Fund, which mirrors the MSCI EAFE index, if all of Europe was bankrupt and my charts were not favorable. Maybe someone else has a crystal ball, and can market-time themselves to European riches, but if my personal information sources are not favorable, then I am not doing it. Remember: If you are in the TSP, you are in a market. And time in the market results in financial success. The risks along that path to success are different, depending on what fund you are in.
A few TSP advisory sites have come and gone over the years. Note that this site is not a TSP Advisory site, it is a “What Bill Pritchard is doing with his TSP, and why” site. In any event, subscribership continues to grow, year after year. I hope that by sharing my opinion regarding the TSP and the markets, it helps shed light on things and expands some folks’ understanding of the market.
Thanks for reading, and from my family to yours, Merry Christmas and Happy New Year…
-Bill Pritchard