Good Evening Folks
I am getting beat up a little bit over my recent market pessimism…if anyone wants a rally and loves to grab gains, it is me. However I do not advocate day trading your TSP, nor trying to chase gains, my mantra has always been to look at big trends and attempt to ride those trends for long-term gains. As said numerous times, I use multiple data sources, and tend to ignore “experts” on financial news shows. However, it is hard to ignore the fact that the market has returned strong gains during the 1st Quarter of 2019. A humorous observation is the group who claims “it is just a paper loss” when they lose money riding a loss deeper and deeper, is the same group that squawks the loudest when they miss gains. “It is just a paper gain” is never heard. Just a data point for today’s post. Before I proceed with my opinion-based analysis (did I say it was my opinion?), lets consider that my opinion is loss protection/risk management is more important than “seeking gains.” A professional coach once said something to the effect of “play your hardest, the scoreboard will take care of itself” (or similar statement). I have a similar approach, protect your losses, however when everything points to gains, indeed lets grab those gains. Lets talk about why I am not presently trying to grab gains…
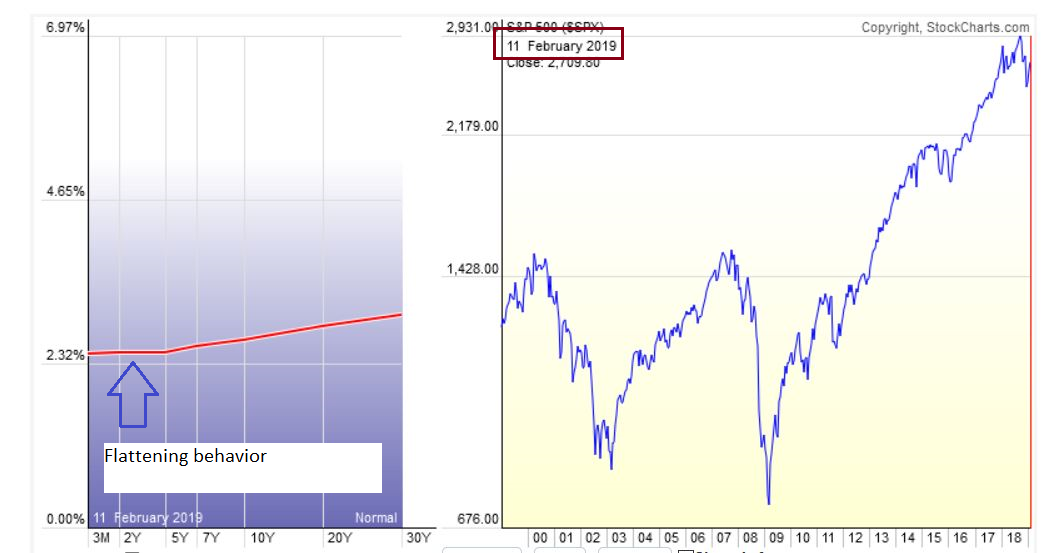
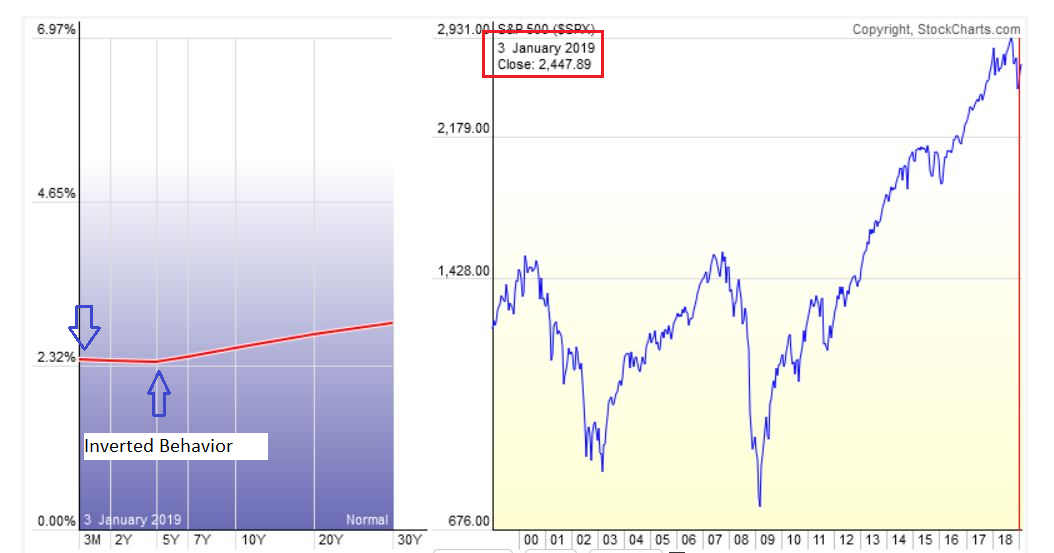
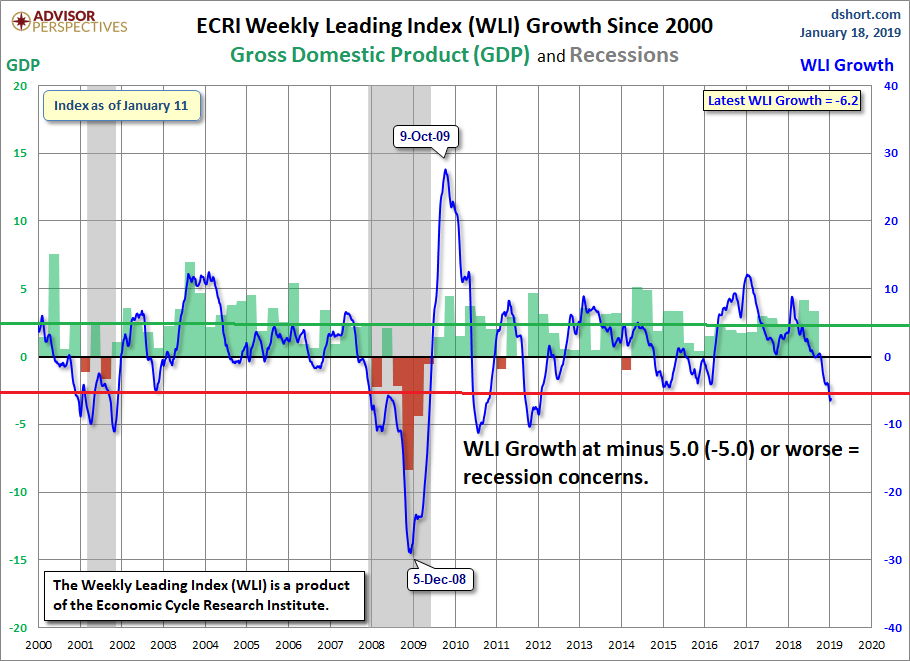
I have mentioned the “Yield Curve” numerous times here…I discussed it back in summer 2018, long before the mainstream press was talking about it. Lets display a graphic image, basically a reading below zero (“0”) is an inversion of the yield curve (based on 10 Year Treasury Yield and 3-month Treasury Yield). When this occurs, it is believed to be an early warning signal for a recession ahead, with a “lead time” (signal time to actual event) of 6-18 months. I have blue-boxed the “stock market crashes”, and red-circled the yield curve inversion. This is weekly data on the chart, to allow a good snapshot back 20 years. As you can see, we back close to the inverted level (we had a day or two of inversion last week but it soon recovered).
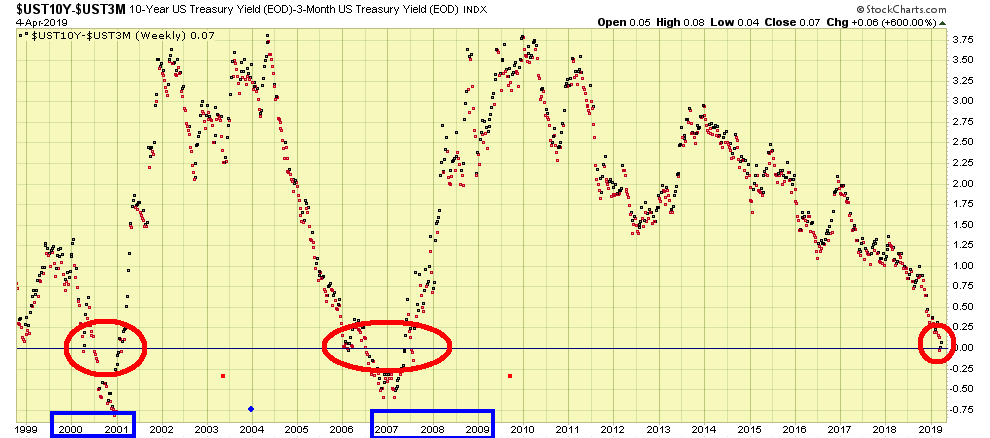
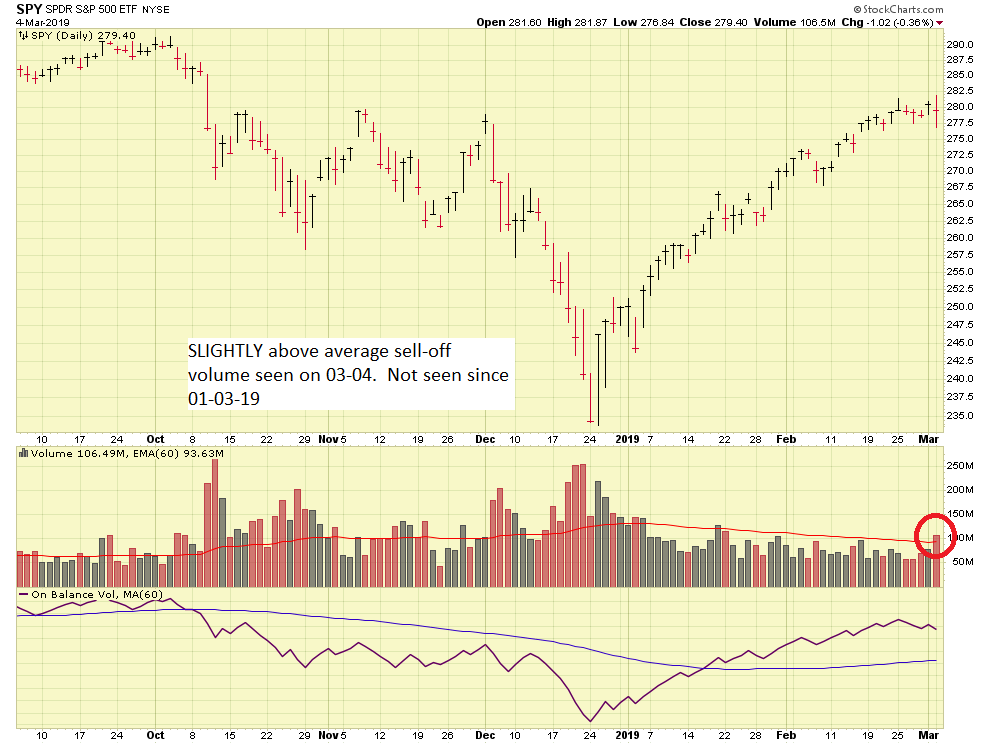
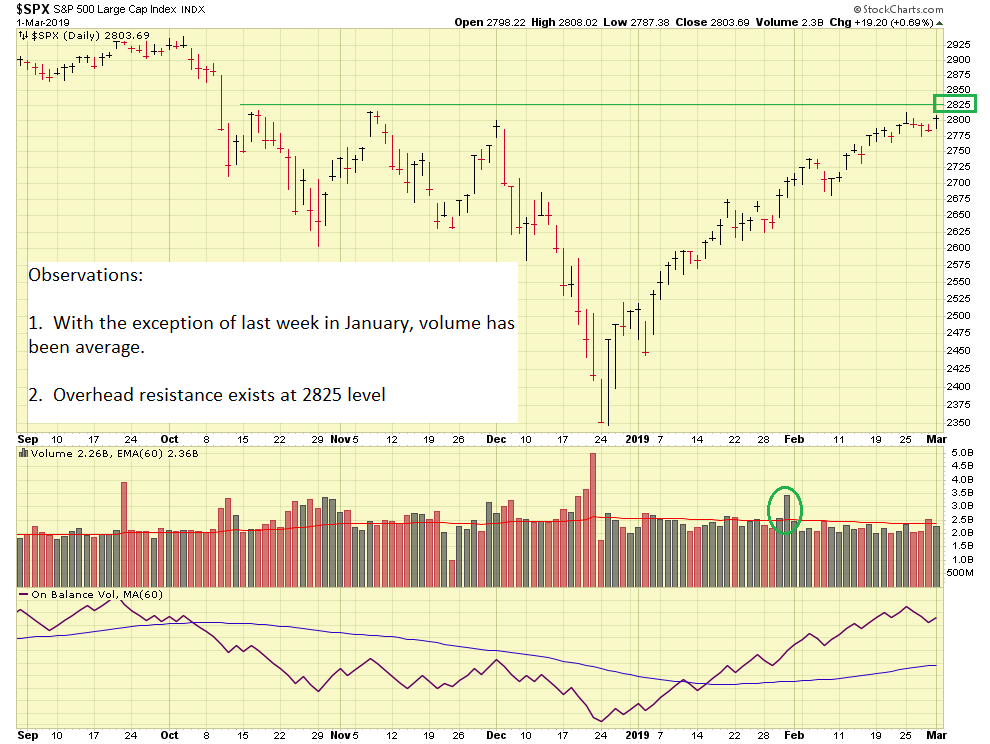
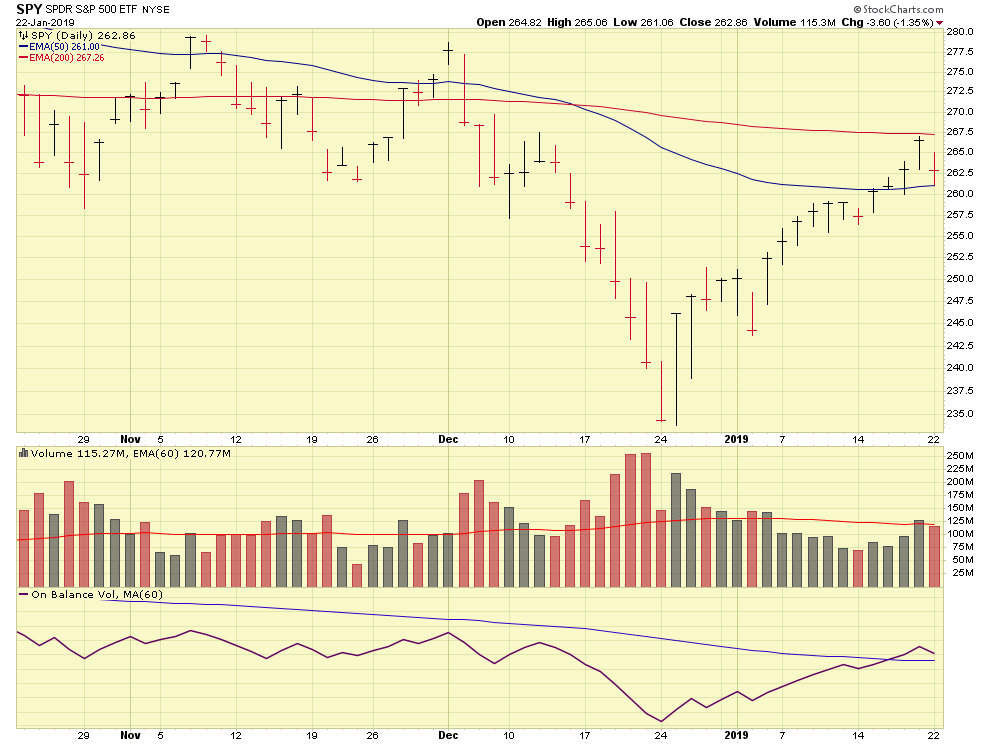
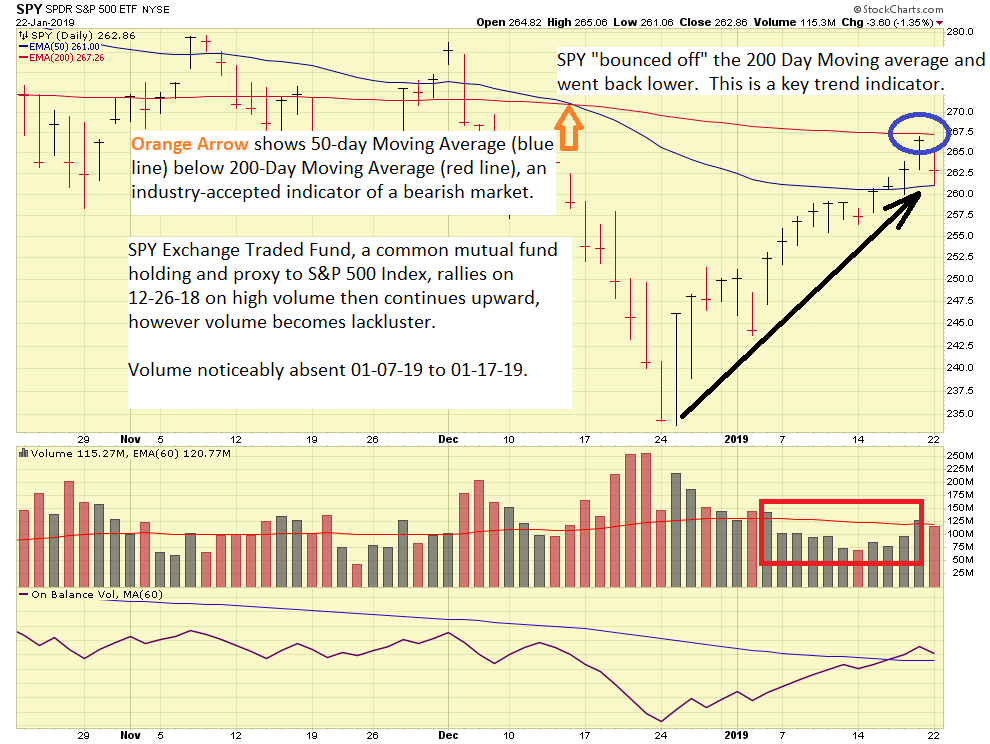
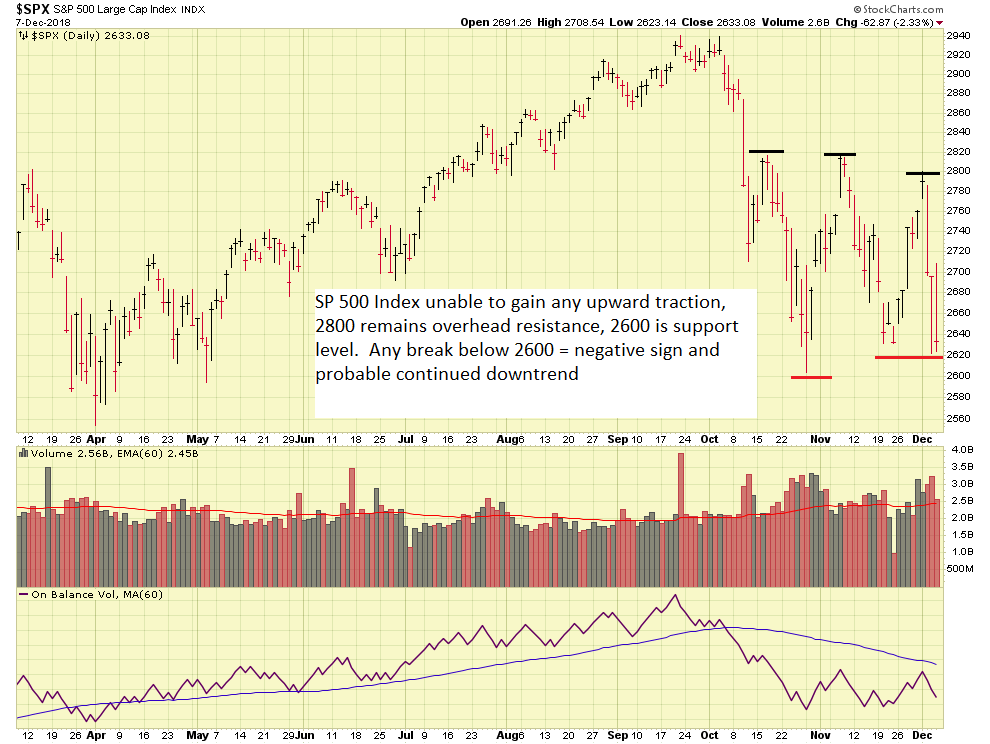
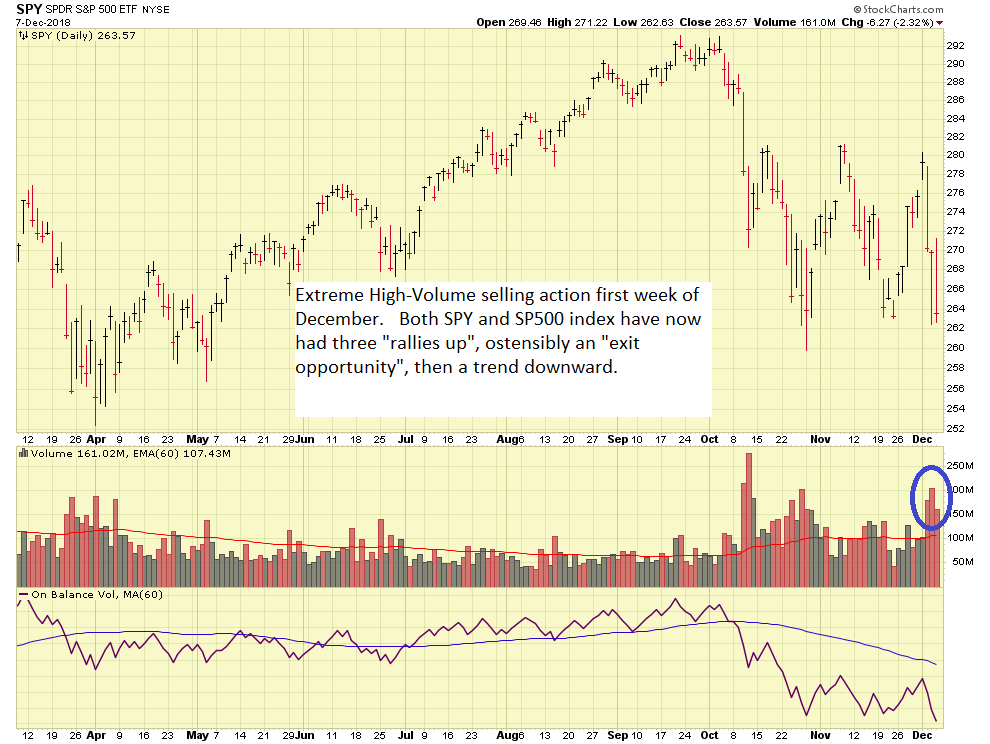
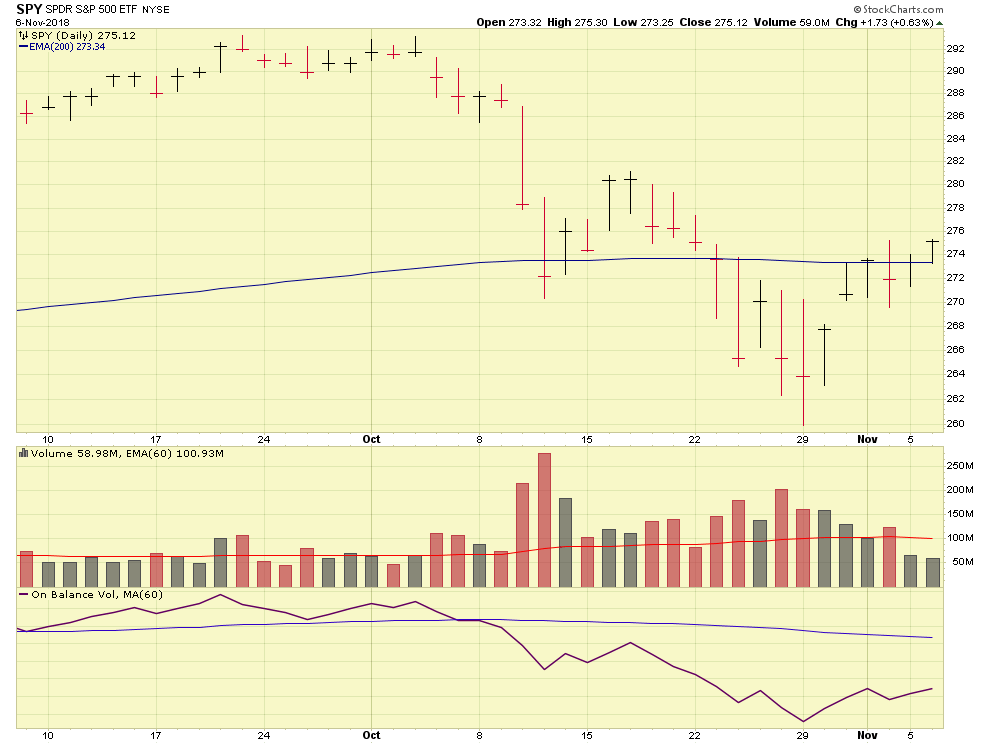
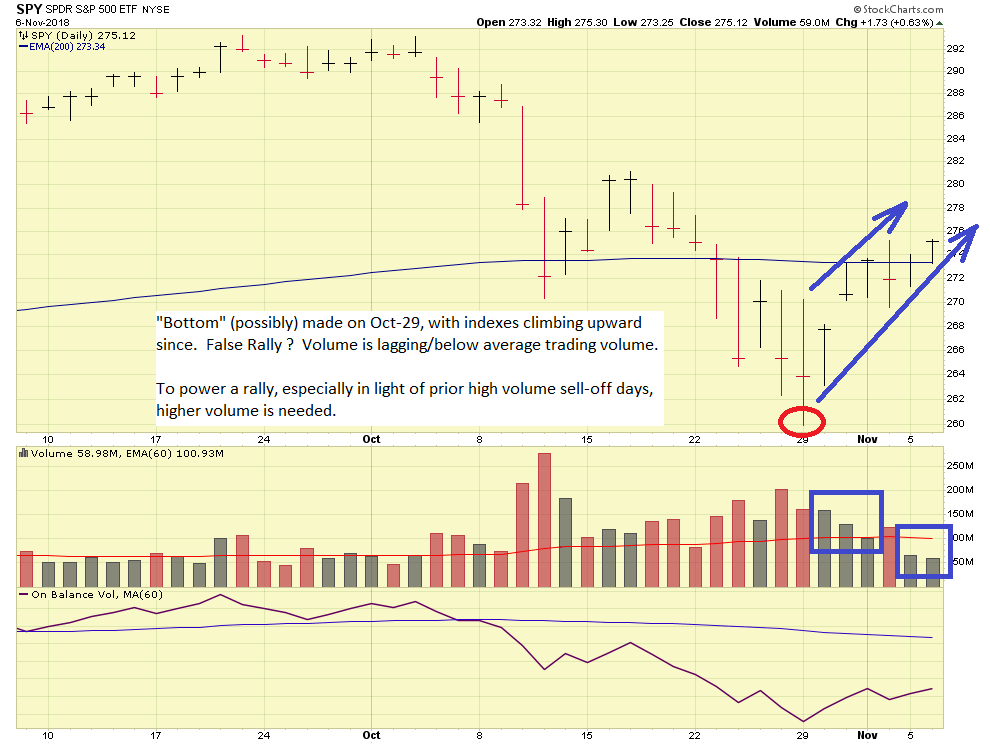
Some say “things are different now” (we hear teenage children say this too…) but I am not so sure. Studies have shown that the Inverted Yield Curve has a reliability of 85% in predicting recessions. This is just one tool in the tool box, so lets take a look at the SPY Exchange Traded Fund, a proxy to the S&P 500 Index:
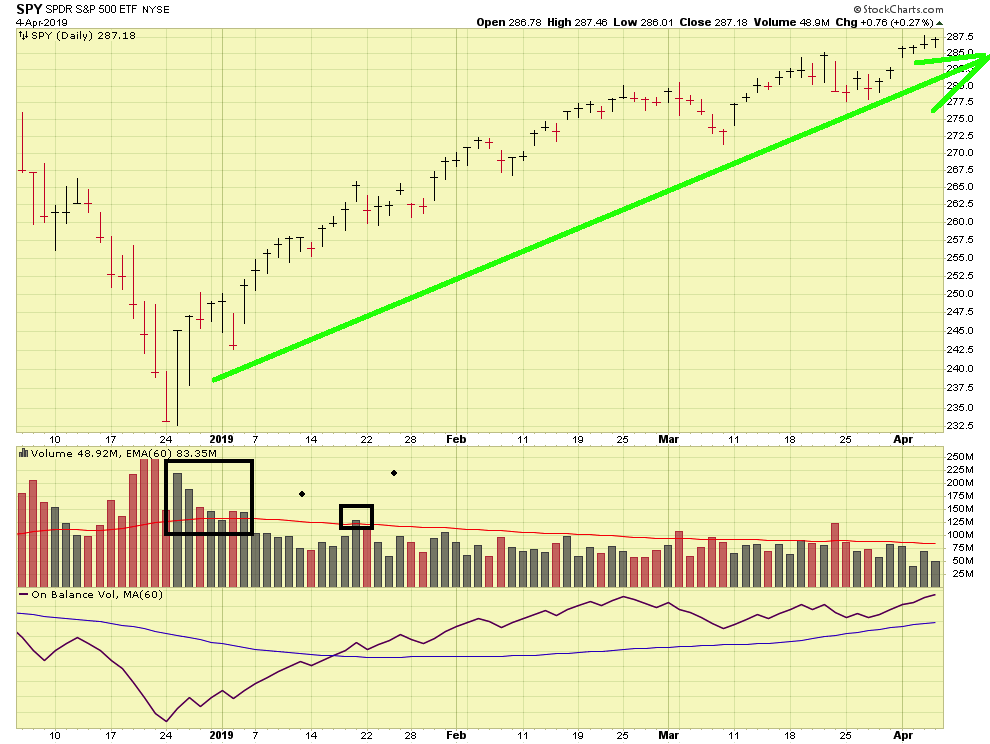
As is clearly evident, we have had a strong rally since January 2019. Should I say that again ? We have had a strong rally since January 2019. However if we look closer at the volume action, we can see above average volume only when the rally kicked off, then volume subsided after that. Without volume, any hiccup or small problem can derail a rally into a damaging (to accounts) new downtrend. If I had seen some solid, credible, volume since January, I would probably be back in stock funds now. Yes, the SP 500 is above my previously mentioned 2825 level, but without volume to act as a safety harness, I sure hesitate to start walking across the canyon on that tightrope, even if I will get rich doing it. Yes, markets have rallied strong (did I say that already?).
Moving forward, some big issues are still pending. The biggest topic is the US/China Trade Agreement. Today, April 4 2019, Mr. Trump met with Chinese officials at the White House. This meeting was subsequent to a trip to China by Mr. Trump a few months ago, and after last week’s visit to China by chief trade negotiator Robert Lighthizer. Note that the March-1 “agreement-done hard deadline” was deleted, in a good faith effort to stimulate discussions. Today, it was announced (basically) that no progress has been made and that numerous issues remain. It is my opinion that the markets will respond negatively if this deal does not come to fruition.
Tomorrow, Friday April 5 2019, the “jobs report” will be released. It is believed that 170,000 to 190,000 non-farm jobs will have been added in March, and that the unemployment rate will be 3.8%. Any major deviation away from those numbers will impact the markets.
In summary, my confidence has not rallied in sync with the market rally. What the market giveth, the market can taketh away, so chasing gains is not something I am doing right now. You, the reader, may have a different perspective (or risk tolerance), and you clearly should invest your TSP as you feel appropriate. Possibly this site has provided a different point of view or perspective on your investment roadmap, I hope it has- raising awareness and increasing knowledge about what impacts the markets is the whole idea behind this site.
With that said, my personal TSP remains 100% G-Fund.
Thank you for reading….
-Bill Pritchard