Good Evening
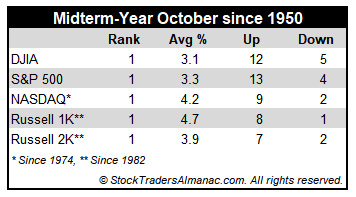
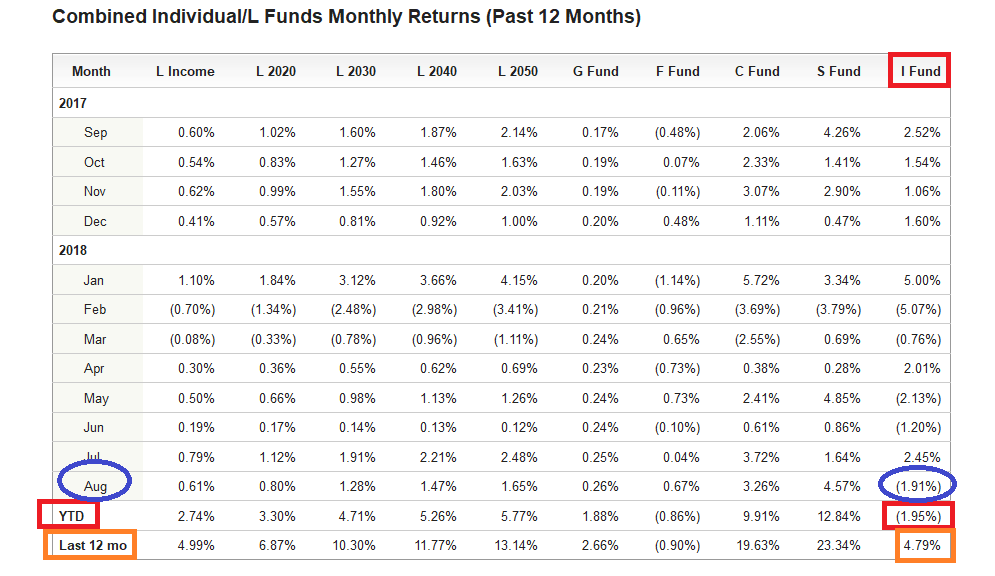
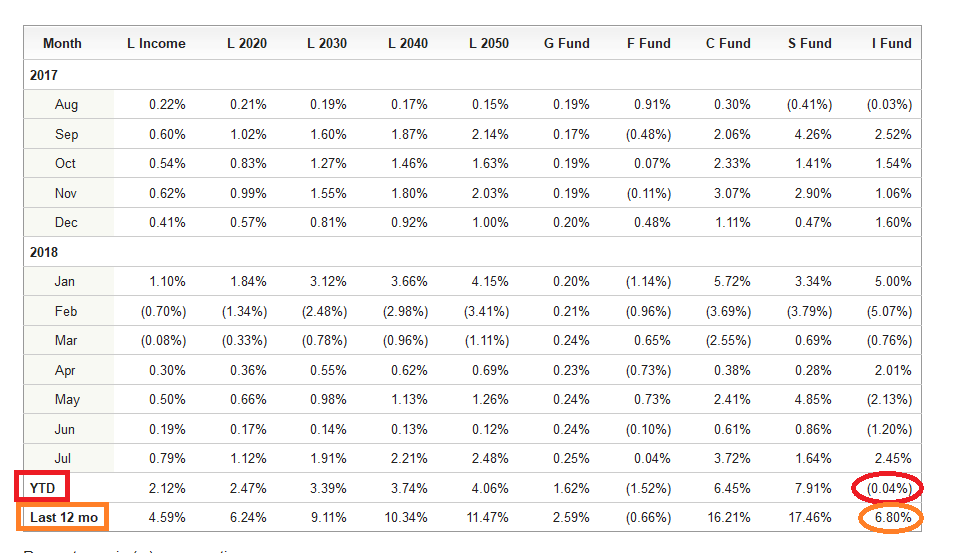
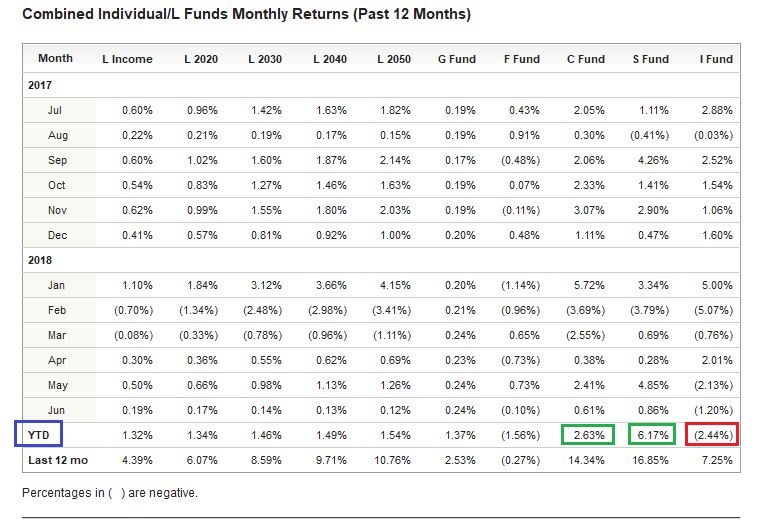
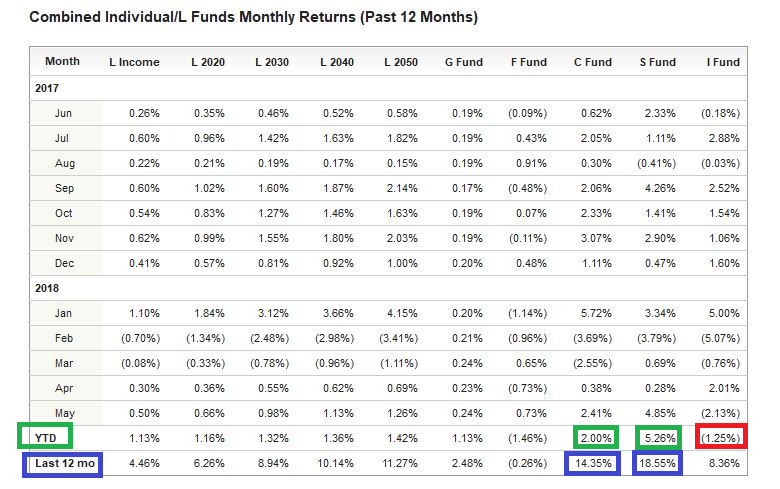
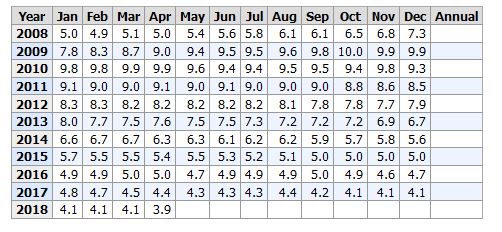
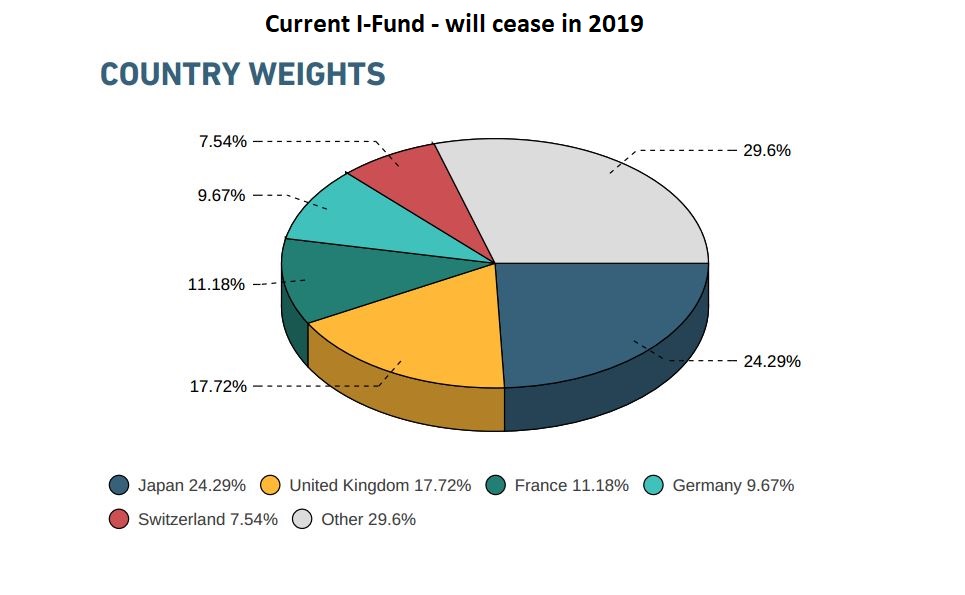
Thankfully, October 2018 is now behind us. A month that historically is a good month, closed in the red, with the SP 500 having its worst monthly loss in seven years, all in a month that should be up. TSP Fund Returns reflect that all funds, except the G-Fund, closed in the red. On a 12-month basis, the only negative fund was the I-Fund. On a Year to Date (YTD) basis, the worst performer was the I-Fund.
My opinion is the market continues to be challenged, primarily by the below things:
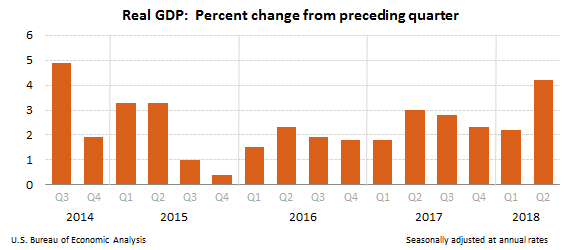
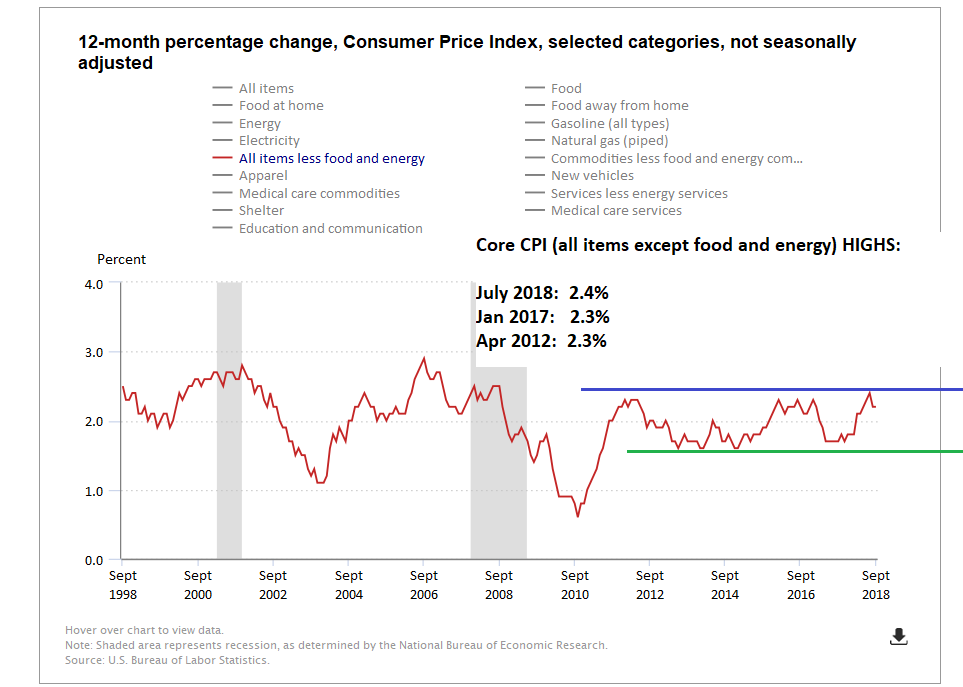
- A possible cooling economy. “Cooling” can be painted as a super white hot charcoal briquette turning into merely a hot briquette. Both will burn your hand. The overall economy is still churning along pretty well. But numerous signals reflect things may be cooling.
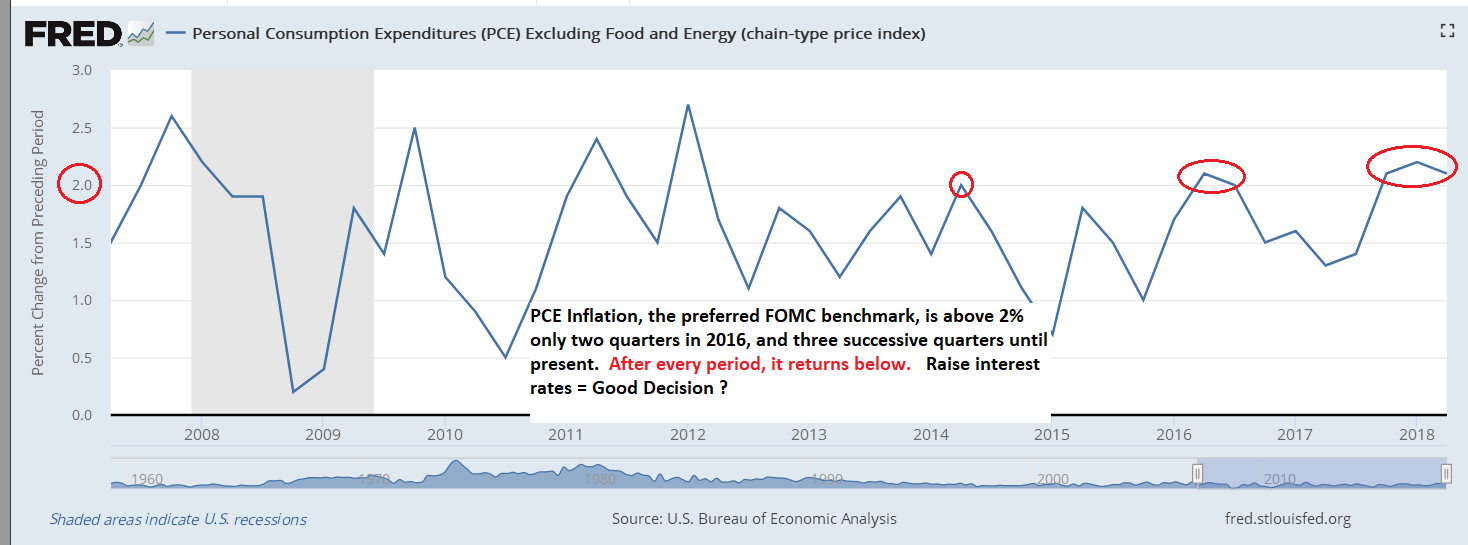
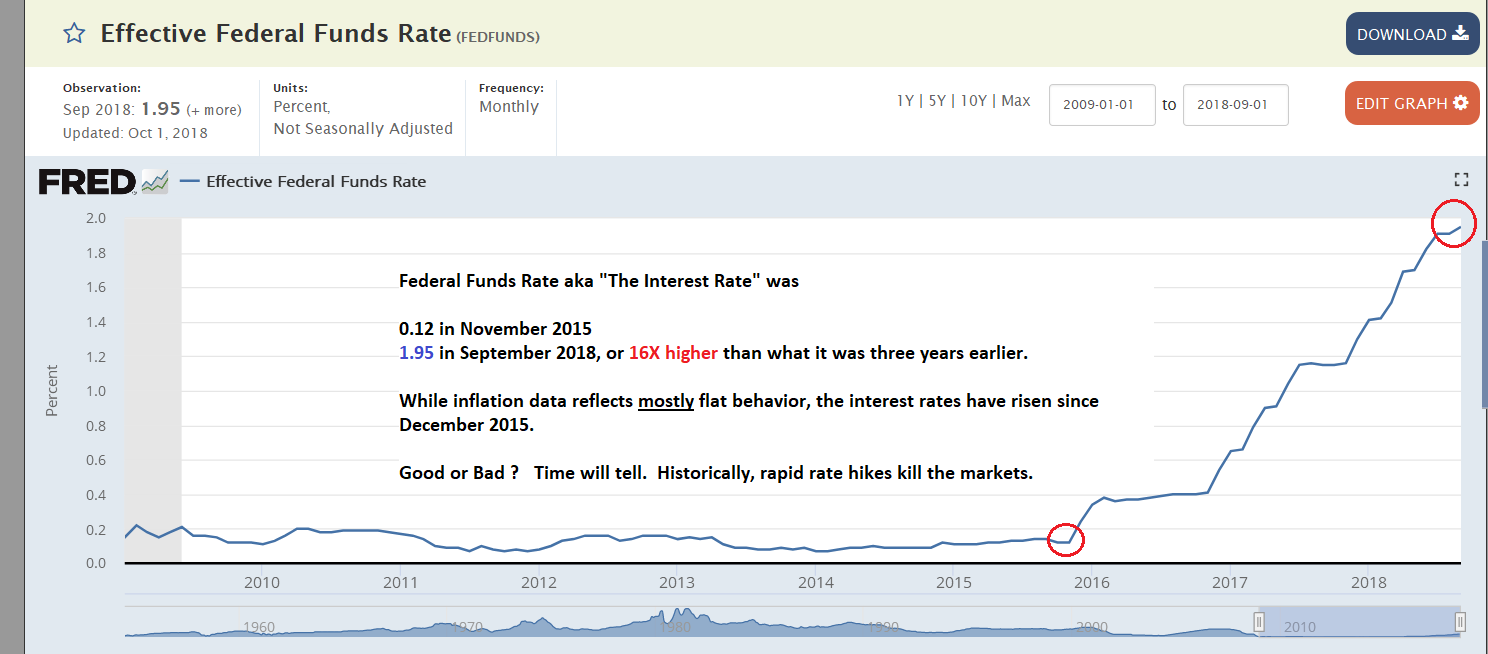
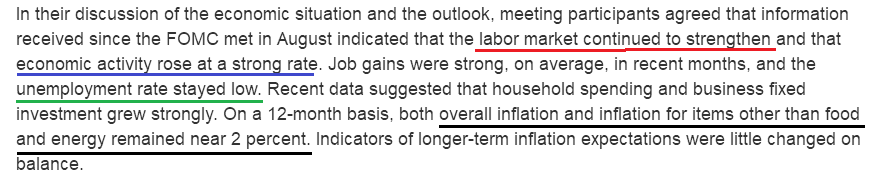
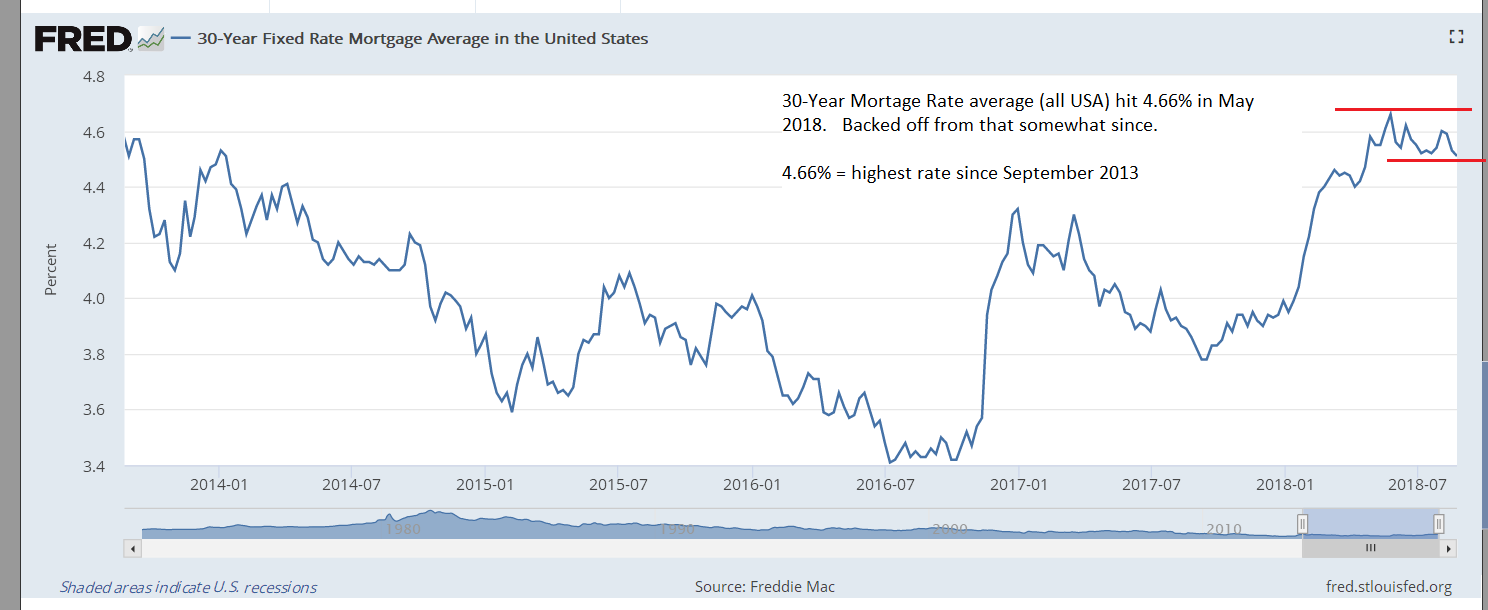
- Interest Rate hikes in December. Most believe the FOMC “has no choice now” but to demonstrate independence and freedom from political influence and thus raise rates in December.
- Midterm election uncertainty. Midterm elections are November 6, any sway of power from one party to another could be a destabilizing event and put at risk the other party’s initiatives, many of which are Pro-business (US business…) in nature.
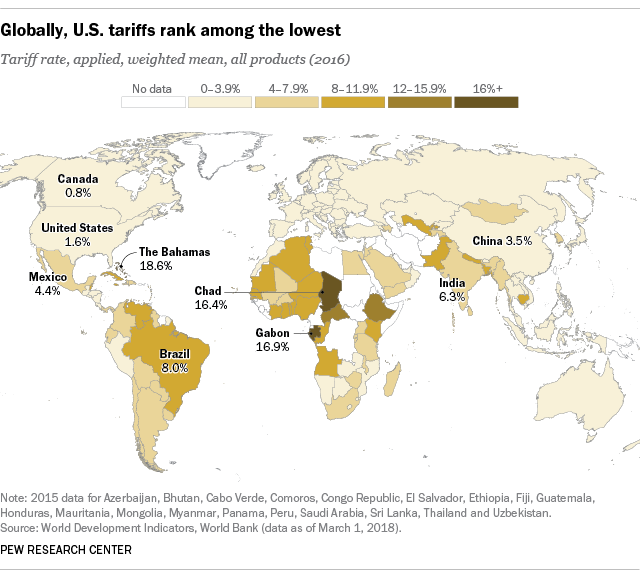
- Unresolved Tariff Situation. With the G-20 summit scheduled for Nov 30-Dec 1, a lot of hope exists that progress can be made with China regarding tariffs. But the “proof is in the pudding”, we have seen no movement on this issue yet and tariffs are still expected.
- Poor Corporate Earnings / Poor outlook ahead. Numerous companies have reported poor quarterly earnings and/or poor outlook ahead. Included in this list are well-run and large, dominant players- GE, Kraft-Heinz, Ford Motor Company, 3M, Disney,
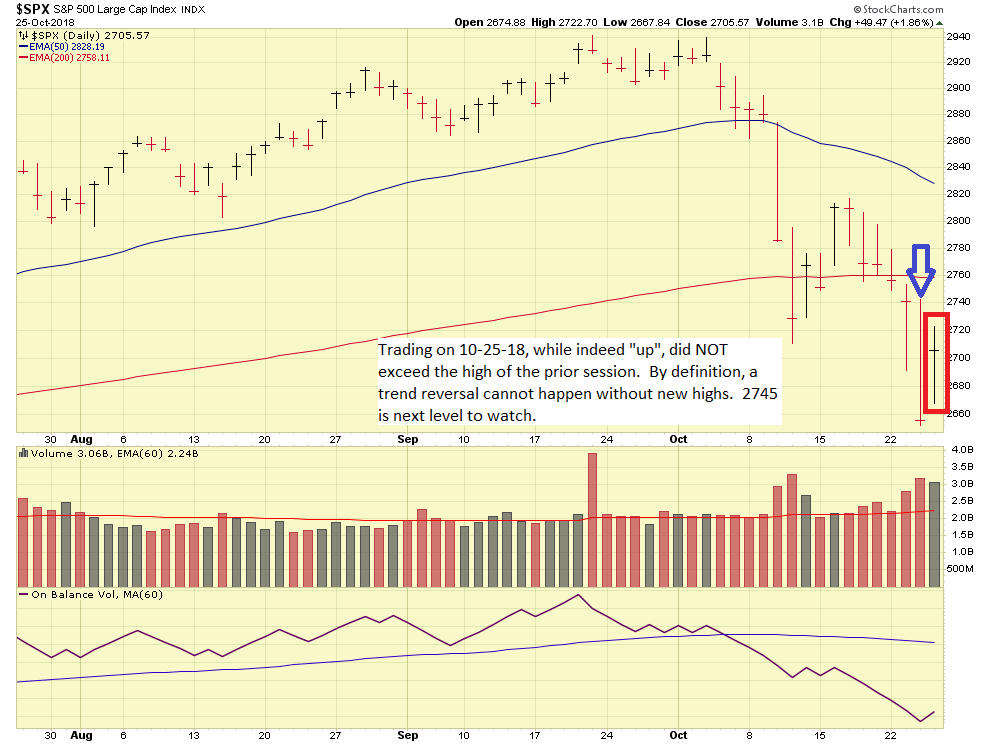
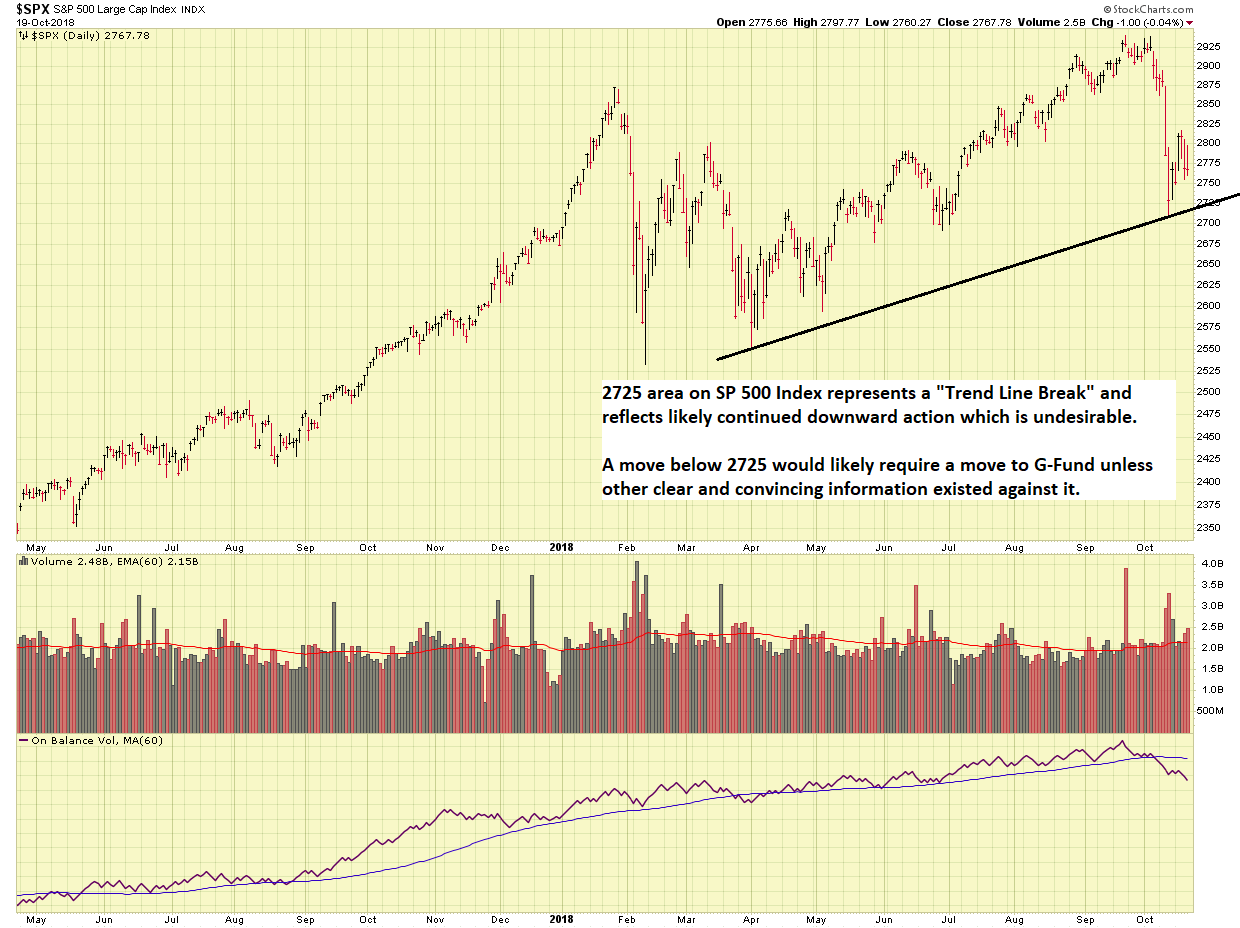
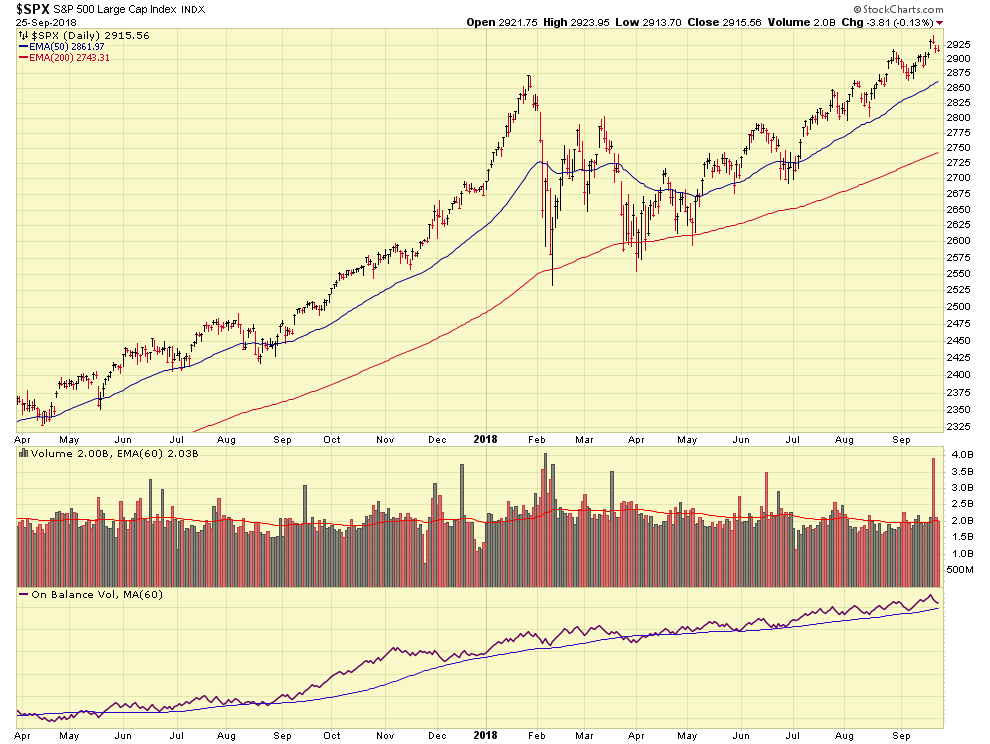
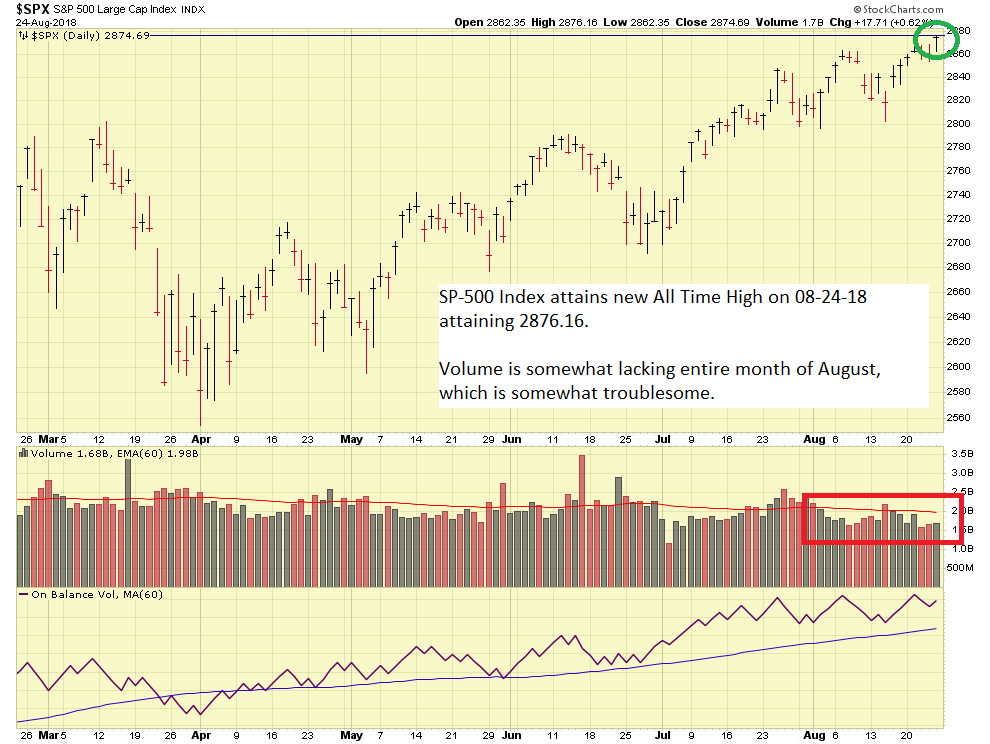
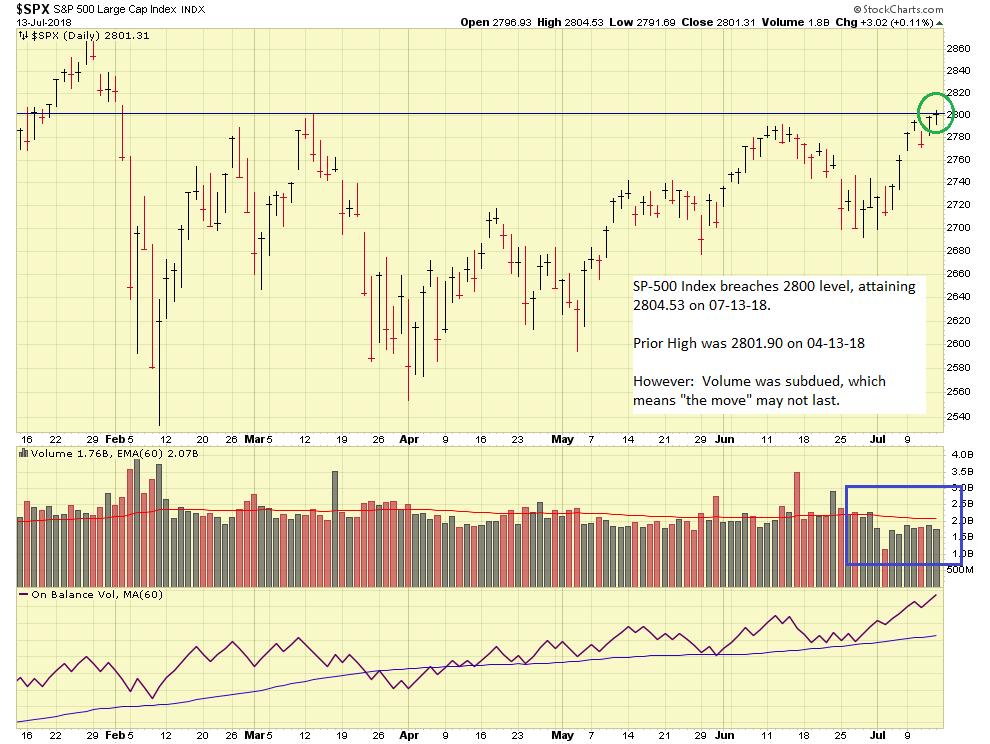
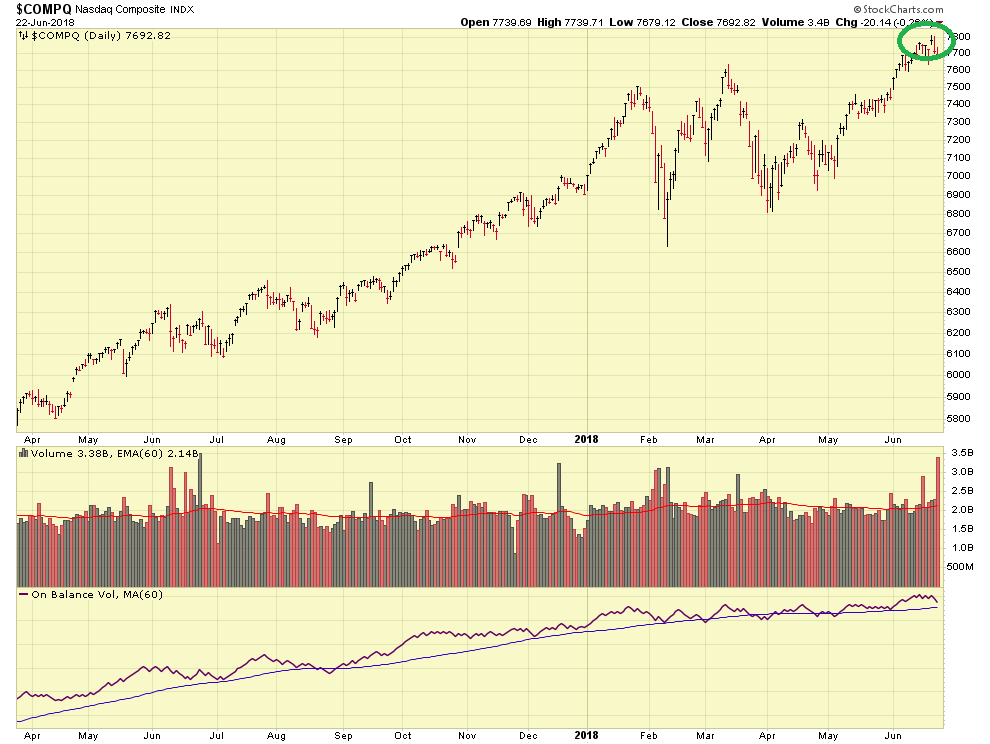
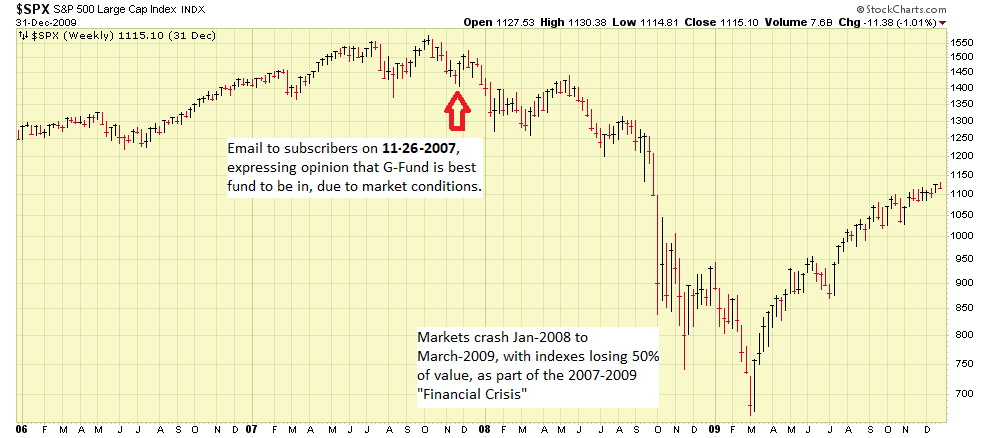
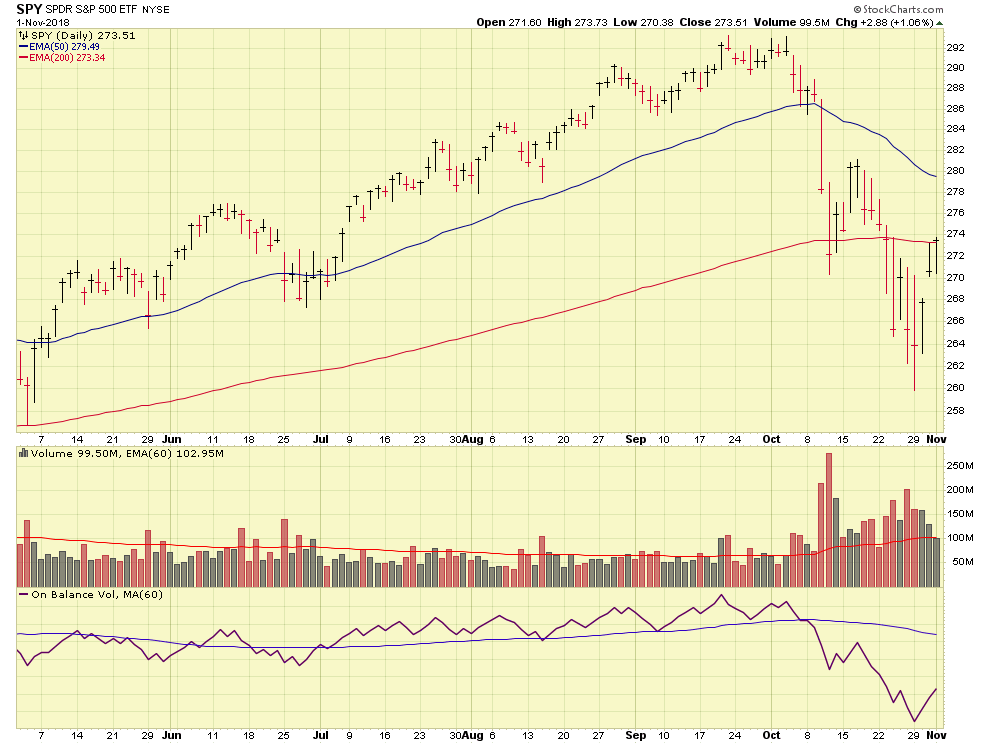
I got a couple of messages from folks regarding this week’s action. Indeed, the markets rallied. We are in a tug of war, bulls versus bears, and my status in G-Fund means I am watching the boxing ring, but not in the ring. Note that a close analysis of the SPY Exchange Traded Fund (ETF), reflects lesser volume each day of the “rally”. See chart:
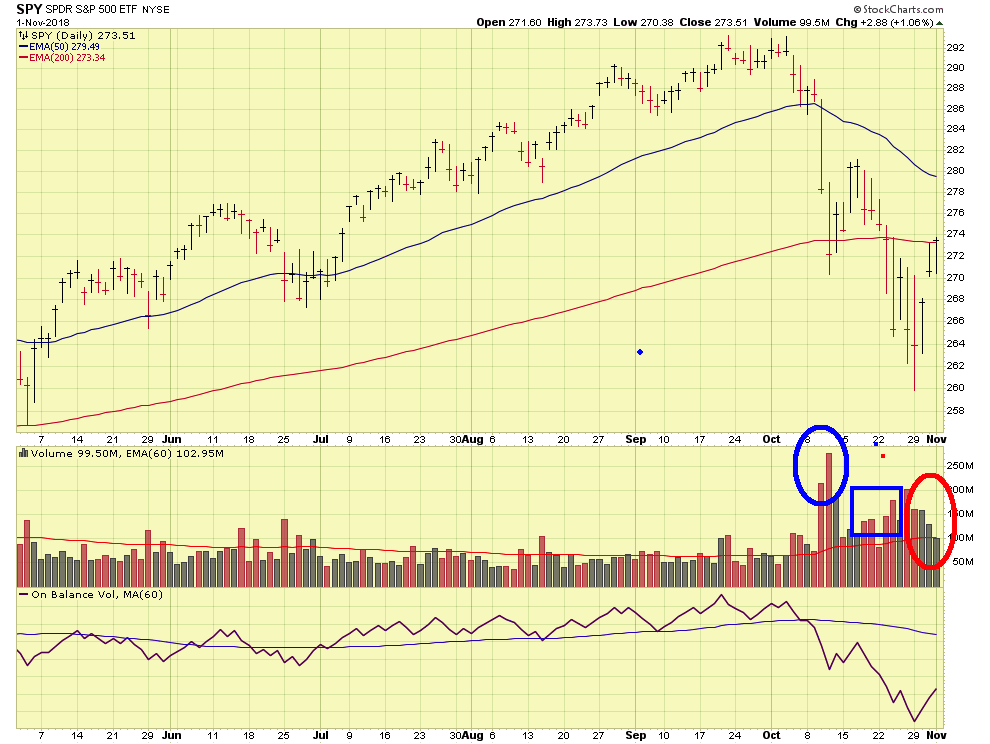
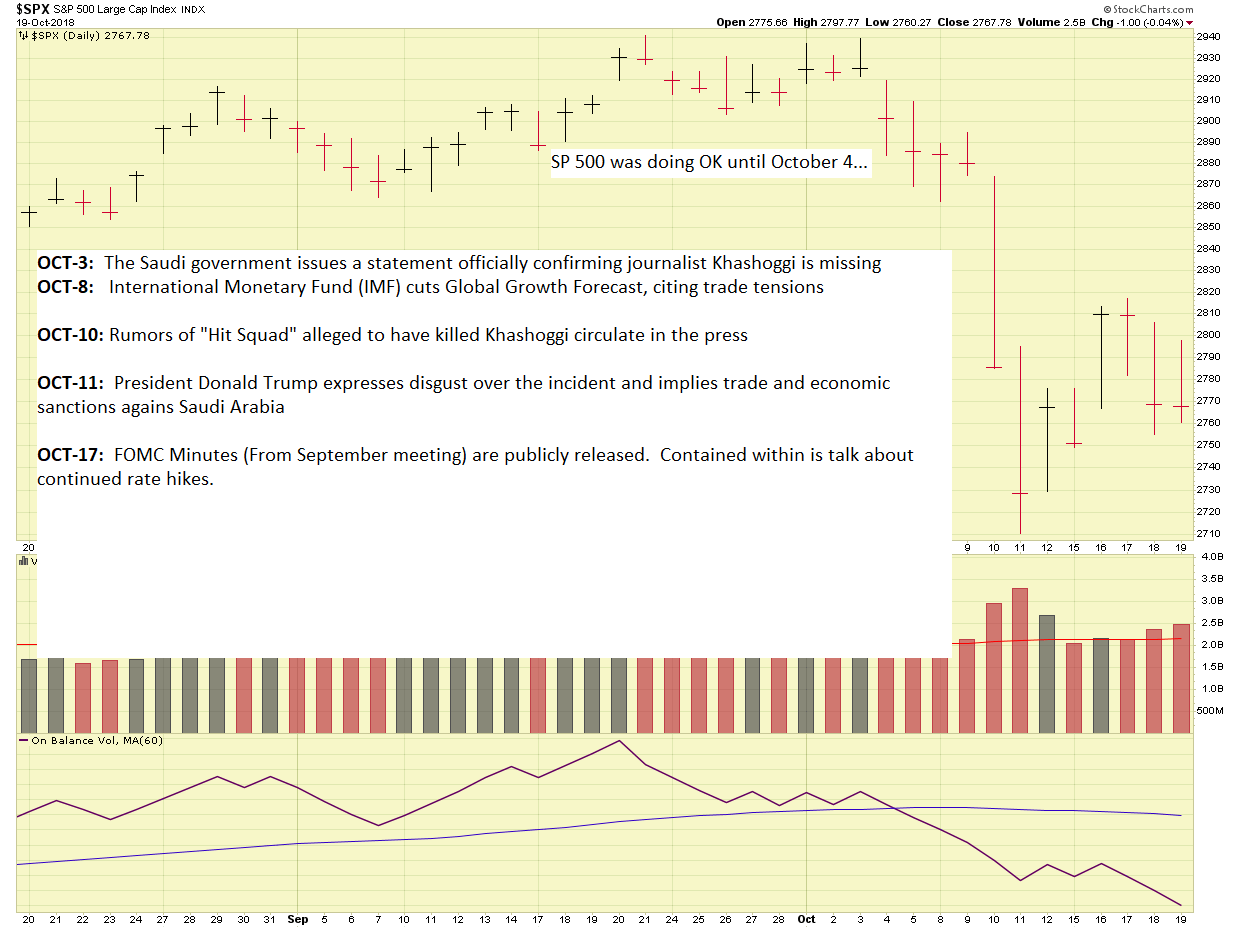
In blue, you will see the “sell off” volume growing larger each day, indicating that more folks hit the fire exits each day, versus less. Then it appeared to have possibly reversed this week (Oct 29 week). The buying volume trailed each day. It did not pick up each day, indicating that as time went on, the “number of believers” were less and less. To reverse the prior damage, volume needs to pick up (ideally exceeding each prior “up” day), and prices need to go higher. The SP 500 Index is sitting at the 200 Day Moving Average, a widely accepted “caution zone”- anything above is good, anything below is bad.
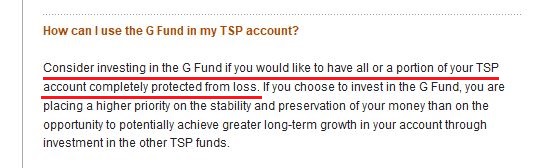
With that said, my opinion is the markets are indeed in a correction and I prefer to be investing in the G-Fund. Yes, investing, the TSP site itself labels it as such, the word invest or investment is mentioned seven times on the TSP G-Fund page: https://www.tsp.gov/InvestmentFunds/FundOptions/fundPerformance_G.html
The TSP site (a site with good information) says this about folks nearing retirement: https://www.tsp.gov/PlanningTools/RetirementPlanningPhases/nearingRetirement.html
The way in which you distribute your money among the TSP funds should reflect your time horizon and your risk tolerance. The closer you are to retirement, the shorter your time horizon. As a result, your primary focus might shift from growth and accumulation to safety and preservation. Even if your risk tolerance is very high, you may not have time to recover from severe drops in the market if a large portion of your account is allocated to stock funds. If you determine that you have not saved enough, this is not the time to take on more risk than you have the ability to sustain — the better alternative would be to increase your savings.
[Written to target pending retirees…] If you are heavily invested in the stock funds, now is the time to consider shifting to a more conservative allocation, especially if you do not have other retirement funds safely invested elsewhere.
Just wanted to share that for awareness.
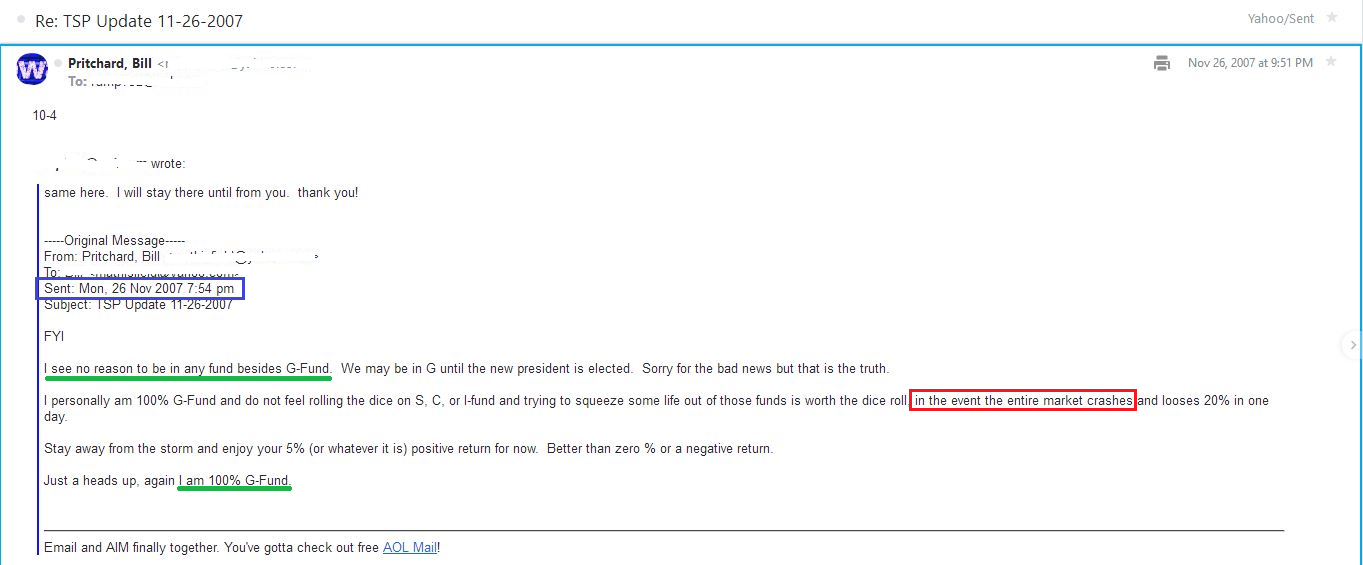
Thank you for reading….I remain 100% G-Fund in my personal TSP.
-Bill Pritchard