March 18 Update / FOMC Meeting Concludes today

Good Morning Folks

As most know, the Federal Open Market Committee has been in session March 17 and March 18, and is expected to release their updated monetary policy statement at 2PM Eastern Time on Wednesday March 18.

Most in the financial press are stating that the language of “patient” will be removed from their statement, but it is my OPINION that while the word may be deleted, the message will not be.

As discussed on this site in prior posts, the PCE Inflation data is not where it needs to be (near 2% per FOMC on-the-record-remarks or in my opinion “showing clear and defined progress towards 2%”).   This, of course, assumes that the FOMC considers what it has previously released, statement-wise, to the public, as being important.   See prior post regarding this observation.

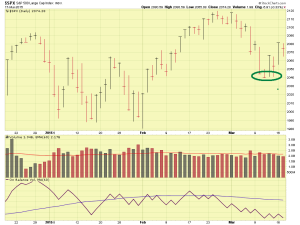
In a very quick overview of market action since last week, the markets have stabilized and tracked upward, however we cannot call this a “new uptrend” as the market action is akin to someone sticking their hand into an icy pond to check the water temperature.   I believe some participants are cautiously re-entering stocks, and we see a very slight movement upward.  The 2040 level on the SP 500 is the most recent support level.   See chart:

SP-500-03-17-15-comments

I am sticking my neck out here but my OPINION is we see no rate hike mentioned and thus the previously believed June rate hike will be determined to be unlikely.   I believe we will see increased discussion on inflation data, the rising dollar, and energy prices.    I believe we see some sort of language such as “continue to proceed cautiously” or “while we are encouraged by improving jobs data, the inflation data remains an area of concern” etc.

Again, all my opinion.   I have been wrong before…the FOMC may surprise me.   (Doubt it).

I remain 100% S-Fund.

– Bill Pritchard


March 12 Update / Interest Rates–Part 2

Part-2 of Interest Rates, mostly prompted by some very good email questions yesterday, to include “where are you getting your data”

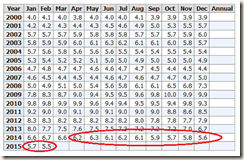
For official Bureau of Labor Statistics unemployment data, go to this link below,

http://data.bls.gov/cgi-bin/surveymost?bls

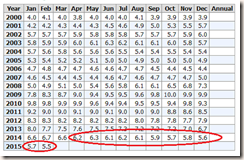
then choose Unemployment Rate (Seasonally Adjusted), fourth choice down under Employment category, then choose Retrieve Data.  That will then bring up the below chart, sans red circle:
UNEMPLOYMENT-TABLE

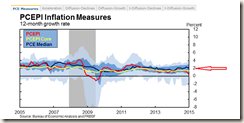
Regarding the Price Consumption Expenditures Index (PCE), which Federal Reserve officials have gone on record as being the primary inflation measure (Google “inflation” and you will get numerous and different results), use this link below.  This is 12-month data- PCEPI Core (yellow line) is data without considering food and energy, PCEPI (red line) is “straight” PCE with nothing removed.   No matter how you look at it, we are not at the FOMC-desired 2% rate yet.

http://www.frbsf.org/economic-research/pce-personal-consumption-expenditure-price-index-pcepi/
PCEPI

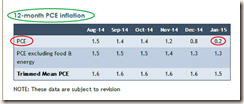
You can also go here, but you need to look closer to find the PCE:

http://www.dallasfed.org/research/pce/
PCE-table

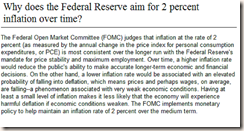
You have to love the government, you need to hit five sites to get the data you want.   As to “Why the 2% rate?”, lets go to the FOMC themselves and ask that question:

http://www.federalreserve.gov/faqs/economy_14400.htm
FOMC-2percent

An additional question is “What is inflation”, again, best we go to the FOMC and ask that, since they are the ones calling the shots (many definitions exist via Google).

http://www.federalreserve.gov/faqs/economy_14419.htm

inflation-def

Note the frequent referral to PCE index, this is the primary benchmark the FOMC is using.

Observations, as discussed yesterday are:  1) Yes, unemployment is improving if we use the data provided,  below the 6.5% level which is the oft-mentioned level the FOMC is looking at, prior to interest rate hikes.   2) No, PCE inflation data does NOT reflect 2%.   Remember the FOMC wants 2%, t-w-o, not 1.5, not 2.5, but 2%.   We are simply not there yet.   PCE Core, which is not counting energy, is almost (but not) there, and PCE is clearly not there.   If PCE was 1.8, 1.7, 2.0, 1.9, over multiple reporting periods, OK, I may accept that.   But PCE is nowhere near even those levels.   PCE is in fact deteriorating, each reporting period.   It is not stable, nor improving.

In my opinion, we now may not see interest rate hikes in Summer/Fall, which is presently believed.   Not if the FOMC wants to abide by statements and language they release to the public.  As many federal government employees understand, releasing an agency policy statement then not abiding by it is a pretty big deal. 

I remain 100% S-Fund.  FOMC Meeting is March 17-18, we should hear some news by COB March 18 or sometime on March 19.    As discussed yesterday, if we learn that at that meeting, the FOMC is concerned about non-movement towards the 2% PCE levels, and implies a delay of the rate hike, the markets in almost all certainly will embrace that strongly.   The “Inflation” topic is front and center now, because the unemployment numbers, basically for one year, are where they need to be.    So the spotlight has moved over to Inflation.   Jobs data is first, as unemployed Americans and hungry families is a pretty big deal, but the jobs/unemployment data is now reflecting pretty good numbers and the spotlight is now on the PCE.   I would be shocked if PCE/inflation was not a topic at the next FOMC meeting.

“The strong dollar may hurt our economy” is sometimes discussed in the media, with the reasoning that Multi-National Enterprises (MNE) such as Wal-Mart, with stores overseas, may see overseas sales negatively impacted, since the foreign currency in that county now buys less that what it did last year.  These companies may report lower profits, and thus send their stock prices down.   While probably correct, I am not loosing sleep over a strong dollar.  Most corporate, Fortune 500 companies, are selling products domestically.   Ford does not sell F-150 pickup trucks to Germans in Frankfurt.  They sell them here, in America.  NOTE:  Boeing Airplane Company, etc may be an exception to this.   A strong American economy means folks are buying cars.  Strong economies typically result in strong currencies, and vice versa.   I am quite proud that our dollar is (thankfully) strong again.   Not a surprise was that its historical all-time-low was in mid-2008, in the middle of our mortgage and financial crisis in USA.    The strong dollar, cheap fuel, and other topics are best left to much smarter folks such as the FOMC to figure out.  In short, I am not getting wrapped around the axle over our “strong dollar.”   I like my dollar to be worth something.  Strong is typically good.

I may post additional updates prior to March 19, but to be quite honest, I expect some increased volatility and turbulence until that date, but with really no earth shattering news.  If the Dow drops 500 points or something, I will share my analysis, however I don’t foresee anything but rough seas between now and March 19.

Thanks for reading and talk to you soon

– Bill Pritchard

March 11 Update / All about rate Hikes

Hello everyone

First, I remain 100% S-fund.    Many will stop reading at this point.   For those who wish to continue, March 10 was not a pretty day in the markets, the media’s favorite index, the Dow Jones Index (only representing 30 stocks, far from a “good yardstick” of the entire market) was down over 300 points.  Volumes were up on all indexes, indicating distribution or “sell off” activity.   Today’s post will not have any of my typical charts, it will however attempt to address the “rate hike” issue, mostly the what, why and the when.   Many have approached me for some insight into this, as it is mentioned often enough in the financial press but no real background is discussed regarding this subject.  Numerous other TSP sites have talked about everything but this topic, so I am eager to fill in the voids which exist.  The following represents my opinion and my assessment based on how I see things.

It is my opinion that the March 6 and March 10 sell-offs are directly attributable to fear of the rate hike. 

The what:  The Federal Open Market Committee (FOMC) is expected to raise short-term interest rates, many believe this will occur (the when) in summer/fall 2015.   As anyone with a desk calendar knows, we are approaching mid-March and Spring.

The why (this is important for us):  Rate hikes in theory are believed to result in increased borrowing costs for consumers, large business (who may be buying airplanes, heavy equipment, etc.), home buyers, and others.  Increased borrowing costs may result in reduced spending, which is counter productive to the economy. 

In summary:  Increased interest rates are feared to choke off or hamper business and consumer spending. 

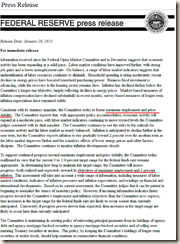
With that very brief, Cliff Notes version, lets take a look at the January 28 FOMC policy statement, available at this link below and cut and pasted into this post.  

http://www.federalreserve.gov/newsevents/press/monetary/20150128a.htm

FOMC-JAN-28

FOMC-2-JAN-28

Evident via the red highlights, is that fact that the term “maximum employment” is used three times, and that “inflation of 2 percent” is used twice.   It is apparent that both of these two items are important to the FOMC, prior to raising rates.   Remember, both.  Inflation rate is based on the Price Consumption Expenditure (PCE) measure.    Most feel that “maximum employment” means that the unemployment statistics must be below 6.5%, which they have been for almost twelve months now.   See table:

UNEMPLOYMENT-TABLE

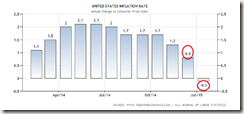
So we have one of the “both” criteria, pretty clearly established, for almost a year’s timeframe.   However, the FOMC also seeks 2% inflation rate, and we are not there yet.   Note they don’t want inflation higher than, or lower than 2%, they want 2%.   See graphic:

INFLATION-RATE

It is believed that the super cheap oil prices have thrown the inflation rate figures off, hence they are super low.   “Why 2%” and not 3 or 4%?   That is really not known, most conclude “because that is what the FOMC wants” and no additional clues or explanation has really been offered by the FOMC as to that particular number.

The point is this:  An influential government body has released to the public a policy statement.   Multiple times in that statement, they mentioned that they want both a good employment picture and 2% inflation.   Well, we haven’t achieved both.  Regarding inflation, we are not even close.   So I am not so sure that we do see rate hikes in Summer/Fall.  I myself previously believed this also, until digging into the FOMC statement. 

The FOMC meets again March 17-18, so until then, I expect some market nervousness and increased volatility.   As always, I will ultimately respond to the market itself, but based on some additional analysis, to include the above, the Dow Jones 300 point drop on March 10, in and of itself, while not desired, is not causing me to change anything.   If the FOMC murmurs, whispers, implies, anything regarding delaying the rate hike (likely due to inflation targets not met), the markets are going to the stratosphere.   MY OPINION and standard disclaimers apply. 

It is what it is:  we have major elections in the not too distant future (Nov-2016) and this is not the environment for the government body, which oversees national monetary policy, to waffle on their statements or take actions when previously mentioned requirements are not met.   The current administration and political party has enough fires to put out, they don’t need more.  FOMC Chairperson Yellen is a Presidential appointee.  Vice-Chairperson William C. Dudley, also a Presidential appointee, is in charge of the Federal Reserve Bank of New York (aka Wall Street).   A violation of the “both” criteria (a rate hike with only one or the other criteria), with a subsequent interest rate hike, could severely damage many 401k balances, retirement plan balances, and the net worth of many voters.   This is more critical the closer we get to November 2016.  I don’t anticipate any deviation from the “both” criteria.

I remain 100% S-Fund.     Thank you for reading and continuing to share this site with your friends and colleagues.

– Bill Pritchard
Risk Tolerance Poll

Hello folks

If you can please take the time to complete this poll below.  This is prompted by reader email, some who wish less G-Fund, some who feel that the current system in use is too risky.   Please be careful and don’t accidently vote twice.  Based on this poll and additional polls and feedback, I may modify the system discussed on this site.  Thank You !

LINK:   http://goo.gl/2RzQuY

03-06-15 POLL: Choose the selection which most closely reflects your feelings regarding the risk tolerance displayed on The Fed Trader website. This allows me to stay in touch with readership sentiment.

The moves to G-Fund are overly conservative/safe, I prefer to see a LESS conservative approach and can stomach account volatility
The system in use is fine, you can’t please all people all the time
I feel that the G-Fund should be used MORE, and prefer a more conservative/safer approach

Poll Maker

March 4 Update–Market uptrend continues

Hello Everyone

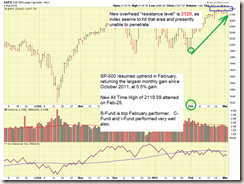
Well, February is now behind us, and I am happy to report that the market uptrend continues.  February performance (SP 500 Index) displayed the largest monthly gain (5.5%) on the index since October 2011.   Coming out of a “sideways” January, this is welcome behavior.

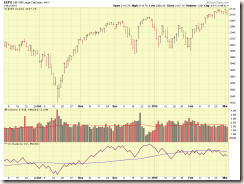
The top performing fund in February was the S-Fund, although it is important to note that the C-Fund and the I-Fund also came in very strong.  Additionally, allow me to highlight the fact that I have “remained in position” (in the S-Fund) since January 1, due to my analysis and proprietary system which reflected that the S-Fund was the best location to be in- even in light of the “sideways action” which we all frustratingly had to endure since approximately November 2014.   Out of ten possible fund choices, to include the “safe haven” G-Fund (which I have no problem using in times of turmoil), the S-Fund was my choice, and I am pleased (and not entirely surprised) that this fund, as expected, was the ideal choice and top performer out of ten funds.    Lets take a look at some charts, one with no comments, then one with comments:

SP-500-03-03-2015SP-500-03-03-2015-comments

Moving forward, it should be noted that the I-Fund may be the place to move to in the near future.   This fund is rather sensitive to world economic issues and political turmoil, so I confess that I am a little “gun-shy” about this fund, in light of everything going on globally.   I will keep folks posted on my decisions, however it is apparent that at least from a performance standpoint, I-Fund may potentially outperform the other funds in the next few months.    At this point, “we are not there yet” and I want to wait until mid-March before I make any serious decisions on changing my TSP allocation.  I remain 100% S-Fund for now.

The good folks over at Investor’s Business Daily are assessing the Accumulation/Distribution level of the SP 500 index as a “B”, out of A to E.  This means that institutional investors such as mutual funds, hedge funds, retirement plans, are actively purchasing and investing (versus selling and exiting) in large cap stocks, the type which make up the SP 500 Index.   I use this rating to “back up” my own analysis, and they are both in concurrence.   In January, the ratings were a little weaker in the D+, C, and C+ range, but improved in February, which is also evidenced by the chart analysis above, reflecting an uptrend.

That is all for this update.   In the “ask and you shall receive category”, please continue to refer your friends and colleagues to this site.   One of my goals is not to necessarily beat the market, but definitely to not let the market beat us.  

Thanks for reading, and again, I am 100% S-Fund at the present time.

– Bill Pritchard

Feb 18 Update / Market recovery Continues

Hello Everyone

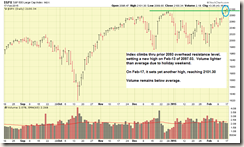
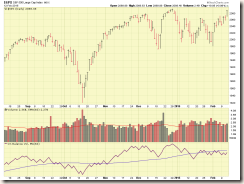
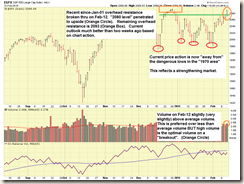
I am happy to report that this past Friday the 13th, while historically a day associated to bad luck and horror movies, turned out to be a positive day as far as the markets were concerned.  The prior All-Time-High of 2093, set back in December, was overtaken, with the SP-500 index reaching 2097.03.   Then on Tuesday February 17, the  SP-500 index reached a new high of 2101.30.

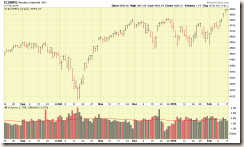
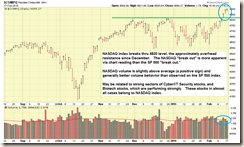
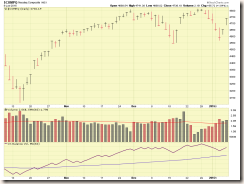
Note that these both occurred with the Ukraine “cease-fire” apparently not being entirely adhered to (surprise), and with the Greece situation still not resolved.  Open source news is reporting that Greece may ask for a 6-month extension to their bailout terms (another surprise).    So with both of these things in the picture, it appears that the markets have “priced in” these events.    Lets take a look at some charts of the SP-500 and NASDAQ.  Observe that in recent days, the NASDAQ index has displayed stronger volume and overall behavior than the SP-500.    This could be due to recent strong performance in NASDAQ stock sectors of cyber and IT security and biotech stocks.    Ok, lets look at some charts:

SP500-02-17-15SP500-02-17-15-comments

NASDAQ-02-17-15NASDAQ-02-17-15-comments

I currently remain 100% S-Fund.  I hesitate to change fund allocations until I get a better “handle on” the various fund’s apparent future performance.   Anyone who tells you “move to Z-Fund, it is doing the best, get in early” should be ignored.   In times like these, after an extended sideways market (since basically November), at the present time, nobody can tell you what the individual funds are going to do.   I my prior post I discussed three floating swimmers on their back.   In this post I will use another analogy (I am a big analogy guy…), and state that the three TSP funds (S/I/C) are like three baby birds that just broke thru their shells.   Which one will fly the farthest?   No way to determine that right now.   With that said, in 30 days (mid-March) we should have a better idea on what fund is performing best, which may provide insight into TSP allocation decisions.  

On Wednesday February 18, the Federal Open Market Committee minutes will be released, at 2PM Eastern Time.   These are the minutes from the January 28 FOMC meeting, and everyone will be over analyzing every word and vowel in the minutes, trying to determine when interest rates will be raised.   I remain committed to my prior opinion that we will see rates increase in summer/fall 2015.

Again, I remain 100% S-Fund (a fine allocation, 50/50 S-Fund and C-Fund also fine).    In mid-March, I will take a look at all funds and other relevant information for a potential TSP Allocation change in my account.

Please forward this update and this free website to your friends and colleagues, so that they too may benefit from trustworthy and accurate market analysis.   This free site’s sole purpose is to educate and inform the TSP participant, with the belief that the educated participant can then make educated decisions, with a resulting positive performance enhancement to his TSP.  As a fellow TSP participant, I have “skin in the game” along with you, and try to put out the correct balance of opinion, commentary, and analysis, without getting overly complicated or burying the reader in obscure economic theory or reports.  

As we enter 2015, I have made a very conservative estimate that my ever growing multi-thousand subscribership represents a total of over $300M in TSP account funds.  By all appearances, this site has been received very well.

Thanks for reading, talk to you soon…

– Bill Pritchard

Feb 13 Update / Markets appear to be Recovering

Hello Everyone

This update will be rather short, however I am happy to report that the markets appear to be recovering.   On Feb-12, the SP 500 Index “broke thru” the overhead resistance area located at 2080.  As most know, the index has been range-bound 1970 to 2080 since January 1.   The next overhead resistance is at 2093, which is the All Time High achieved in December 2014.   However I have shifted my outlook from “worried” to “optimistic” as of now due to this recent penetration of 2080.  We are “off the lows” (see charts below) in the 1980-1970 area, which is positive.

Some back-drop news likely accounting for these moves is the reported cease-fire reached in Ukraine (note “we have seen this before” however) and some speculation that Greece and Germany, the country with the biggest exposure to the Greek bailout package, may be reaching some sort of agreement.   I have reported previously on this site regarding the Greek situation, I will not re-hash that reporting, however per internet news sources, the “drop dead date” for the newly elected Greek government to have some sort of resolution to their bailout program is February 28.   So between today and February 28, we may still see volatility in the markets.

Note:   There is some argument for a possible move to I-Fund, IF the Greek situation is resolved, and IF the Ukraine cease fire appears to hold.   If stability returns to the international picture, the I-Fund may begin to “take the lead” over other funds.  This is merely speculation on my part and by no means would I try to “get ahead” of the possible I-Fund recovery by investing in it today.   I would not make that move yet.  Lets monitor things a little longer. 

My preliminary analysis shows that the C-Fund is leading this past week, then S-Fund, then I-Fund.   It is very difficult to pick out “the winner” when all contenders have been range-bound and volatile.   This is akin to three swimmers in a swimming pool with choppy waves, floating in circles, on their backs.  “Show me the fastest swimmer”.   Very hard to determine that under those circumstances.  However, on a preliminary basis, C-Fund is leading.   I remain 100% S-Fund presently until we get a little more insight into the market’s direction. 

Note, as discussed on this site previously, when large cap stocks (C-Fund) consistently lead all other stocks, this is reflective of a mature “long in the tooth” bull market, a market which may be reaching the end of the bull cycle.  

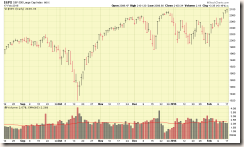
Here are some charts, first with no comments, then one with comments:

SP-500-02-12-15

SP-500-02-12-15-comments

Note that Monday February 16 is a Federal Holiday and the stock markets will be closed.   Friday February 13 trading volumes may be light in the markets due to the long weekend.  

I remain 100% S-Fund at the present time.   Lets monitor things; ideally the SP 500 remains above 2080, if it drops back below that, the strength we saw today may be short lived.

Thanks for reading, talk to you soon….

– Bill Pritchard

Feb 3 Update / January closes down 3%

Hello Everybody

I apologize for the lack of updates in January, I received a few emails asking if I had disappeared.   No, I am here, however I don’t think the bull market is here much anymore, at least if we go back to November 2014 until present.   The market has been a ping-pong ball for the entire month of January, hence I have had no actionable ideas to execute or report.   Sadly, we may have a move to G-Fund looming in the near future.

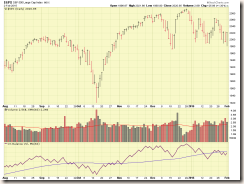
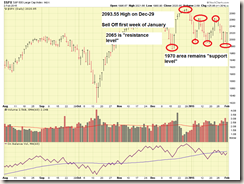
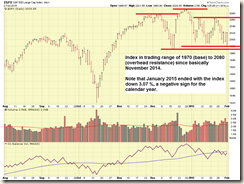
Using the SP 500 has a benchmark, that index has traded in basically the 2080 area (overhead resistance) to the 1970 area (support) since November and December.   It has ping-ponged up strongly on some days, then on other days crashed hard….only to go back up the next day.   This kind of behavior is very difficult to respond to, much less predict (aka crystal ball).   Since a “picture is worth a thousand words” lets look at three charts of the SP 500:

SP-500-02-02-15  

SP-500-02-02-15-comments-1

SP-500-02-02-15-comments-2

As can be observed on the charts, the SP 500 displayed its last gasp of bull-life on December 29, when it hit an All Time High of 2093.55.   However, unfortunately, it sold off hard the first two weeks of January, and January closed down 3.07% (that is –3.07%). 

I have reported previously on concepts such as the January Barometer , with a reported accuracy rate of 88%.   This concept states basically that the market will perform for the remainder of the year, as it performed in January.   A down January ?   A down year.  An up January ?  An up year.   Yes, naysayers exist but I have not been one to listen to naysayers.   With that said, I see more “bear signals” than “bull signals”, which are:

  • The aforementioned January Barometer with a –3.07% January
  • Numerous “Distribution Days” on the indexes over recent weeks
  • Almost guaranteed interest rate hikes summer/fall 2015
  • (No surprise) international issues such a Russia downgraded to Junk credit rating and new political power in Greece

My finger is close to the G-Fund “trigger” however at the present time I will remain in S-Fund.   Due to recent market swings, it is very difficult to out-guess or respond to the index, and will remain “in current position” (S-Fund) until I get better information which may cause me to move elsewhere.   All stock funds lost money in January 2015, based on my data, FYI.  We get two moves in the TSP funds a month, so for now I am standing by.

For now, lets monitor the indexes (don’t let the Dow scare you, it is only 30 stocks, but makes for big media headlines), the key levels for the SP 500 in my opinion are 2080 to the upside (and ultimately 2094 an beyond) and 1970 to the downside.  If we get close to or below 1970, coupled with how the volume is acting, and “backdrop” (news, world events, etc.) information, this may trigger me to move to G-Fund.     

Again, I am presently 100% S-Fund and may move to G-Fund in the near future.

Thank you everyone

– Bill Pritchard

Jan 13 PM Update / Cracks re-appearing

Good Evening Folks

I am out TDY on the road so updates may be sporadic this week, however unfortunately the markets are re-displaying volatility and some cracks are appearing.   Today the markets rallied strong, then closed down, on above average volume.    This in my opinion is attributable to crude oil going even lower (now $44) and continued issues on the international front.   Recall that we have Greek Parliament elections on Jan 25.

In addition, a recent article has appeared on Fox Business, authored by Dallas wealth advisor Ed Butowsky.   This article is somewhat in the “where have you heard this before” category, please take a look.    Mr. Butowsky is a well-reputed advisor and frequently appears on Fox Business and other financial outlets discussing his views of the markets.   In summary, if you are hypnotized by the “gains only” you are being myopic on your overall account health and investing.   Where have you heard “protect your balance” or “minimize negative hits” ?   How about “gains are not the only thing” etc ?

Thank you Ed, for a great article.   You put it so well, in a way I was unable to do so myself.

With that, I remain 100% S-Fund but will be closely monitoring things for a possible G-Fund move.

Thanks guys !

– Bill P

Markets rally Strong

Good Evening

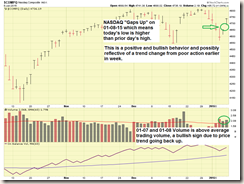
A brief update that on Weds/Jan 7 and Thurs/Jan 8, the market rallied strong both days, with the Dow Jones making triple digit gains on both days, on above average volume.   These are very positive and bullish signs, reflecting a possible reversal of the trend which started downward earlier in the week.   I am especially pleased that the markets have rallied strong in the face of the unfortunate terrorist events in France and the on-going Greek situation regarding elections and exiting the Eurozone.    Lets take a look at the NASDAQ, which is best reflects the bullish action:

NASDAQ-01-08-15NASDAQ-01-08-15-comments

As can be seen the NASDAQ “gapped up” today which means that today’s low is higher than yesterday’s high, resulting in a “gap” when charted graphically.   Gap Ups are very bullish and reliable indicators, even more so, when coupled with above average volume which indeed occurred today.   The action observed Jan 7 and Jan 8 is “classic bull market” action, in which Jan 7 closed higher than prior day, on above average volume, then on Jan 8, the market closed higher than Jan 7, on higher (and thus also above average volume) than the Jan 7 volume.

So we have numerous positives which have occurred the last two days.   It is not known at this point what will happen on Friday/Jan 9, but if that day is at worse, flat, and at best, another good performance, then my fears earlier this week will be much subsided. 

This week’s trading so far reflects that the “least worse performer” (considering the down days of Monday and Tuesday thrown into the analysis) is the C-Fund, with the next “least worse performer” being the S-Fund.    I am personally 100% S-Fund, but this mature bull market, 50% S-Fund and 50% C-Fund is probably an equally good option.   Note that historically, when a bull market finally tops out and heads down, the large cap stocks are the ones performing the best.   So if we see behavior associated to large cap stocks/C-Fund outperforming S-Fund, constantly, this is yet another indicator of a bull market coming to an end.   We are not seeing that (quite) yet.

Today’s action is testimony why I don’t panic nor advocate that anyone else panic, when markets have a one or two-day crash.   We need to step back, breathe, assess, then take action.   Part of my “assessment toolbox” is my chart analysis, volume/price review, and some other tools.   In aviation, pilots are taught that the first thing to do in an emergency is “wind your watch.”   In other words, numerous accidents have happened, many fatal, because a pilot panicked and responded incorrectly to an emergency situation, at times making the situation worse.   So we must breathe, pause, assess, and wind our watch.  And try to remove the emotion, theory, crystal balls, out of the process and use objective & sound tools and methods.

With that said, lets see what happens Friday/Jan 9.

Everyone have a great weekend unless we talk sooner.

– Bill Pritchard