Federal Shutdown Looms

Good Evening Folks

Well, the clock is ticking and we are less than one hour until midnight Washington DC time.   Public news reports reflect that no agreement has occurred, and thus it is my responsibility to advise you of my opinion regarding the shutdown and its affect on the markets and ultimately our TSP funds.   Note that I have received multiple emails on this topic, I am not ignoring you, but this post should touch on most questions posed in those emails.

Let us observe that the last shutdown was in 1996, which lasted three weeks.   This is still fresh in my memory, as this occurred while I was a young Border Patrol Agent.  I recall being at “muster” (roll call for some other departments), and learning about the shutdown and what would happen.  Flash forward to 2013, and we have another shutdown looming, less than one hour away.

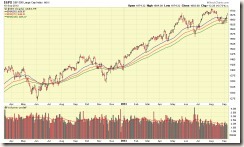
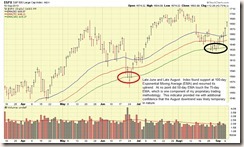
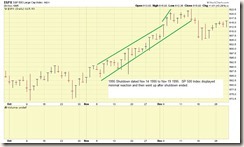
While the markets did sell off today, 09-30-2013, this was mostly panic selling in my opinion and not reflective of bigger problems with the economy.   Anyone who thinks the economy is still bad should try to travel via airline, as every seat is filled with both business and tourist travelers.  Let’s take a look at the SP 500 charts during the 1995-1995 time frame.   As a point of reference, we had one shutdown Nov 14-19, 1995, and another one Dec 16 1995 until Jan 6 1996 (what a great way to celebrate the holidays) .

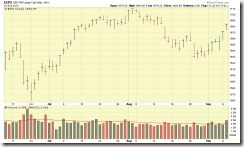
SP-500-NOV-1995

The chart above shows the SP 500 index during the Nov 1995 time frame.  The index barely hiccupped and went up the entire month.

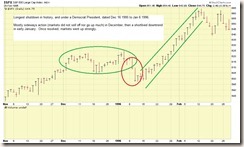
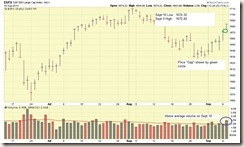
SP-500-JAN-1996

This chart, above, shows the SP 500 index during the longest shutdown in history, lasting Dec 16 1995 to Jan 6 1996.  As can be seen, the index was mostly flat in December (not completely abnormal, the markets tend to be quiet anyway due to the holidays), then went down in early January (as traders returned from the holidays), then went up strongly once the shutdown was resolved.  OBSERVATION:  the markets did not “crash hard” nor did the world end because of the shutdowns.   Granted, in 1996, the NASDAQ and other indexes were going up like bottle rockets, and possibly this prevented any negative responses to the shutdown. 

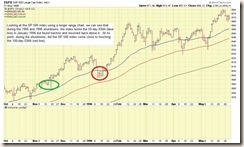
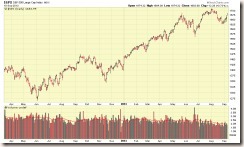
SP-500-1995-1996

The chart above is a longer term view, displaying most of 1995 to 1996, allowing the viewer to see the overall behavior of the index.   As my notes on the charts indicate, at no point during the shutdown dates did the SP 500 index come close to touching the 100-day EMA, and only broke the 50-day EMA during the Jan 1996 timeframe.   Once the shutdown ended on Jan 6 1996, the markets went back up.   OBSERVATION:  Any behavior BELOW the 100-day EMA is a warning sign however a potential breakage of the 50-day EMA must be looked at with history in mind.   It may not (or may be) a sign of worse things ahead.

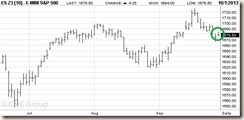
As an aside, the SP 500 futures, chart below, are trading up, versus down, which is interesting, in light of the shutdown occurring in less than 30 minutes.

Sp-500-futures

SUMMARY:  I remain in S-Fund and my opinion is we should watch how things play out.   With history displayed above, we can panic a little less due to the shutdown.   I will try to react to the market itself, and will not try to out-guess it, and if the market flashes red flags, then I will move to G-Fund.   Yes, I have been wrong before.   However, again, with history lessons of the past in my mind, and a close eye on things everyday, I am not panicking.    Yet…..

As always, thank you for reading and if you find this site useful or informative, please share it with your friends and coworkers.

– Bill Pritchard

Roth TSP / Sept 20 advisory alert from FERS GUIDE Dan Jamison

Mr. Dan Jamison / FERS GUIDE emailed this out today 09-20-2013, and I am cut and pasting it here, as it contains important Roth TSP information.  Mr. Jamison’s expertise is in retirement benefits and tax information.  It is important that my readers and subscribers be heads-up on this.   Mr. Jamison produced and authored all content entirely himself.

Hi Folks,

Many of you are probably unaware of the serious pitfalls you will encounter if you opt to contribute to the Roth TSP.   For a federal law-enforcement officer or firefighter, the Roth TSP is a poor choice.  It wasn’t until this week that a reader posed a question to me that caused me to realize what a bad idea the Roth TSP is for many of us.


The idea behind the Roth TSP is that you contribute after-tax monies and when you withdraw funds from the account in retirement, the earnings are tax-free.  The trick here is that that the withdrawal must be a “qualified withdrawal” for the earnings to be tax-free.  In order for the withdrawal to be considered a “qualified withdrawal” by the IRS, “five years must have passed since January 1 of the calendar year when you made your first Roth TSP contribution AND you are at least 59½, permanently disabled (or deceased).

Here’s the problem: As a law-enforcement officer or firefighter, you can retire as early as 50 years of age and are mandatorily-retired at age 57.  If you decide to take post-retirement withdrawals from the TSP (under the life-expectancy option or the age-55 exemption) you will not meet the age test for the Roth TSP withdrawal to be considered “qualified.”  (You may also not meet the 5-year rule as the Roth TSP has only been an option since May 2012.)  Since your withdrawal is not “qualified,” you will be taxed on the portion of your withdrawal that represents the attributable earnings.  This eliminates the tax-advantaged nature of the Roth TSP.  You’d be just as well off having a regular post-tax investment account outside of the TSP.  You’re contributing after-tax dollars and paying taxes on the earnings generated by the post-tax investment.

The TSP will not allow you to specify that your post-retirement withdrawals come only from your Traditional TSP balance, nor will the TSP allow you to roll-over/transfer out only the Roth TSP portion of your account.  When you make any withdrawal from the TSP, the withdrawn amount will be taken ratably from both your Traditional and Roth balances under TSP rules.

If you roll-over/transfer both your Traditional TSP and Roth TSP to another custodian, then you lose your eligibility under the age-55 exemption, as that requires the funds to be left in your employer-sponsored account.  If you retire between age 50 and 59½, at retirement, you could roll-over/transfer your Traditional TSP and Roth TSP to another custodian and withdraw only the funds that came from the Traditional TSP account using an IRS Section 72(t) withdrawal plan and wait until age 59½ to start to withdraw the portion that came from the Roth TSP funds.

Please consider these facts when deciding if the Roth TSP is right for you.  If you already jumped into the Roth TSP, you can always stop and change your contributions to be 100% Traditional TSP and limit the tax damage.

Even folks who aren’t covered under the special provisions get affected by these rules if they retire at their MRA.

Dan Jamison
FERSGUIDE, LLC


Sept 15, 2013 Breaking news alert / Dow Futures up 162 points

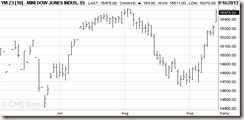
Good evening….I wanted to update everyone that tonight’s electronic trading of equity indexes (E-Mini SP 500 and E-Mini D0w) have shown significant gains over the prior session.  These are traded worldwide, electronically, and are open for trading beginning Sunday evening, then 24 hours each day, until Friday evening, when they stop trading until Sunday evening.   Sunday behavior is usually good “intel” on how Monday’s regular stock markets will behave.  I have the sick habit of checking them every Sunday night, which determines if I lie awake all night in a cold sweat due to nervousness, or if I sleep soundly with a smile.  Tonight I will have a smile.

E-Mini SP 500 Futures are trading up 17 Points

E-Mini Dow Futures are trading up 162 Points

Lets look at the charts:

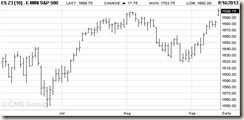
            SP500-futures-09-15-13

                    DOW-futures-09-15-13

As can be seen, both indexes “gapped up” (a concept explained in my last post on this site), indicating strength and bullishness.   Most successful traders believe a “Gap Up” requires the establishment of a long position/buying shares.

Tonight’s activity is likely associated to the news that Larry Summers has withdrawn his name for consideration to be Ben Bernanke’s replacement.  As always, the market itself ultimately serves as the signal for our trading moves, not outside news or trying to crystal ball / predict the market.  

Most of my subscribers should already be “in position” in the S-Fund and/or I-Fund due to my opinions regarding bullish/positive behavior in the indexes, discussed in depth on this website.  If Monday 09-16-2013 stock market activity behaves like tonight’s futures, then those who are “in position” will benefit greatly.

Thank you for reading and let’s see how this week turns out.   I am very optimistic.  As always, if you find www.thefedtrader.com a useful and informative website, please share it with your colleagues and coworkers.  Good Night.

– Bill Pritchard

Sept 10, 2013 PM Update

Hello everyone

To say that the last couple of weeks in the markets have been interesting, is an understatement.   Like most of us, I am glad that August is behind us, leaving us with September as the worst performing month on a historical basis, for market performance.   In plain English, of all the months in the year, stocks do the worst in September.  October is the last of the “bad months” however October also has the reputation of being a month where many new bull markets have started. Coupled with September’s reputation, is the Syria crisis and ongoing concerns over Quantitative Easing (QE) tapering.   Lets talk about some of this stuff.   Before I proceed, allow me to state that I am still 100% S-Fund.

As some of you may recall, in my August 27 post, I discussed how the markets respond to war.  In almost all cases, over history, the markets have entered an UPTREND once bombs get dropped and war is “declared.’”   It should be noted that even on 9-11-2001, the markets went UP after that tragic day.   They then entered a new downtrend, in 2002, due to other reasons not related to the 9-11 attacks.

One thing that I have observed, in the course of trading for the last 20 years, is that markets definitely do not like uncertainty or lack of clarity on important issues.  Whether it be war, economic policy, the outcome of a presidential election, etc., markets do NOT like wishy-washy or uncertain energy in the air.   Once a “stance” is made or a topic becomes more clear, the markets in almost all cases will respond immediately.   Recently, President Obama made public his position regarding Syria, and the markets reacted to this and went up, once the leader of the most powerful nation in the world made his position known.   While the politics and debates regarding the position itself have been argued, the fact that a position was established is what the markets responded to.  And the markets continue to respond to potential progress, facilitated by Russia, a country which is reacting due to the established position expressed by President Obama and Secretary of State Kerry.

Lets take a look at the charts of the SP 500 Index, and how the index performed in relation to its 50-day, 75-day, and 100-day Exponential Moving Averages.   These are moving trend lines that I use as one component of my trading system, to identify turning points and red flags, and determine trend direction.  Recall that while I consider news and economic reports to be important, the ultimate trigger for market decisions is the market itself.

On today’s date, 09-10-13, the SP 500 index traded higher on above average volume, resulting in a “gap day.”   A Gap Day is when that day’s low price, is higher than the previous day’s high price, resulting in a “gap” when displayed on a chart.   Gap-Up-Days are a very reliable bullish indicator and in almost all cases, require the trader to establish a long/buy condition.  The larger the gap, the stronger the move. Gap-Up-Days are signs of strength.  See charts:

SP500-09-10-13-GAP

SP500-09-10-13-GAP-comments

50/75/100-Day EMA Charts are below…last chart is a close-up view with comments:

SP500-09-10-13

SP500-09-10-13-EMAs

SP500-09-10-13-EMAS-CLOSE-COMMENTS

Regarding QE tapering,  it has been said that “good news is now bad news” and “bad news is really good news.”   What does this mean?   First, lets reflect on my previously discussed example of the US economy being a recovering hospital patient, and life support (QE) is no longer needed, due to the patient’s improved health.   The doctors have decided that the patient needs to breathe on his own, and it is time to disconnect life support.   With that concept in mind (and if CNBC starts to use it, you heard it on The Fed Trader first…) , good news that the economy is recovering is “bad news” because it increases the chances that QE will be tapered.   Which, nobody wants, because the QE stimulant drugs are something we are all addicted to.   So its better to have “bad news’” (poor jobs reports, poor economic news, etc.) as this means QE will likely remain unchanged for the foreseeable future.   Clear as mud ?  Does this make any sense ? (no).     But that is what is happening, period, the end.  It is not any more complicated than that.  Just don’t tell the college professors who have authored white papers on the topic or the studies showing bond prices and treasury yields and how they will determine the market’s reaction to QE tapering.   I mean, lets not make this hard folks.   1.  QE exists.  2.  QE will go away at an unknown date.  3.  The market WILL react.  4.  Responding to the market, not trying to predict it, is what we need to focus on.

For a refresher on not overcomplicating things and not trying to over analyze events, see my March 31 post on this site.   A few college professors might take a look at it, which could be titled “You don’t need to be a meteorologist to know when to use an umbrella.”

Based on my observations associated to the charts and other indicators, I believe the markets have resumed their uptrend.  My friends at Investors Business Daily newspaper announced this yesterday, on 09-09-13, but allow me to pat myself on the back and state that I was ahead of them already and never left the S-Fund.  My opinion was the uptrend never really stopped, just had some struggles in August.   At the present time, the I-Fund has outperformed the S-Fund based on a two-week “look back” basis, and may possibly continue to outperform the S-Fund.   Due to some global turbulence, I prefer to be in S-Fund for now, but if you can tolerate some volatility, my opinion is that 50% I-Fund and 50% S-Fund would be a good combination.    Me personally, I am still 100% S-Fund.

Please note that we have the rest of September to drive thru, then October, before the “worst market months” label no longer applies.   In other words, expect some turbulence and speed bumps in the road until we clear October.   With that said, any signs of life and new uptrends established in the worst market months, are great news, and I can only imagine how the markets will do once we get past October.

As always, THANK YOU for reading, and please share this site with your coworkers and colleagues.   Thanks again

– Bill P.

http://www.thefedtrader.com/

Updated FERS Guide by Dan Jamison

I wanted to update everyone that Mr. Dan Jamison has released an updated FERS Guide, edition 7.3, released on August 19, 2013.   Every federal employee should have a copy.   If you need retirement or benefits information, he is the “go-to guy” for that.

I feel fortunate to be able to reach out to Dan, to answer benefits questions that sometimes come across my desk.  I am also proud of the fact that my site, The Fed Trader , is mentioned in the FERS Guide.

Dan will present a 90-minute session at the 2013 FLEOA National Convention, in case anyone wants to meet him.  All material in the FERS Guide is written and produced entirely by Dan.   Please use the “FERS Guide” page on this site to locate the recent editions.   Thank You.

– Bill Pritchard


Aug 27 Update – War and Markets / after-action look

Hello everyone

Today witnessed the market’s response to possible military strikes on Syria.  As is typical when people respond in an emotional, panic-like state, their response is sometime without the benefit or consideration of planning or study.  As they say, hindsight is always 20/20.  Lets use some of this hindsight and take a look at war and markets.

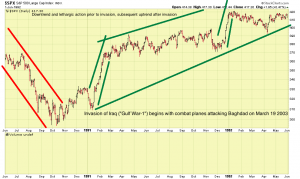
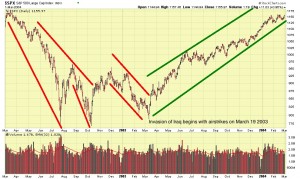
Allow me to display two charts of the SP 500, one showing the 1991 time period (US military planes attacked Baghdad on Jan 17 1991), and another one showing the 2003 time period (US military forces launched attacks on March 19 2003).    I was unable to bring up charts prior to 1991 (such as WW-II, Vietnam, etc) but in summary, previous research has demonstrated that stock markets commonly rally, when the US gets involved in military conflicts.  It can be further said that prior to US invasions, markets are typically in panic mode and/or declining.

Flash forward to 2013, and a strike on Syria is being mentioned on the news.  Syria is akin to Iraq in many ways.   Banned devices/materials.  Civilian population being attacked by their own military.  Middle East country.   No identifiable useful export besides the mass production of problems and headaches.   Same song, same dance, the only thing different is who is on the dance floor.

How do we respond to the sell-off on Aug 27 ?  That is probably the “question of the day.”   Please see attached charts.   In light of my jumped-the-gun response regarding North Korea, in which I went to G-Fund, only to see the markets then go up, I am going to “hold position” in S-Fund right now.  The North Korea situation was the threat of nuclear strike against the US, and in the absence of market data regarding strikes against US soil by other countries, I elected to move to G-Fund.    No harm/no foul, but I must admit I got nervous and moved to G-Fund.

Starting to ramble…long story short, see charts….personally I am staying in S-Fund for the time being, and trying to keep emotions and nervousness away from my decision-making.

SP500-1991-COMMENTSSP500-2003-comments

Thank you for reading.  If you find this site useful or informative, please share it with your friends and coworkers.  My TSP Allocation remains 100% S-Fund but obviously this is subject to change.

– Bill Pritchard


August 18 Update – Markets displaying weakness

Hello everyone

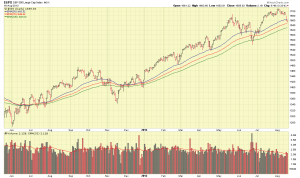
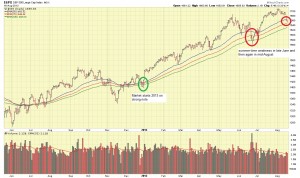
After the past week’s disappointing market action, I have decided that chewable Pepto Bismol is much better than the liquid version.   With that said, the indexes are showing weakness and we need to keep our trigger fingers close to the G-Fund trigger guard.   I am not moving yet, but I am closely monitoring the moving averages and trend lines.  One intermediate Moving Average that I use is the 75-day, any activity below this is almost a sure red flag and G-Fund signal.   See charts below, one without comments, one with comments.  The 75-day moving average is the red line.  This is used in conjunction with other data, however it’s usefulness becomes apparent by looking at the charts.

SP500-08-18-13SP500-08-18-13-comments

As you can see, we had some prior weakness occur in late June, however the market recovered and things rebounded.  As we enter August, we are yet again seeing some lack of headway.   It should be noted, that historically, August, September, and October, are the market’s worst performing months.  So, what does this mean ?   This means we are faced with the questions:  Should we disregard this poor August performance, and consider it “ops normal”, and continue forward in stock funds ?   Or should we consider this the end of the world and go to G-Fund ?    Due to my inability to predict the future, I am forced to utilize my charts, historical market notes and experience, and mathematical models to make decisions.  Cable business news shows will spend all of their broadcast day trying to answer the same questions.

In summary, one thing is for certain, the markets are displaying weakness, and a move to G-Fund may be in the near future.   Let’s see how this week plays out.

Thanks for reading and please share this site with your friends and coworkers.

– Bill Pritchard
 

August 11, 2013 Update – 100% S-Fund continues

Hello everyone

The market’s action this past week resulted in the streak of gains (six weeks worth) being paused.  This is not a big deal…July historically tends to be a lethargic trading month in the markets…our July 2013 gains were really a pleasant surprise.   Hence, this “pause” in the market’s uptrend is not causing me to lose sleep.

It is noteworthy to reflect that July’s gains (again, typically a lackluster month) resulted in the S-Fund being the top performer for the month, something I talked about in my July 26 post on this site.

It should also be noted that the I-Fund has indeed taken the lead over the other funds, a behavior which began approximately the last week of July and exists until now.  I am not going to change my TSP allocations yet, as I want to monitor this behavior a little longer, but it is something that we need to be cognizant of.   One could speculate as to why this is happening…some folks believe that the global economy is starting to strengthen, thus prompting some cautious investments in the foreign markets, and thus pushing the foreign stocks higher. 

The most recent trading week, August 5-9, was marked with some nervousness after Chicago Fed President Charles Evans’ Aug 6 comments, which signaled a possible scale-back of the Fed’s financial stimulus program.  The next Federal Reserve meeting is Sept 17-18, at which time we may see more clarity on that issue.  As discussed previously on this site, I consider the US economy a “sick hospital patient”, and as the patient recovers, it only makes sense to reduce the prescribed medications and various life support systems which are attached to the recovering patient.  Clearly some folks are worried if the patient will survive without medication and life support.  However, it is better in the long term if the patient learns to breathe on his own again.  

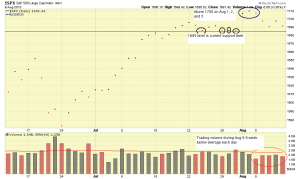
Let’s take a look at a 2 month chart of the SP 500 index, using “close only prices”, to see how things look.  I am calling 1685 on the SP 500 as our support level, as all the recent market closes seem to be at or above this.  I am happy to see that the SP 500 broke above the 1700 level, an area discussed in my July 26 post, as being a key overhead resistance area.  This occurred on Aug 1, Aug 2, and Aug 5, and returned to sub-1700 levels after that, largely due to Mr. Evan’s comments on Aug 6.   Let’s take a look at the chart:

 SP500-08-09-13

In summary, I am still 100% S-Fund at the present time, and will monitor the I-Fund to see if a change is warranted in our TSP Allocations.  Note that August and September are typically the worst performing months of the entire calendar year, so any declines during August and September may or may not be a departure from typical historical behavior.

As always, if you find this site useful or informative, please share it with your coworkers and friends.

Thank you for reading

         Bill Pritchard

July 26 Update – 100% S-Fund continues

Hello everyone

Just a quick note that things, as I see them, are in my opinion “ops normal” and I am 100% S-Fund in my account.  This week, my indications are that the I-Fund outperformed the other funds on a one-week basis, however I am not basing any trading decisions on this one week performance.  My data indicates that the S-Fund is the overall July winner (so far).

The indexes are reflecting “cautious” accumulation, in which more money is coming into the market versus money going out, with the NASDAQ (a tech heavy index with many up and coming companies), performing well.  I say cautious because July witnessed some down days…large investors are not jumping into the market with both feet.  In my opinion some Bernanke nervousness and other things are still in the air, affecting enthusiasm.

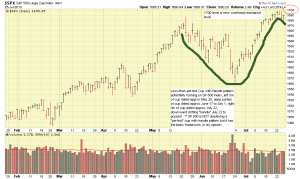
My charts of the SP 500 index reflect a potential Cup with Handle pattern forming, which is a pattern discussed by William O’Neil of Investor’s Business Daily, associated with bullish behavior.  The particular pattern underway now is NOT a perfect cup with handle, but in my opinion, it is closer to being a Cup with Handle than not being one.  Please see images below

Tea_Cup_Design_by_rafibashir79

SP-500-07.25.13

Another observation that I have, is that the 1700 level on the SP 500 appears to be our new area of “overhead resistance”.  Any activity at, and above this, will  make the headlines as this is a new All Time High and the area of resistance.  The SP 500 hit 1698 on July 23 and July 24 than cooled off somewhat and came down from those levels.   Keep an eye out for 1700.

1670 is our support level and anything at and below this is undesirable.  On July 11, the Sp 500 had what I call a “thrust day” where its intra-day performance was much better than the prior days, with the index closing higher than the prior day.  This is akin to a person whose max bench press per workout is 200 lbs.   For five days he maxes at 200 lbs each day and on Day-6, he is able to magically bench 300.   The next few days after that, he is lifting 200, 240, 220, 205.  However you now know that 300 is possible.   That is what I see in the indexes.   Some one-day bursts of strength, a few flat days, another one-day burst, etc etc.  The summer months July-Aug-Sept tend to be lackluster, so I am happy to have July’s gains.

With that said, I remain 100% S-Fund in my account.   I will update folks as the situation warrants.   I ask that if you find this site useful or informative, please pass it to your colleagues and friends.

Thank you

– Bill Pritchard

July 11 Update – return to 100% S-Fund

Hello everyone

Arriving to the end of the first complete trading week after the July-4 holiday, I am happy to announce that the markets have closed higher each day, than the prior day, and are exhibiting the signs of a resumed uptrend.  The volume is not as high as I would like it, but the behavior across multiple days gives me the confidence to return to the S-Fund.   This week, the I-Fund actually outperformed everything else, but I am still a little skittish about the international markets in light of still unresolved issues internationally, such as Egypt, Syria, the Greece economy, etc.    If things settle down, I may be inclined to invest in the I-Fund.

No cool graphics today, just my opinion that G-Fund “safe haven” is no longer needed and it is safe to resume investments in the S-Fund.

Thank You.   Also take a look at the FAQ as I will be updating it over the next few days due to some good email traffic sent to me.   Lots of folks with great questions.

Thanks for reading….please share my site with your colleagues and coworkers if you find it useful or informative.

– Bill Pritchard