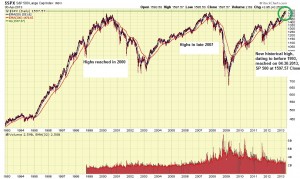
July 8 2013 late PM Update

Good Evening

A very short update, as I want to see how this week shapes up.   On Monday, July 8, the market participants returned from the holiday with plenty of enthusiasm, sending the indexes up, on above average volume.  The SP 500 closed at 1640, which is an excellent sign, and ten points above our prior overhead resistance level of 1630.   July 8 price action resulted in a “gap” in which the low of July 8 was higher than the high of the previous trading day (July 5).  This results in a “gap” on the price chart.   This is a result of intense buying and accumulation, all of which are positive for the market.

Please stay tuned for another update later this week, as I want to see how the market does over the next few days.  However, this is a positive start to the week.   Lets keep our fingers crossed that it is not a one day fluke (I doubt it is…)

Thanks for reading

– Bill Pritchard

July 2 late PM Update – TSP Allocation 100% G-Fund

Hello to everyone

This week began on a positive note, with the SP 500 and other indexes closing up on Monday July 1.   The trading volume was not as high as I would have preferred, and as such, these “up moves” have questionable credibility.   Volume is the horsepower behind the move, and it is not where it needs to be yet.  The perfect day is an “up day” (end of day closing price is higher than the start of day price) on above average volume, ideally 25% (or more) above its average trading volume.  These two things, when occurring during one trading day, is a positive thing.  Not one, not the other, but we need both.

Note that this week will likely see light volume the entire week, due to the July 4th holiday and reduced trading activity this week.

My personal observation is that we are looking for the SP 500 index to CLOSE at or above 1630 on multiple back to back days in order to believe that any new upward movement in the indexes are for real.  Let’s see how the next week or two play out.   It should be noted, that the months of July-August-Sept are historically (absent a few occasional deviations from this trend over the years) the worst performing months of the year.   What does this mean?  It means that if July 2013 is “down”, this does not mean that the world is ending.   Historically, July (and August and Sept) tends to be down.   Of course, we let the market tell us what to do, and if Mr. Market decides to give us great returns in July, I am not going argue and will take what he gives me.

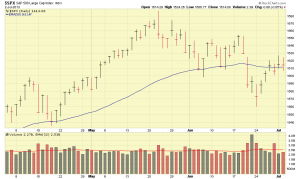
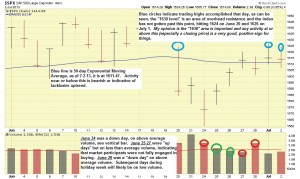
On July 2, the indexes performed well during most of the day, then turned downward in the afternoon, with the SP 500 closing below the 50-day Exponential Moving Average (EMA), which is a key trend line, to help determine trend and health of the market.   The 50-Day EMA is 1611.   This EMA will change as the days ahead progress, but for now the thing to be aware of is that a “close” (last price the market traded at when it closed/stopped trading for that day) near or below 1611, is not desirable.

Let’s take a look at two charts of the SP 500 Index, one with a 3 month view, and the second chart being a 1-month view, with my comments.

SP500-07-02-13

SP500-07-02-13-II-comments

I am personally still “long” (holding stocks that I bought) in my personal brokerage account, and since they are still doing relatively well, I have held on to them.  However, my TSP Allocation is 100% G-Fund.  I will monitor things and advise everyone as warranted.   I recommend everyone watch the SP 500 index and keep their eyes out for activity at or above 1630.    The remainder of the week will likely be low trading volume and thus, whatever happens, is probably not worth considering for our decision making.  If you turn CNBC off the rest of the week, you probably won’t miss much.

Thanks for the interest in the site, and if you find the site informative or useful, please pass it to your friends and coworkers.   I have received quite a few nice emails this month, thanks for those.

Take care everybody

– Bill Pritchard


TSP Allocation 100% G-Fund

Hello

Today, Monday June 24, witnessed another volatile day as the world worried if the patient would breathe on his own, after it was discussed last week by Ben Bernanke that the breathing machine would be disconnected in the future (see my earlier analogy reference this example).   The markets closed down on above average volume.

It is my opinion that a move to the G-Fund is in order, to reflect 100% future contributions and 100% of your account balance, to be shifted to G-Fund.

Me, personally, I am still a cheerleader of our economy (the recovering “patient”) and believe things are slowing turning around, and have my own facts to prove it.  However that does not mean I am going to try to catch a falling knife, and it is my opinion that a precautionary move should be made to G-Fund.

I might add that I have struggled with crafting this post, as my feelings about the overall economy and long-term stock market are very positive, however trading and investing on emotion is an amateur mistake, and I had to remind myself to step back, look at the market itself, and pull the trigger accordingly.   Unfortunately, we have had some down days and we need to protect our account balances.

On that note, I invite everyone to take a look at this 06-24-13 video, courtesy of CNBC, in which Rick Santelli is interviewed.  The short version is Santelli’s position is that the market is going to do what the market is going to do.

I am moving my balance and future contributions to 100% G-Fund.  Thanks for reading everyone…hopefully these storms clouds clear up in a few weeks.

– Bill Pritchard


Officer Jaime Padron Memorial Park project

In the “other news” category, I wanted to post an update to a very important project that has been in development.

On June 18, 2013, the San Angelo, Texas City Council approved the renaming of Rio Vista Park, to Jaime Padron Memorial Park, to honor USMC veteran and Police Officer Jaime Padron, who was killed on duty, in 2012.

Video Link is at http://www.youtube.com/watch?feature=player_embedded&v=zQSUYXfLJq8

Please scroll to 0:29:23 in the video and hit play, to view the City Council discussion of this project.

YouTube Preview Image

Below, is a Google Earth image of the park, which is under renovation and when work is completed, will be re-opened under Jaime’s name.  I will be there in July and will take some pictures of the ongoing renovation efforts.

RIO-VISTA-PARK.jpeg


This project was the result of many folks coming together and working towards a common goal, and as the initiator of this important project, I can’t say enough thanks to the great people in the San Angelo City Council, specifically Mr. Johnny Silvas, of Single Member District 3, Matt Baldwin, Brian Bylsma, and Johnny Padron.  Thanks to Austin Police Chief Art Acevedo for his tremendous support.  These great folks were the reason that this was successful.

Thank YOU

– Bill Pritchard

TSP Update / June 19 2013

Hello everyone

Today, Ben Bernanke stated that the Fed would likely start reducing its stimulus program.  Markets closed down on above average volume, but above key trend lines.

I want to allow this week to “close out”, after which I will take a look at things and share my insights early next week.   I might add that markets typically panic for a day or two, then re-stabilize, when bad news is released.

NOTE:  My position is that the US Economy is a hospital patient, hooked up to life support (Federal stimulus/QE programs).  Well, the patient is starting to get healthier, and it may be time to remove life support and allow the patient to breathe on his own.  This is good for the patient, not bad (allowing him to breathe on his own).   The patient will cough and moan and probably ask for that machine again, but big picture, if the patient starts breathing on his own again, and continues to do so, the patient will be stronger and better-off.

During the window of time, between when the doctor’s fingers hit the “OFF” switch on the machine, and when the patient starts to breathe unassisted, during this transitional period, the onlookers in the room will be worried, nervous, and probably praying.   Right now, today, we are in that period.

I had dinner with a fellow subscriber last night who was TDY to my city, and this topic came up.    My explanation sounds a little corny, I wish I could produce a Princeton PhD dissertation regarding financial friction and macroeconomics (someone else wrote it) , but my explanation gets the point across.

Lets see how the week finishes up, and expect another update soon.   If you find this site useful or informative, and it has materially impacted your Thrift Savings Plan (TSP) performance, I ask that you share it with your friends and coworkers.  I can’t place advertisements in the Wall Street Journal, and rely on word-of-mouth for building my subscriber base.   Thanks for reading

– Bill Pritchard

TSP Allocation:  100% S-Fund but monitoring things closely over next few days.


TSP Allocation 100% S-Fund / June 4 2013 late-PM Update

Hello and Good Evening to everyone

The month of May is behind us, and while a few of you have emailed me regarding the “Sell in May” strategy, I advocated that we let the market tell us what to do, and respond to the market itself.  It is very hard to “outguess” the market.  My investing methodology can be categorized into the Trend Following category, and this past month was a good example of why this strategy tends to be successful.

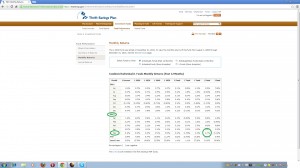
It should be noted that the SP-500 Index closed at 1582.70 on May 1, and on May 31, closed at 1630.74.  This represents a 3.0 percent gain in May on the index.  In today’s turbulent market climate, I am happy to take any gain the market gives us.    Please see below table representing the official TSP site monthly returns.

TSP-MAY2013

As can be seen, the top fund for May 2013 was the S-Fund.  It should be noted that the I-Fund was down -3% for May.  This is while the US Indexes were generally all positive.  Some may recall my observations regarding the I-Fund, observing that its April performance may or may not have been sustainable.  The I-Fund is a weird animal, much more susceptible to international politics and global economic turbulence.   This can at times put tremendous gains on the table, and sometimes take them away.  The I-Fund sometimes runs in sync with US markets, and sometimes it does not (as shown by May’s behavior).   This is not a “knock” against the I-Fund…however at times the I-Fund requires that your seat belt be tightened a little more than if you are in the S/C Funds.

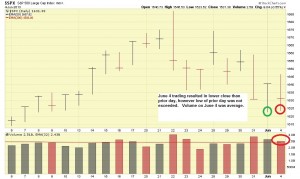
June opened up on a positive note, with the indexes performing very well on June 3, 2014, closing higher than the prior day, on slightly higher than average volume.  I would have liked the volume to be a little higher, but I will take what I can get.  On June 4, 2013 however, some nervousness about the Federal Reserve’s low-interest rate and bond buying programs (aka QE or Quantitative Easing) have caused the markets to go lower.  One June 4, the SP-500 closed lower than June 3, on average volume.   No “high volume sell off” occurred on June 4, nor did it trade lower than its low of June 3, which was 1622.72.   However, we still need to monitor things and keep the trigger finger ready for G-Fund if the situation dictates.  See chart below.

SP500-06.04.13-comments

As a counter to this, Big-picture wise, we are seeing positive news reports regarding the economy, involving reports of rising home prices (indicating buying, versus selling of homes), reports of rising car sales, and other things.  In summary, I am not (not yet) going into panic mode over the Federal Reserve market nervousness….I see other positive signs regarding the economy.

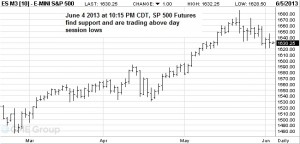
At 10:15 PM Central Time June 4, the SP-500 evening futures contract found support and did not trade below the daytime session.  This usually (but not always) foreshadows what will happen on the next day’s stock market trading activity.  See chart:

SP500-futures-06.04.13

Once again (not bragging, but….), this site provided accurate insight into the best performing fund.  Since January, I have expressed my opinion that the S-Fund is the place to be, barring the move to G-Fund in April, due to North Korea’s threat of nuclear war.  However, most can agree that since January, this site has provided accurate and informative guidance into the funds, ten of which exist, and almost every month since January, I have successfully called the top fund, out of ten potential choices.  An internet search will reveal many “TSP advice” websites, mostly all subscription/payment based.  This site has likely outperformed them all (to my knowledge) and is free.  If you find this site useful, please pass it to your friends and co-workers.  Thank you for the interest and the numerous positive emails.

Thanks again for reading….

– Bill Pritchard

TSP Allocation:  100% S-Fund


May 22, 2013 Update / TSP Allocation remains 100% S-Fund

Hello everyone

As most of you know, May has been a great month so far for the markets.   All of the indexes are performing very well, and my preliminary proprietary data is reflecting that S-Fund will be the leader for this month.   Today is May 22, so that leaves us with six (6) more trading days in the month.  It should be noted that the markets are closed on Memorial Day, May 27.

Today witnessed some nervousness in response to the release of the recent Federal Reserve Board meeting minutes and testimony by Ben Bernanke to members of Congress.   In summary, Ben Bernanke told Congress that the bond buying program in place, may slow, and that monetary policy may become tightened in the future.

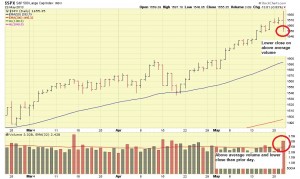
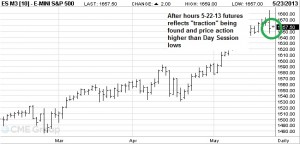
As a result, the SP 500 Index closed lower, on very high volume.  However I don’t believe this is reason to panic, as the evening SP 500 futures trading indicated that “traction” was found and the futures were trading higher than the day session lows.   See charts below:

SP500-5.22.13 SP500-futures-5.22.13

Again, I am not overly concerned about the nervousness surrounding the monetary policy, but in the end, we must let the market tell us what to do.  For now, things are still good but today’s downward price action on high volume is an attention-getter.   It will require that we closely monitor things in the weeks to come.   Note that Friday May 24, will likely be a low volume day, due to traders on Wall Street not being at work, having left early for the long weekend.  So whatever happens Friday, should probably be disregarded.

My opinion is that the economy is on the rebound and things are looking positive.  My personal TSP Allocation is 100% S-Fund.   At this point, 100% S-Fund or 50% S-Fund and 50% C-Fund would both be fine.

I wanted to say “thanks” for all the emails and compliments sent.  As always, if you find this site useful, and/or your TSP balance has benefited from the information posted here, please pass the site to your friends and coworkers.

Thanks for reading….

– Bill Pritchard

May 6, 2013 Update / Warren Buffett believes economy coming back

Good Evening Folks

I am TDY on my MacBook Retina, and while this $2000 laptop is a marvel of engineering, the owner (me) can’t figure out how to cut and paste graphics into my site.  I forgot my mouse and am using the trackpad.   My apologies….

Skipping cool graphics and charts, for now, I am happy to see that May is off to a great start.   The SP 500 is above 1600, and things are looking “up.”    The official TSP monthly returns are in, and the I-Fund knocked it out of the park for April and I-Fund was the best performer for April.  The Year to Date best performer is still the S-Fund, but as the other funds start to demonstrate life and energy, we need to monitor those funds closer.    May got started with C-Fund and S-Fund outperforming I-Fund however.   So the April burst of life for I-Fund may (or may not be…) be an isolated burst of life.

I would like to present the following video, from CNBC, in which NetJets Fractional Jet program is profiled.   In this video, Warren Buffett is interviewed, along with NetJets CEO Jordan Hansell.   While Warren is not really a “stock investor” per se, since he buys entire companies, and turns them around, obviously if Warren talks then it would be probably be smart to listen at least a little bit.  I believe that NetJets is a good barometer for the economy because while many owners are wealthy individuals, who have ownership in NetJet aircraft who travel to Aspen and ski, many are corporations that are “up and coming” and prefer not to use airline travel, but cannot write a check for a $40M Gulfstream.  NetJets bridges the gap and fulfills a corporate/executive travel solution.

It appears that NetJets business is coming back, and this is reflective in my opinion, of the economy.   This is consistent with my own travel observations (I was on the road approximately 200 days in CY 2012), that private aircraft ramps are becoming more crowded and business-oriented hotels such as Marriott and Hilton are seeing less availability of rooms due to increased business travel.  These, too, are reflective of the economy, in my opinion.   Full hotels and lots of private jets at airports are not reflective of a pending recession, I guess that’s my point here.  Lets take a look at the video:     VIDEO LINK

That’s all I have for now, I am 100% S-Fund at the present time.  This may change depending on how the other funds perform this month.

Sorry no cool graphics…..forgot the mouse…..

Thank you for reading

– Bill Pritchard


April 30, 2013 Update – SP 500 at Historical all time high / Updated FAQ section

Hello everyone

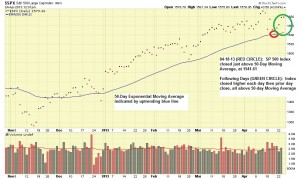
Doing some market analysis tonight…the main “headline issue” and great news is that today, 04/30/2013, the SP 500 index hit a historical, never before touched, all time high, closing (closing price is always better than intraday price activity) at 1597.57.   See chart below with comments.

SP500-04-30-2013-comments

This month, the I-Fund has had some bursts of life, and April TSP data will possibly reflect the I-Fund as the April top performer, however this is not necessarily a reason to switch to I-Fund.   This does however require that the I-Fund be monitored for continued positive performance and after everything is assessed, we can entertain a possible move.  S-Fund and C-Fund are doing well also, and I am personally still 100% S-Fund.

I should add that the “general public” is still skittish about returning to stocks,  however as this market uptrend (hopefully) continues, people are going to want some of the action and ease back into the market.  At that point, the trend (as people enter the market, having been in the bleachers watching things…) will then likely grow even stronger.

Again, today witnessed great news, in the form of the historical all time high in the SP 500 Index.  The occurred on slightly above average volume, I would have preferred a little more volume, but I will take what I can get right now.

I remain 100% S-Fund and will be monitoring the I-Fund.

Also, please see FAQ section as many have sent me some valid and great emails this month and I put some in that section.

Thanks for reading, and if you find this site and the updates useful or informative, please pass the word.   Thank YOU

– Bill Pritchard


April 25, 2013 Update

Hello everyone

The markets have rebounded from last week’s dismal performance, which was arguably caused by the tragic events surrounding the Boston Marathon, poor economic news from China, and other factors.

As we know, the suspects in the Boston Marathon incident are either dead or in custody, due to the great work and cooperation between members of the public, and our law enforcement and public safety community.   There is no doubt that their quick capture/demise “sends a message” to the world, and as we finish up this week’s trading, the markets have (not surprisingly) rebounded, as uncertainty and questions regarding the Boston incident are now able to be addressed.

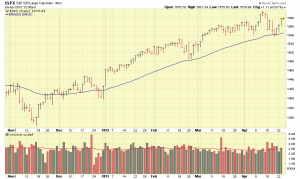
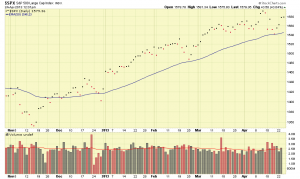
Some have emailed me and asked me why I did not panic regarding last week’s downtrend.  As most of you know, I use a combination of fundamental and technical analysis, combined with historical “look back” at similar events and situations when I see the market begin to stumble.   One of my tools in my “toolbox” is the use of Moving Averages, which in simple terms is a moving trend line which responds to the price activity of a stock or index.  A very popular Moving Average is called the “50 day Moving Average“, and my backtesting and research reflects that as long as a stock or index closes (not intra-day price behavior but closing price) at or above this line, then the trend is likely to remain intact.  Multiple closes below this line is a warning sign (coupled with other data and information prior to pulling the sell trigger).  My use of Moving Averages was documented in an article written by me, published in the January 2006 issue of Technical Analysis of Stocks and Commodities Magazine, which is sold nationwide at Barnes and Noble.

Lets take a look at the CLOSE ONLY price performance of the SP 500 last week.   See charts attached.  First chart is normal price chart, showing high, low, and close, second chart is close only with no comments, second is with comments.
SP-500-04-24-13

SP500-CLOSE-ONLYSP500-CLOSE-ONLY-COMMENTS

As we can see via the above charts, the same information becomes more clearer depending on how it is viewed.   Time allowing, I like to use “close only” charts when we hit speed bumps in the road, and by combining this with other data and information, I am typically able to make a decision and rest better knowing the decision was made with all available information.

On April 13, 2013, I posted some commentary regarding the Boston Marathon bombing and how the market may respond.  In support of that post, I went back to some historical events, to include the 9-11-2001 attacks.   The markets at that time (let’s remember, behind the markets are people and emotion) responded initially with a downtrend, then rebounded strongly and went up.   So my crystal-ball (which rarely works but I still keep it on my desk….) told me that unless human beings got reinvented and the new 2013 versions of humans on Wall Street did not have fear, greed, panic, hope, etc running through their veins, then the market response to Boston would probably be similar.

It turns out that my crystal ball decided to work, as a look at chart one above, shows an apparent “U turn” or reversal to the downtrend and an apparent resumption of the uptrend.    Time will only tell if this uptrend continues.  We are seeing some resistance in the 1575-1585 area.   Most will remember that 1576 is the prior all time high, dating back to 2007 (already penetrated), and is still recent enough to be a significant area, and any close above 1576 is a positive.  1597 is the newest recent high, achieved on April 11 2013.  Anything above that represents new territory and further confirmation of the uptrend.

On 04-25-13, the SP 500 climbed thru the 1575-1585 resistance area and was able to hit 1592 intra-day, before closing at 1585.   So we are seeing some definite attempts to get up to new high territory.

If all that sounds like Greek, in summary, any SP 500 price action above 1576 is good news, and as of now, the the next goal is price action above 1597.  Anything below 1570 is indicative of sickly performance and this will require close monitoring of the index.

I continue to advocate to use the SP 500 Index as a “big picture” view of the markets.  Some have emailed me, asking why I don’t use NASDAQ or the Dow.  The NASDAQ is susceptible to being driven lower by major NASDAQ members such as Apple (AAPL), which has suffered some setbacks to its stock performance in the last few months.  However just because AAPL is going down, does not mean that the entire stock market is going down.   The SP 500 is 500 stocks and in my opinion offers a better assessment of market health.

With that said, I am still 100% S-Fund, as it appears that the S-Fund will perform best this month (or “least worst” given the various market issues this month).

Thank you for reading.   As always, if you find this site useful or informative, please forward this to your friends and coworkers and encourage them to sign up for free email updates.  Thank You

– Bill Pritchard