Panic continues to rule the Markets


Hello Everybody-

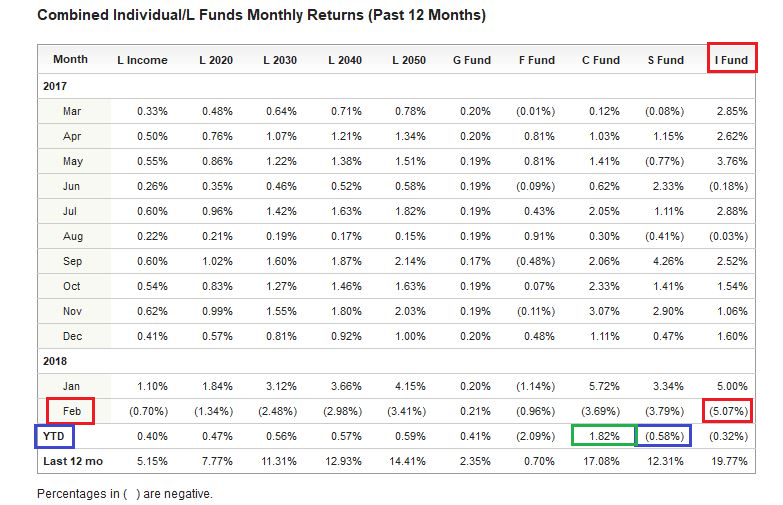
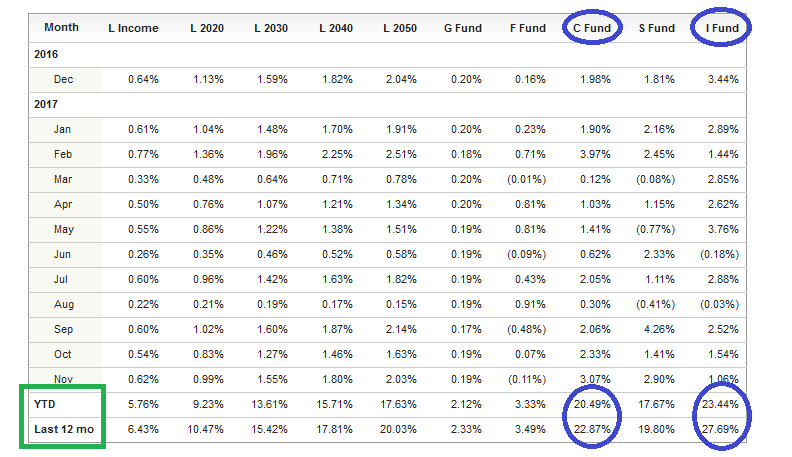
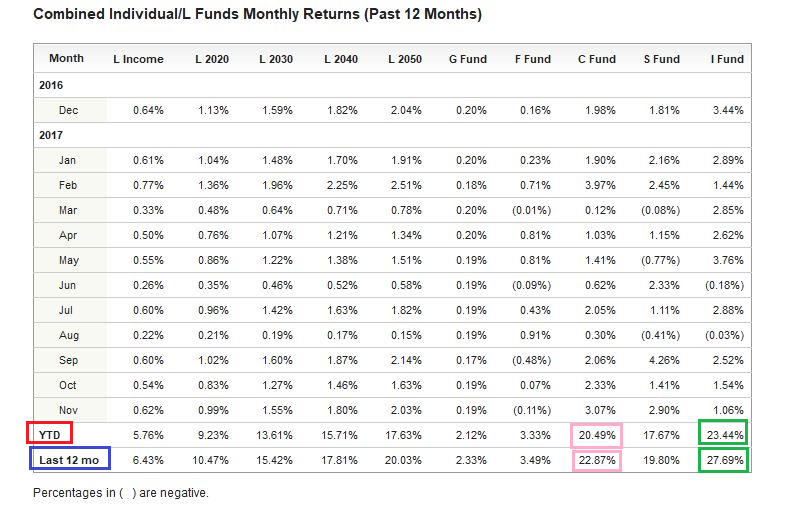
Bottom Line Up Front:  My TSP Allocation/Contributions remain 50% C-Fund and 50% S-Fund.   NOTE:  The I-Fund may outperform one or both US based stock funds this month, however my personal preference is to remain US-focused for now.

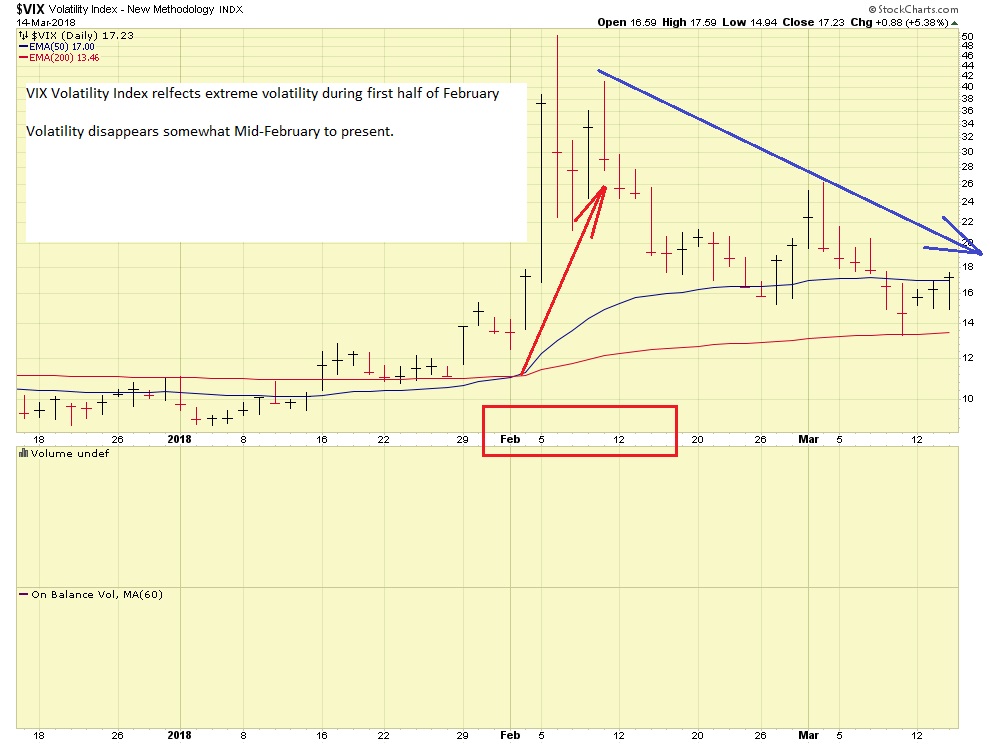
My last post, 30 days ago, discussed the volatility in the markets and how the markets are mostly reactive to non-economic events.  Panic and fear seemed to be the rule of the day.  Unfortunately, practically nothing has changed since that post, hence this somewhat delayed “update” 30 days later.  I was hungrily waiting for a new event, a new development, to catapult things in a new direction.   Nothing, to include my TSP allocation, has changed since my last post.  The following events have occurred, all causing varying degrees of fear and panic and subsequent volatility:

March-13:  Chief Economic Advisor to President Trump, Gary Cohn (former Goldman Sachs) resigns.  Cohn was of the anti-impose-tariffs mindset.  He did not want tariffs on China.  Cohn was replaced by Larry Kudlow, thus mitigating some Wall Street acid reflux over Cohn’s departure.  Same date: last day for Secretary of State Rex Tillerson.

March-20,21:  Federal Open Market Committee (FOMC) convenes.   We later learn that three rate hikes could occur in 2018 and that the FOMC believes the economy is doing very well.

March-23:  Tariffs “take effect” this day, having been publicly discussed weeks prior.

April-9:  National Security Advisor McMaster leaves office

April-11:  House Speaker Ryan announces that 2018 will be his last year as member of House.  Ryan was an anti-deficit, reign in government spending guy.

April-13:  Military action by US, UK, French forces with 105 bombs dropped on Syria.

Can anyone blame Mr. Market for having some indigestion lately?  Let’s take a look at recent market action as I make my case for my continued equity/stock exposure.  To be clear:  I do not see the G-Fund in my near future at all.  Let’s talk about this….

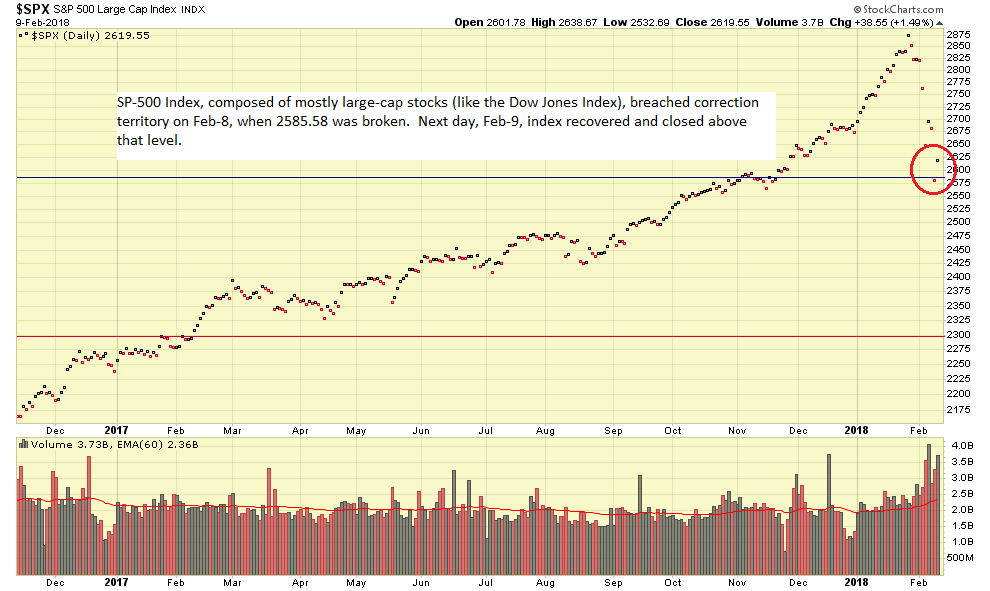
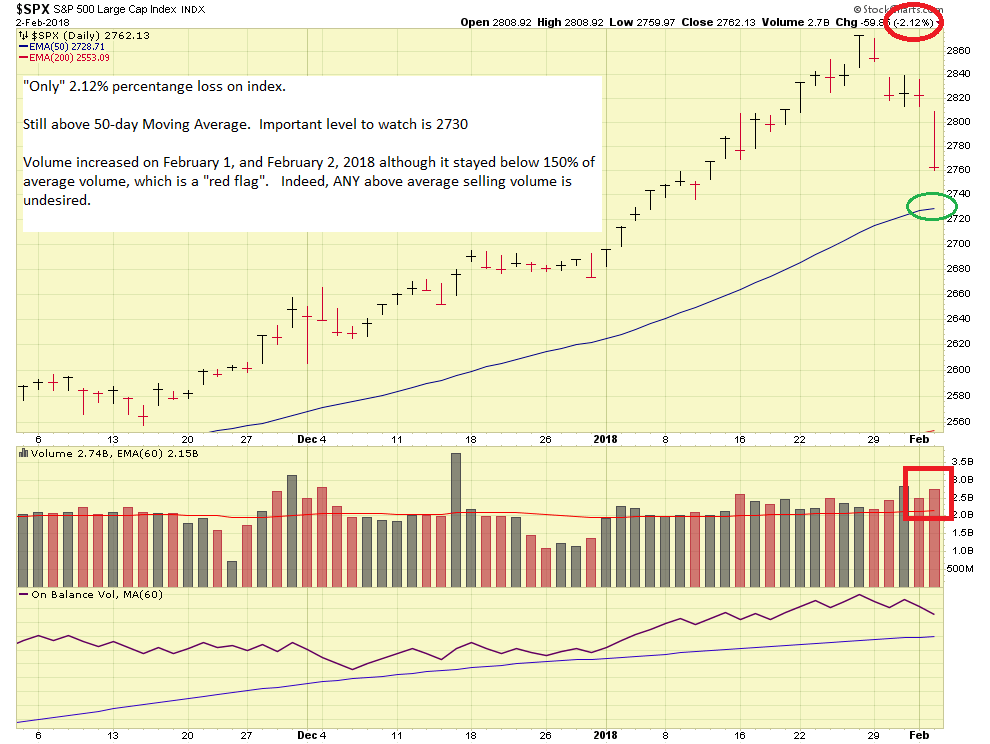
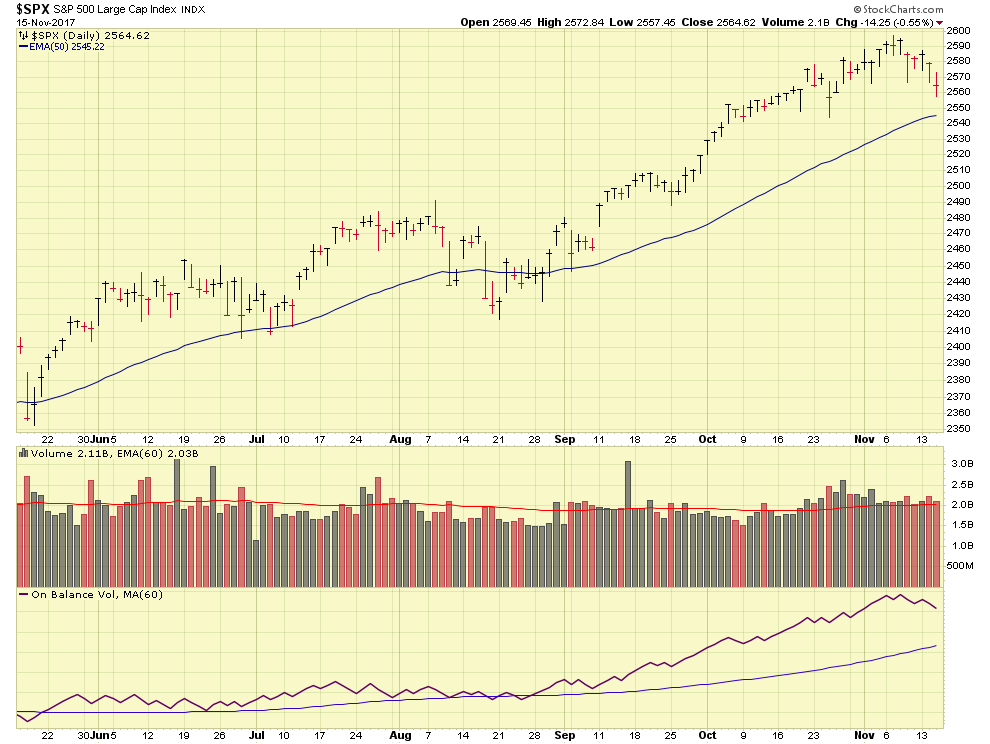
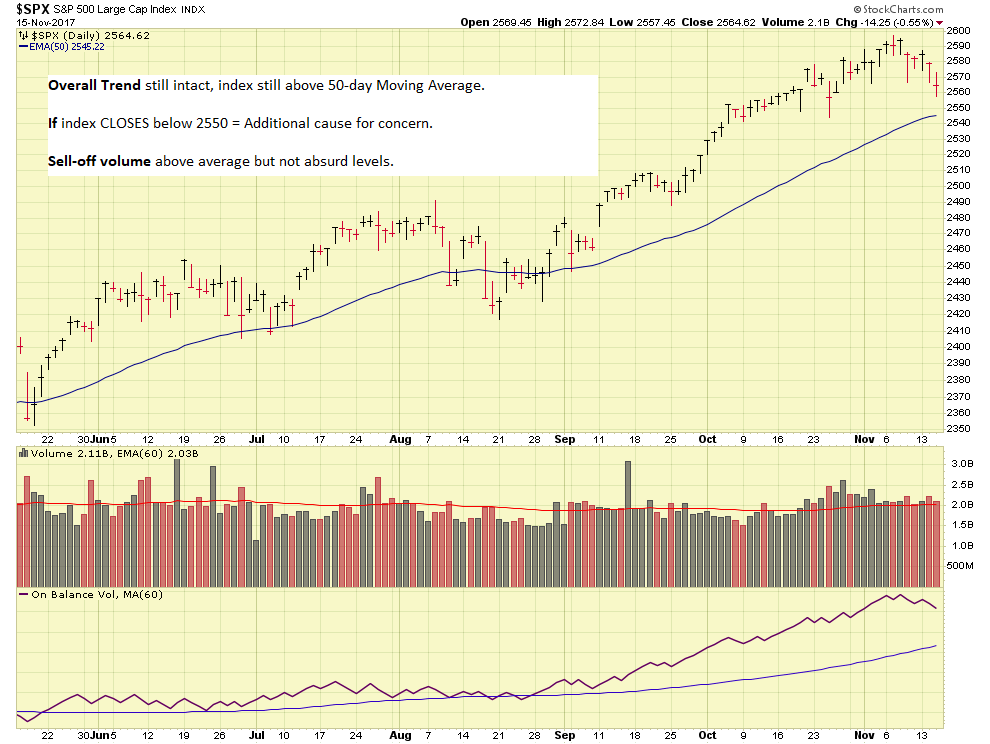
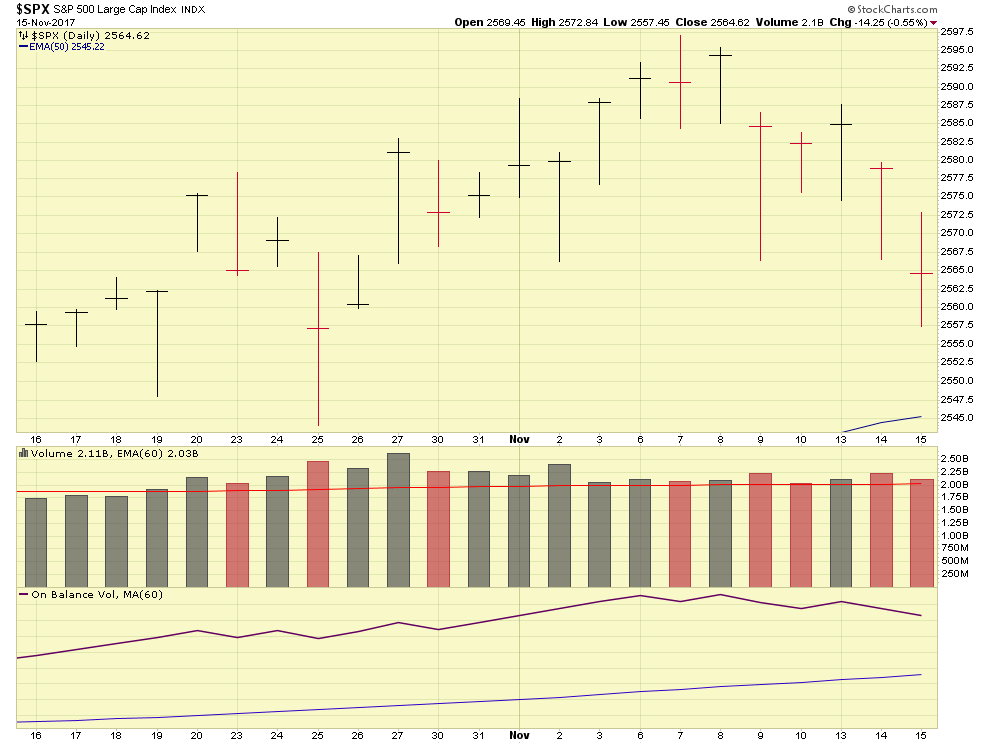
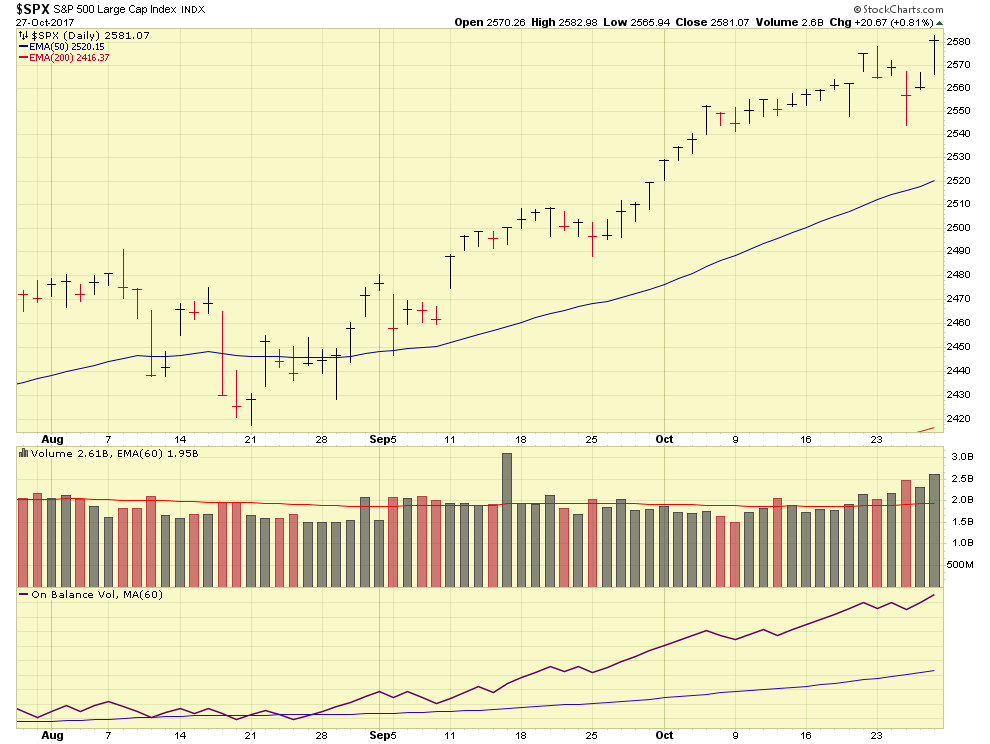
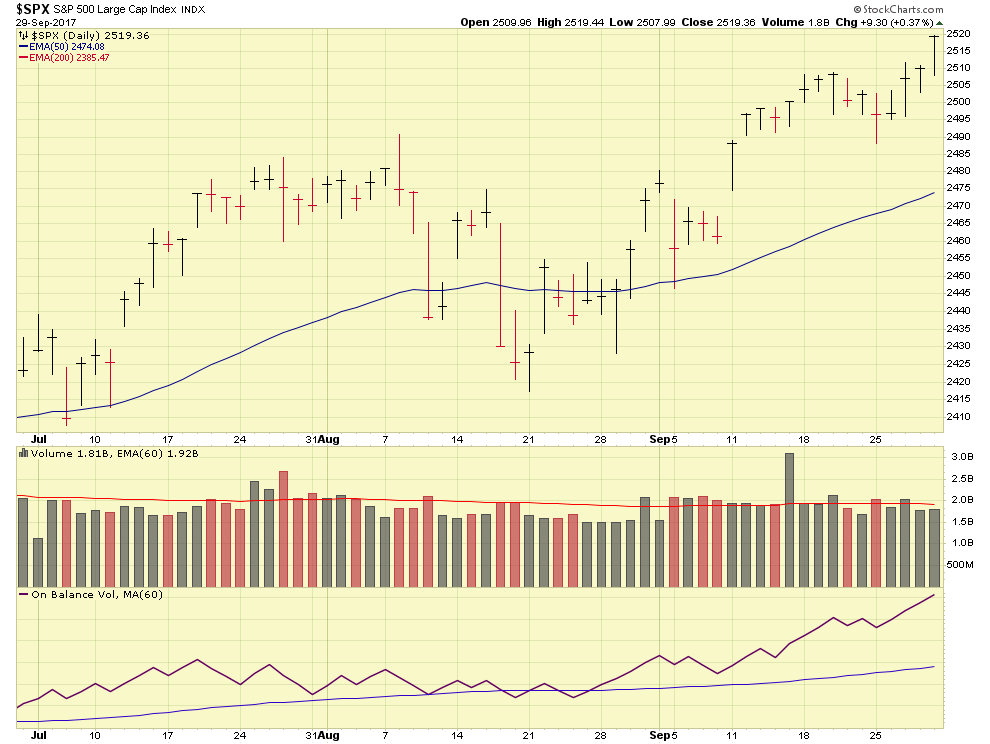
Note that the SP-500 Index, my “default market thermometer” has been so volatile that this update will use “Close Only Prices” (the price of the index when the market closed).  This will remove the intra-day price swings from the chart and give a (somewhat) clearer picture of the action.   Chart below:

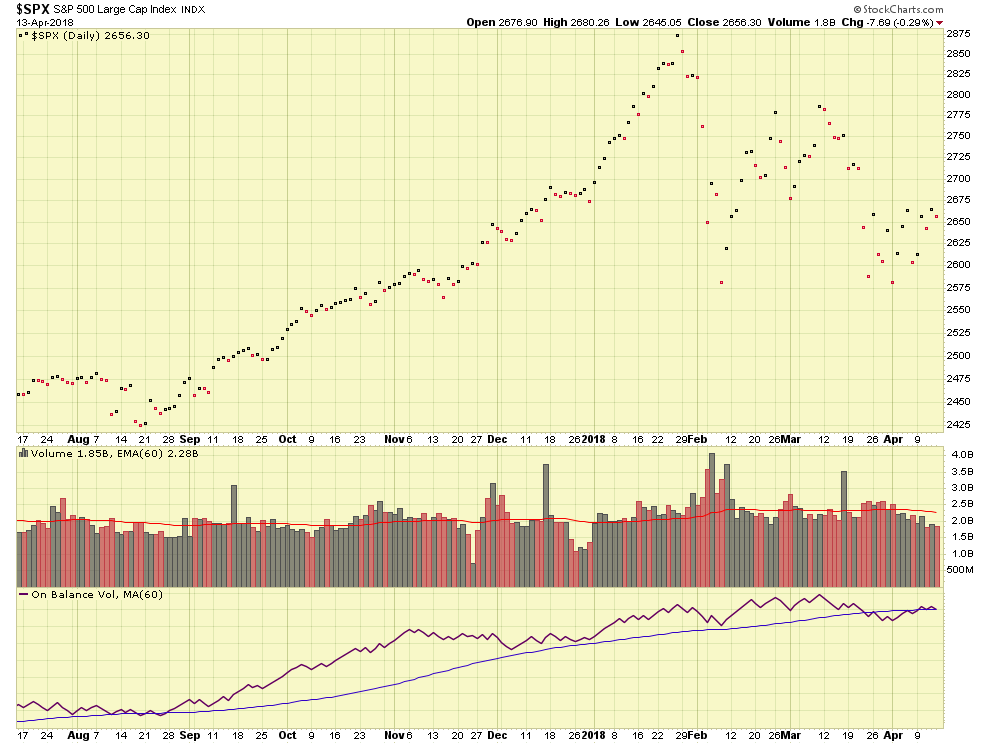
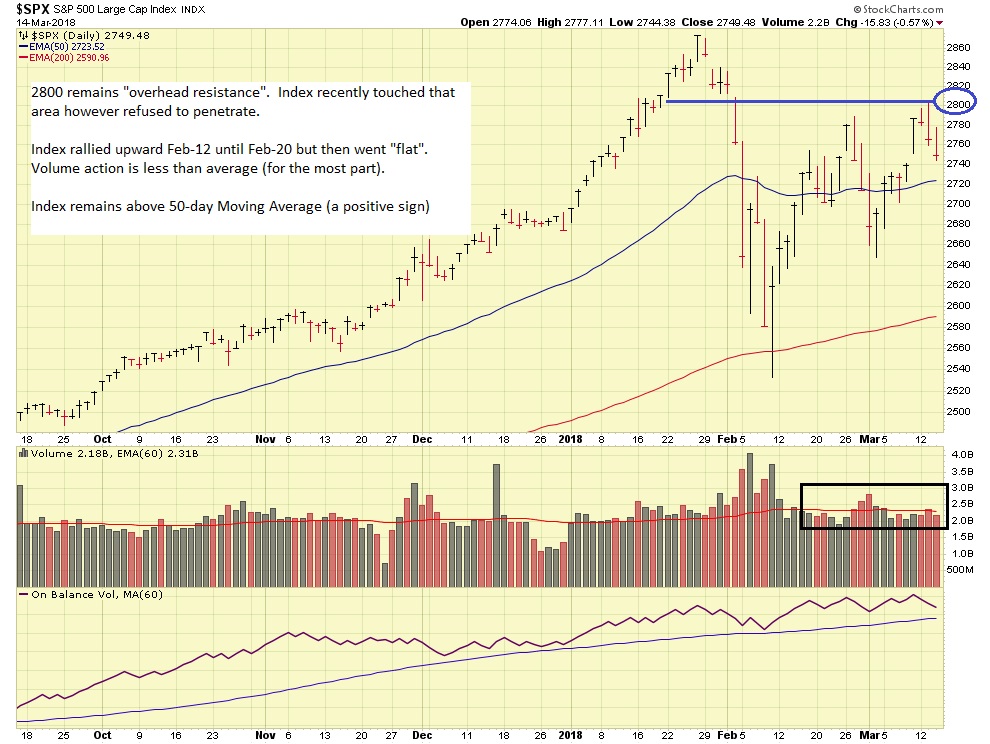
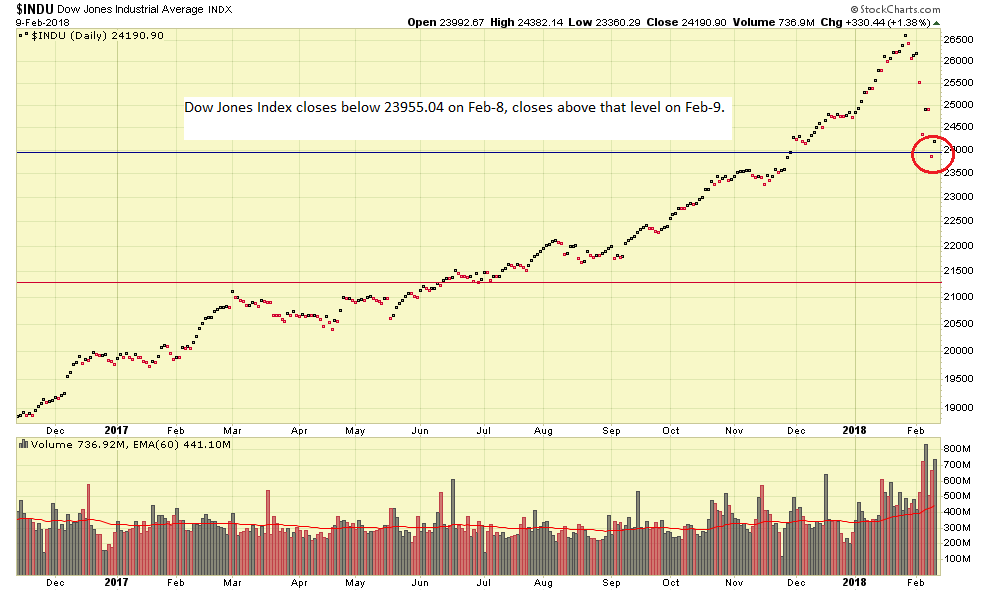
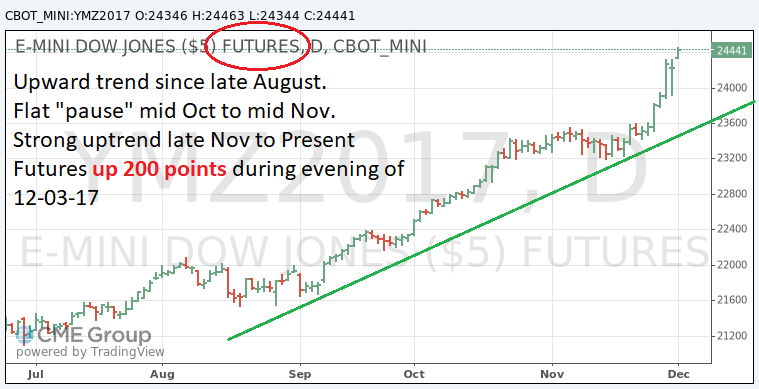
You will see that short-term (going back a few weeks), the “overhead resistance” is 2675, while longer term overhead resistance is 2800.   Operationally, this means when you watch CNBC’s ticker symbols, if it closes above 2675, that is great, however save your celebration as we need it to close above 2800.   Note that “support” is located at 2575.   We do not want any closes below this level.  As I have said earlier, the Dow Jones is only 30 stocks (mostly larger industrial-oriented companies aka oil/gas, construction equipment, etc) and they do not necessarily represent the entire stock market.  The business media likes the Dow because triple digit point swings make great headlines.

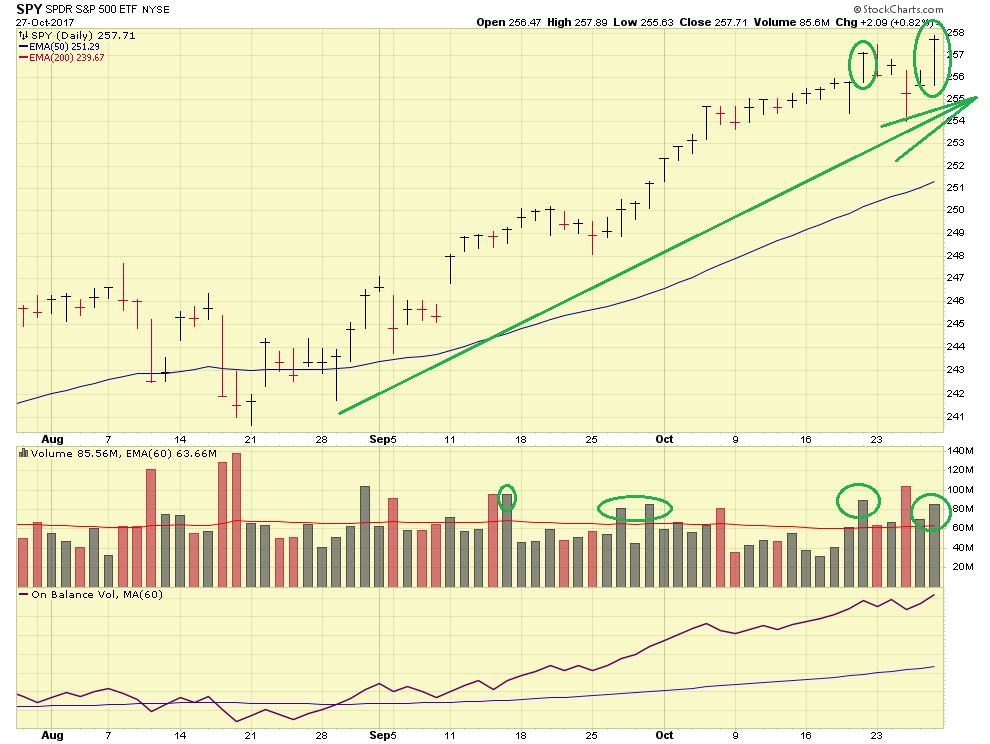
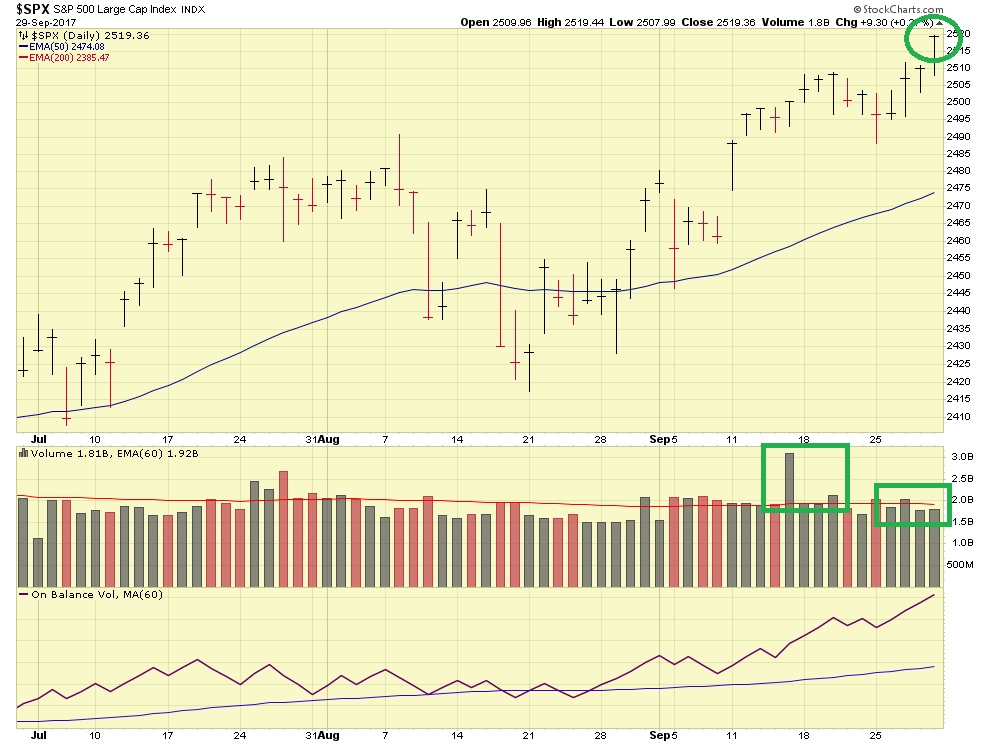
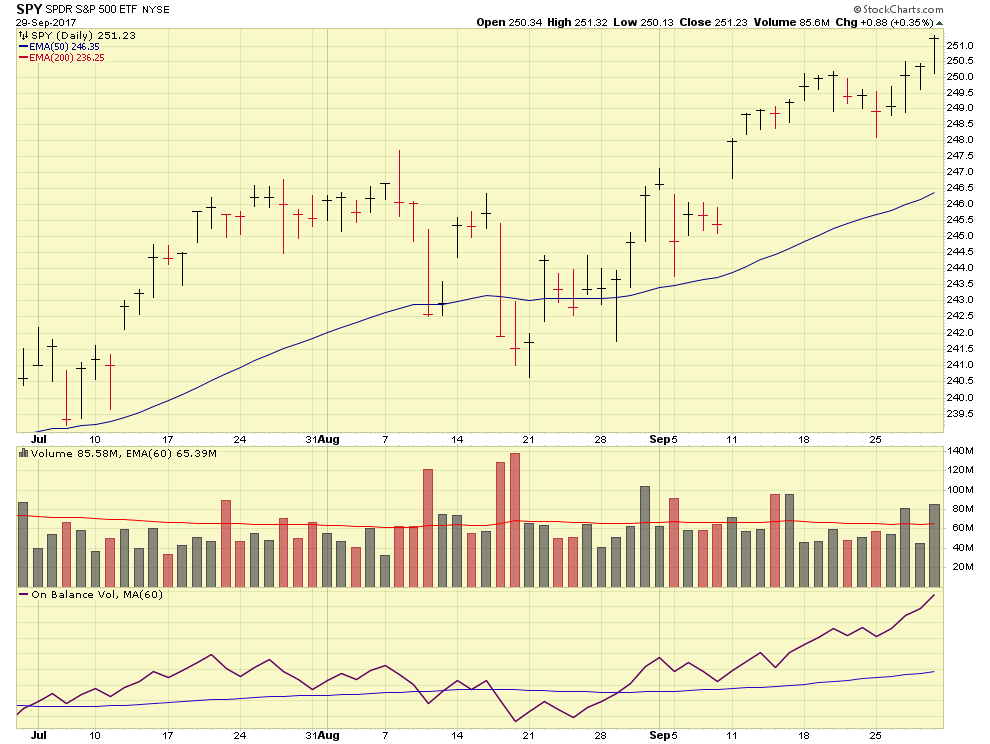
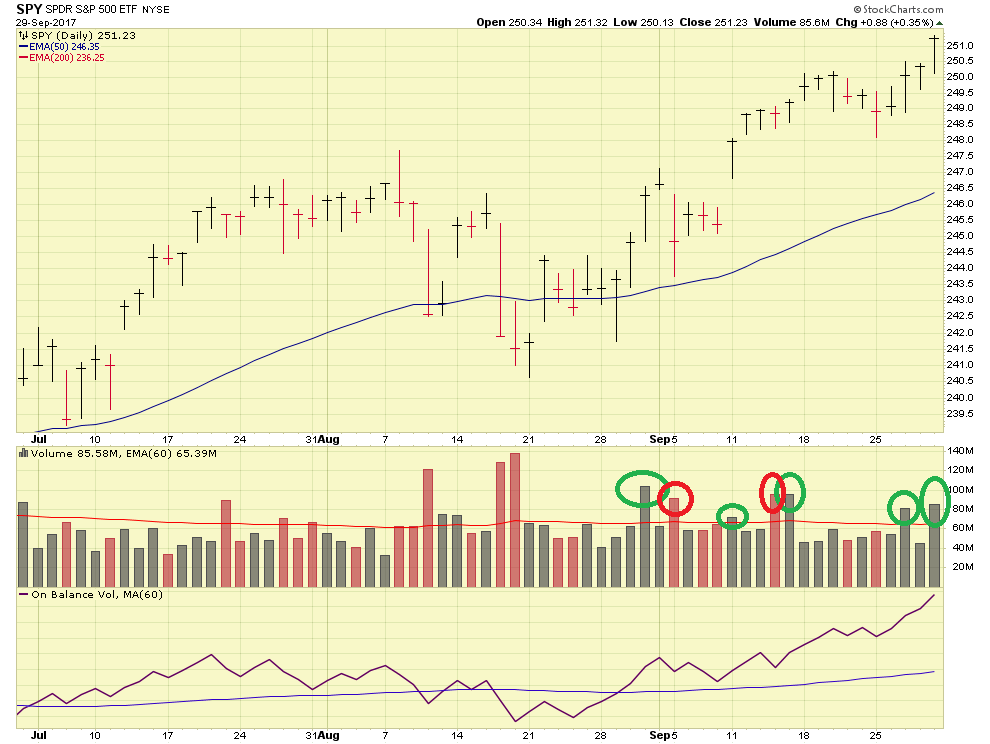
A positive observation is that volume has been subdued (mostly) for the last few weeks.  Indeed, whipsaws and swings have occurred, but volume is the “powder” behind the shot, low volume typically reflects weak moves which may not last.  Heavy volume is typically associated with large hedge funds, mutual funds, TSP/State Retirement plans, who are buying large positions.   When the volume is below average, especially on a sell-off/down day, it can be concluded that the “Smart Money” is hanging tight.   See article:    https://www.investors.com/how-to-invest/investors-corner/how-to-spot-institutional-accumulation/

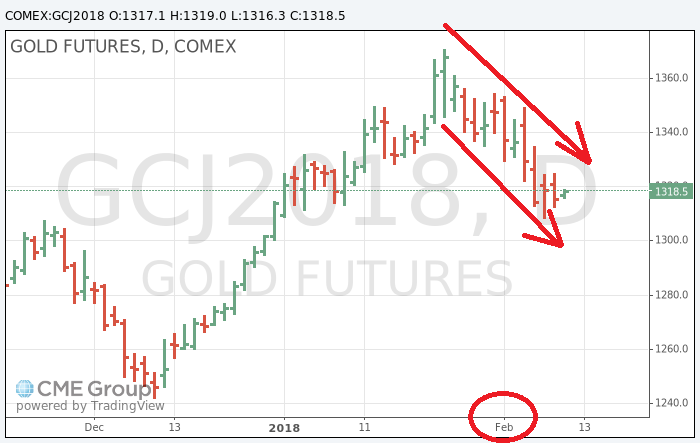
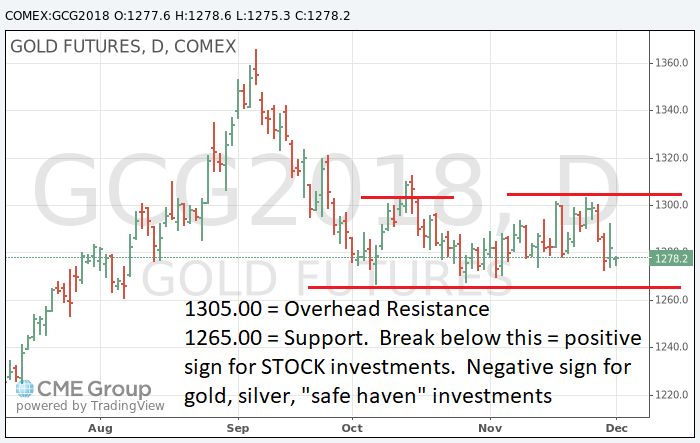
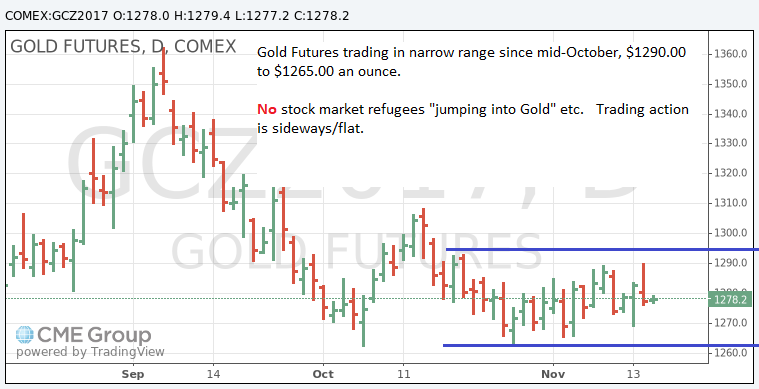
To continue my dissertation, let’s take a look at Gold Prices.   I have said in numerous prior postings that many consider Gold to be a “safe-haven” investment. 

With that said, Gold has basically been flat for the last 30 days.  It spiked somewhat when Syria was bombed, but rolled over and went back down in the next trading session.   See chart:

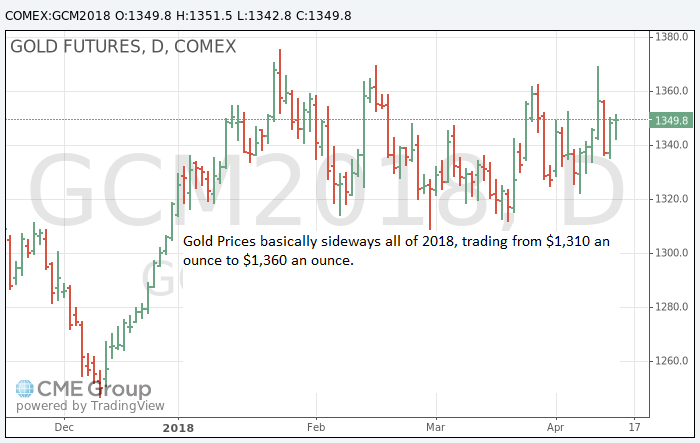
Visible is that Gold has traded between $1,310 to $1,360 an ounce.   Note we already made the observation that the stock market volume has been below average, meaning the “smart money” has not left stocks.   If they did (and if my theory was not correct) you would see (or probably would see it) show up in Gold.   However gold prices are fairly tame and subdued.   “Nothing to see here….”

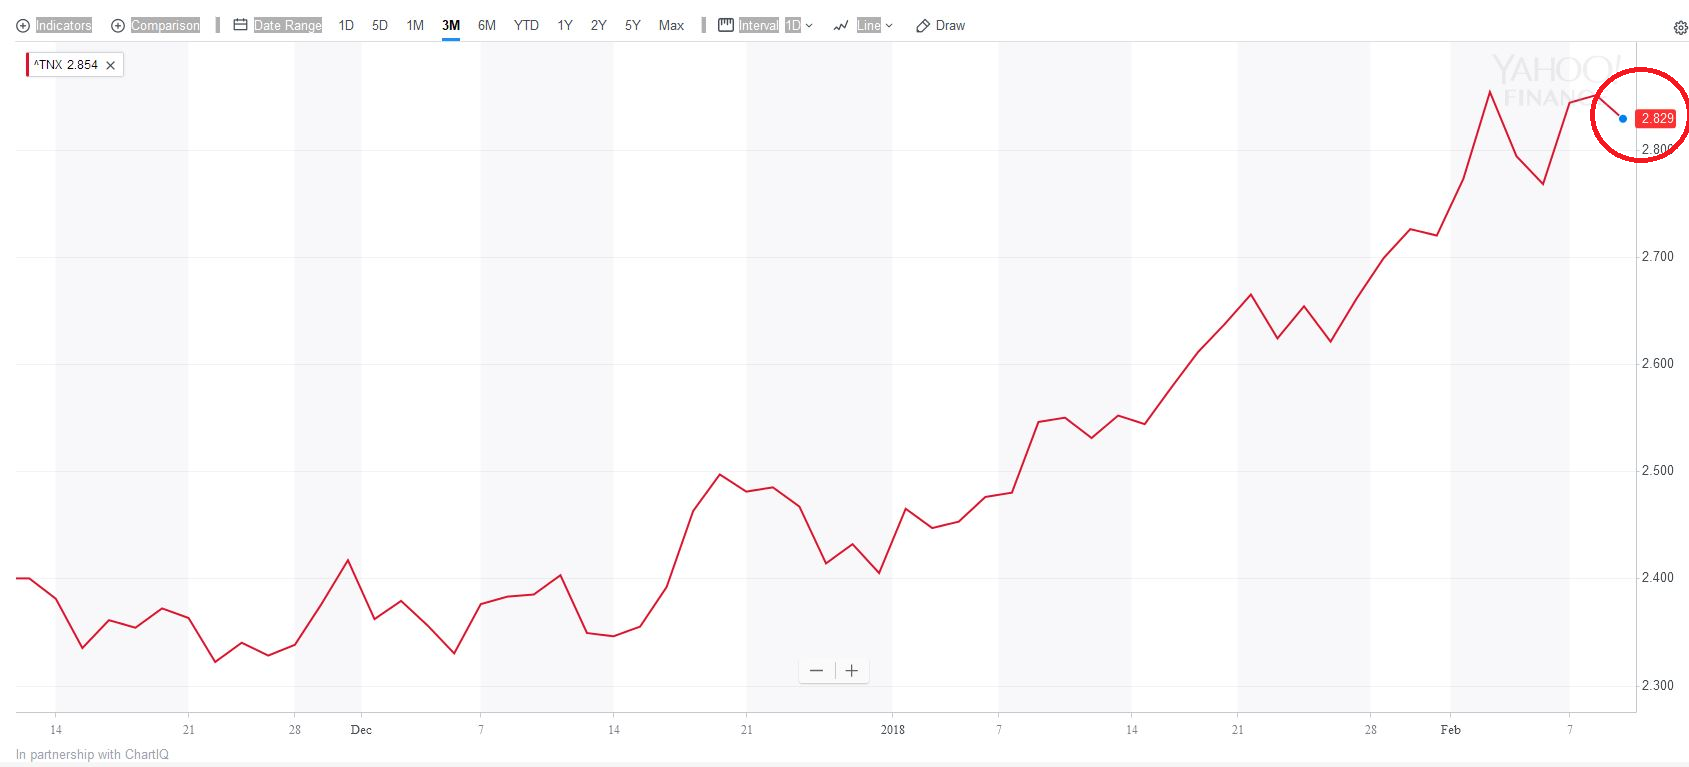
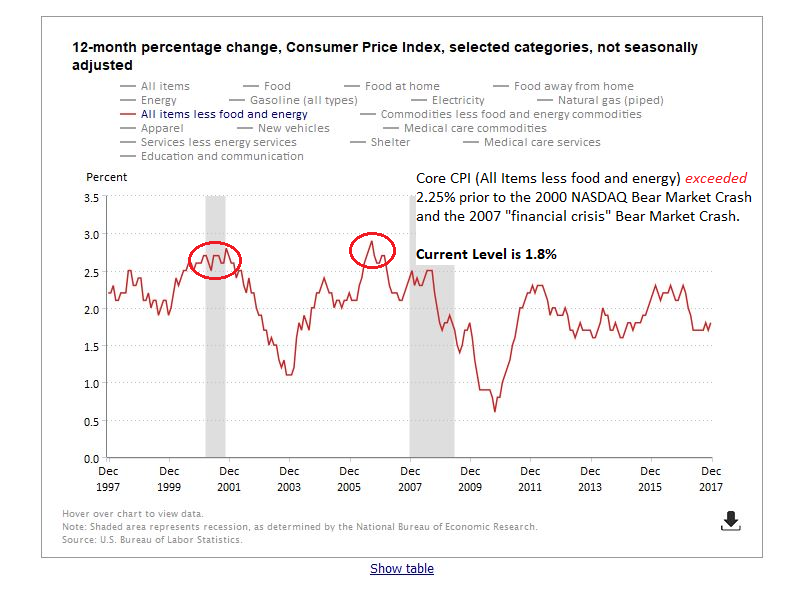
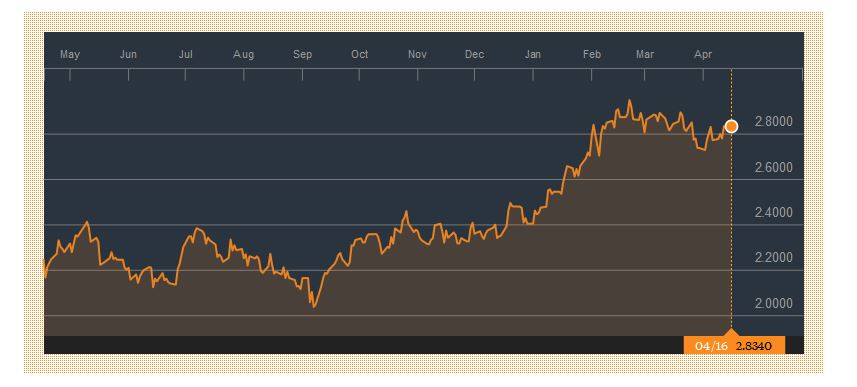
Recently some attention has been given to the 10-year Treasury Yield.   This tends to go up when inflation is feared.   The financial press is calling the 3% level a key psychological area.   3% yield or higher and we could witness the stock market going down, how much is anybody’s guess, largely due to black box trading computers which may be programmed to sell if 3% is attained.   The current yield remains below 3%:

The next event/date that I will be watching is the International Monetary Fund (IMF) World Economic Outlook release on April-17.  Expect to see tariffs, inflation, and the global economy to be the key themes.   The IMF is a good “second set of eyes” beyond our own federal government published data and documents, such as the FOMC, Bureau of Labor Statistics, Dept. of the Treasury.   It will be interesting what observations the IMF has on April-17.

As stated earlier, my TSP Allocation/Contributions remain 50% C-Fund and 50% S-Fund.    Expect another update in the coming weeks, however if there is nothing to report, then there is nothing to report.   Let’s hope that the market turbulence subsides and a renewed uptrend commences.

Thank you for reading.  I appreciate all the emails and messages, which rightfully tend to increase when the market volatility increases.   My updates often reflect recent questions sent to me, I believe I have touched on most of them on this update.   Please continue to share this site with your friends and coworkers, and keep Dan Jamison (The FERS Guide) in mind for the benefits and FERS system questions you may have.

Thank you again and talk to you soon !

-Bill Pritchard


Volatility Increases in Markets


Hello Folks

Bottom Line Up Front:  My TSP Allocation/Contributions remain 50% C-Fund and 50% S-Fund.

The month of February, historically the flattest month of the year, is thankfully behind us.   The markets witnessed increased volatility, with the VIX (Volatility Index) seeing drastic swings during the first two weeks of the month.  See chart:

Since mid-February, volatility has returned downward to “calmer levels” however the markets remain very sensitive to news out of Washington DC and to any policy/leadership changes in the agencies.   This, in addition to interest rate hikes, and inflation data, seem to be what sets the market’s mood for the day.   Before digging deeper, lets take a look at TSP returns for February.  Note that (as stated above), I am 50% C-Fund, and 50% S-fund.  I am not currently in the I-Fund, as I foresee the dollar eventually getting stronger, in response to a “bring business back to America stance”, the effect of which will admittedly not happen overnight, and independent of that, due to my belief that the US business climate is arguably operating in the strongest pro-business federal administration in history.  This will eventually help share prices of US equities as tax and regulatory reform benefit American business.    What you do with your TSP, is your business, if you are in the I-Fund, my opinion is nothing is “wrong” with that, however I am not in the I-Fund, for the reasons outlined above.

You will see that “Year to Date” (YTD) data reflects that the C-Fund is the only fund with a positive return, YTD.  Note that in February, all funds were negative, with the I-Fund being the worst performing of all.

However one-month returns do not make for a long-term behavior pattern, indeed they are part of it, but one bad month does not make for  a bad year.   Note that February is historically the flattest month (Dow Jones Index) during the year.   See chart (I have posted this before but recent subscribers have not seen this):

With that said, let’s do a short opinion-based overview of recent market action, and some of the causal factors.    Allow me to insert a chart of the SP 500 Index to get started:

The markets had a huge sell-off in early February (discussed in prior posts) and then remained mostly flat the rest of the month (in accordance with historical behavior).   On February 14, Core CPI data was released, an important inflation measure, coming in at 1.8%, a the same level it was at in Jan 2018, December 2017, and basically unchanged all the way back to April 2017.   Recent Core PCE Inflation data reflects no increase over past reporting periods.  All of this is resulting in fuddled economists asking why inflation has not creeped higher.  Some believe the FOMC may raise rates two or three times, versus four times, this year, as a result of the pacified inflation data.

On February 27, new FOMC Chairman Jerome Powell spoke for the first time to Congress, sharing his view that the economy is performing well.   If you wish to watch the three-hour video, the link is here:  https://www.c-span.org/video/?440903-1/federal-reserve-chair-powell-testifies-monetary-policy-economy

On March 1, President Trump publicly discussed trade tariffs for the first time, sending the Dow Jones index down 420 points, a “panic response” with no clear data or reason for worry.   On March 8, tariff paperwork was signed by President Trump, with the date of March 23 being the date they “take effect.”   A strong positive for the economy was observed on March 9, with “revised payroll numbers” showing that the economy gained 313,000 jobs in February, not 222,000 jobs as estimated.  This 41% improvement in job activity resulted in a positive day in the markets.

As we approach mid-March, my observations are that additional distribution (sell-off days) have indeed occurred on the indexes but that volume is below average, which eases my worry somewhat.   As seen on the SP 500 chart above, 2800 remains the overhead resistance level.   The index remains above its 50-day moving average, a useful tool to identify the trend.

Summary:  My TSP allocation/contribution remains 50% C-Fund and 50% S-Fund.  The month of February, consistent with prior years, gave us minimal returns.   Entering March, we have seen some sell-off days but nothing (for now) has me greatly concerned.

Thanks for reading.  Please share my site, and retired FBI Special Agent Dan Jamison’s site, The FERS Guide  , with your friends and colleagues.  I often get questions in regards to benefits, retirement calculations, “perfect age to collect social security”, and other stuff, and those are outside of my wheelhouse.   Keeping my finger on the pulse of the market (which directly impacts the TSP funds) is hard enough as it is.   For those questions, please reach out to Dan Jamison, who is fluent and the expert in such matters.

Thanks again and talk to you soon…

-Bill Pritchard


S&P 500 and Dow briefly enters correction Territory


Hello Everybody

Note:  My TSP Allocation/Contribution remains unchanged.  I am closely watching things and yes, my fingers are closer to the G-Fund button than they were before, however I have changed nothing.

The last two weeks have been quite turbulent.  We witnessed thousand point swings on the Dow Jones index, panicky financial headlines and fear mongering by the press, and more importantly, account balances and portfolios being damaged.   Bloomberg Press recently published an article mentioning how the reason behind the selloff is not identified:

Indeed, depending on what channel you watch or which expert you listen to, the theories abound.  I would not get too wrapped up in theory but instead stick to objective, identifiable market behavior and economic data.  The markets indeed went down, that is undisputed.  Allow me to share my opinions on things and it should become apparent why my comfort level is still (mostly) unshaken.

Let’s begin our discussion with the idea, shared by most on Wall Street, that a “Correction” is a 10% minimum decline (from a peak, or high) in an index.  Also lets identify that a “Bear Market” represents a 20% minimum decline, and is also reflective of a new, sustained, downward direction in the markets.   Bear Markets typically last six months to 2 years, Corrections typically last anywhere from one to 12 weeks.  Recent volatility requires tightening up the seat belt and putting the tray tables up, but occasional turbulence is not abnormal.  “Are you telling us that 1,000 point swings in the Dow is normal?”  No, I am not, but as I discussed in my prior post, look at daily percentage losses, not point swings.  Also, keep in mind the Dow is 30 stocks.  Do 30 stocks represent the entire stock market, and health of the economy ?   In my opinion no.

Surprisingly, if you use “Close Only” prices which eliminates intra-day volatility, no indexes are currently in correction territory.   The NASDAQ got close, but never entered it, and the SP-500 and Dow (both containing large cap stocks) touched it briefly but exited on Friday, Feb-9.   Many feel that “closing prices” better represent sentiment, as that was the last price before traders went home for the day.  In my charts, the 10%/Correction level is a horizontal blue line.  The 20%/Bear Market level is a horizontal red line.   Lets look at all three indexes:

Theories aside, my opinion as to why this is happening is:

  1. 10-Year Treasury Yields reaching 3% Level
  2. Fears of interest rate hikes by FOMC
  3. Concerns about inflation

Lets take a look at the Treasury Yield chart, indeed it is on a steady climb.  Many believe that 3% is an important psychological level.  Yields above this fuel fears of interest rate hikes by the FOMC, who will meet in March.

Under new FOMC leadership, a new metric may be used, but under prior FOMC Chairperson Janet Yellen, the FOMC has used 2% PCE Inflation as the trigger point to consider raising rates.  This is discussed in my March 11, 2015 post here.

It should be noted that when inflation is feared, and when stocks go down (dare I say in a “bonafide move down”), Gold Prices (Gold=Inflation hedge and safe haven currency) typically will go up.  This has not happened, while ostensibly the world is crashing around us.   Let’s take a look at the Gold chart since February:

Recall that the FOMC’s preferred measure of inflation is the PCE, not CPI, although the CPI does provide inflation related information.  The next release of CPI data will occur on Feb-14 (Happy Valentines Day…).   Again, the FOMC prefers PCE data.   CPI Chart below, most recent data reflects a CPI of 1.8%.  Ideally it retreats to 1.6% or 1.7% on Valentine’s Day release.  Note that leading up to the recent Bear Markets (sustained downtrends) in  the last 20 years, the Core CPI exceeded 2.25% on  a multi-month, consecutive basis.  We are not there.

Recently we have had panic and negativity, let me introduce some optimism.   Based on my analysis of things, my opinion is a Bear Market (an extended and sustained period of damage) is not immediately ahead.  Yes, we touched correction territory.  The US business environment has arguably never been healthier, and with reforms and tax cuts (Note:  Tax cuts indeed reduce revenue to pay our financial obligations and impact our US Dollar, that is another topic…) will serve to benefit the stock market.    Since 1950, seven out of nine Bear Markets occurred in a recession. Recession is a bad thing, think about foreclosed homes, unemployed people, and lost jobs.  We are not in a recession.

To quickly touch on recent action, Friday Feb-9 witnessed the markets closing strongly up, with Investor’s Business Daily reporting this as “Rally Attempt Day-1.”  This is an important concept, typically after four rally attempts, the market will begin a new uptrend and enter a new bullish phase.  Coincidentally, the dates so happen to line up that Day-4 (if it rallies every day) will be Feb-14, the same day that CPI is released (in the AM).

Some inquired about my comment from my prior post, regarding the indexes below their 50-day Moving Average.  Indeed, this is not preferred, but this just means that “there is work to do”, time to deep-dig analysis on economic data, stock charts, and other information, before any drastic decisions are made.

As a result of the above, my TSP Allocation remains unchanged.   Let’s see how this week plays out, CPI on Feb-14 indeed will be something to watch.

Thanks for reading, talk to you in another week or two.

-Bill Pritchard


Stocks down hard – My Allocation remains Unchanged


Hello Folks

Bottom Line Up Front:  My TSP Allocation/Contribution remains unchanged.

Most know that the Dow Jones index closed down 665 points on Friday February-2.   This prompted quite a few folks reaching out to me and asking if I was worried, and “why didn’t I see this coming.”   Most panic and emotionally fueled market days are impossible to “predict”, I can’t control if someone screams fire and everyone runs for the exits.   However my methodologies indeed include pro-active smoke detection systems, room temperature changes, visual checks of the structure, and my conclusion is that nothing is burning and nothing is on fire.  In 2018 we indeed have some conditions which will require that we remain vigilant and alert, but for now  I am staying where I am at.  Let’s take a closer look via my opinion based analysis….

A couple of potentially negative things exist in “the background” right now:

  1. FOMC Chairperson hand off, Janet Yellen passing the baton to new chief, Jerome Powell.  Yellen’s last day was Friday.
  2. Never-ending political turmoil at seemingly all levels.
  3. Expected interest rate hikes in March 2018 (FOMC Meeting March 20-21).  This is the leading cause of heartburn in markets.
  4. Some major Dow and S&P index components reporting less than expected quarterly earnings.
  5. Depending on who you ask, an “overextended bull market.”  Others, myself included, believe we may be entering a new uptrend phase and we may see another 1-3 years of gains.
  6. Weak US Dollar.

Now, some positive:

  1.  The Dow Jones loss on Friday represents a 2.5% negative performance.  Point loss was big, percentage loss was not.  In comparison, the Dow Jones lost 22% in one day during the famous 1987 market crash.  Percentage-wise, the loss on Friday, while not desired, was not a big deal.
  2. SP-500 Index had its best January one month return since 1997.
  3. January “sets the tone” for the rest of the year, 95% of the time (chart below).
  4. All indexes above their 50-Day moving averages.
  5. Sell-off volume was not hugely above average levels.

Lets talk about the above points some more.  I will not hit on every one, as most are already self-explanatory, but some need elaboration.  Lets start with the chart of the January’s of prior years.  This chart is from Jeff Hirsch, of the Almanac Investor.  I happened to meet Jeff in person at a Dallas,TX investment meeting two weeks ago; I asked him a couple of questions- turns out he and I both share similar bullish views about 2018.  He is a cool guy and knows his stuff.  The red strike-thru is my edit, as the graphic was last updated on January 26.

Going back to 1950, a strong January sets the tone for the remainder of the year at an approximately 95% success rate.

We indeed had some big name, major, companies report less than expected quarterly earnings.   Google recently reported that their Cloud Platform revenue is way behind expectations, competitor Amazon, with a similar cloud platform, is outperforming revenue-wise Google 5 times.   Google is a MAJOR NASDAQ stock and this dragged things down.  Apple, another major stock, is seeing lackluster Iphone-X sales.  If you didn’t know, the Iphone-X is not much (if at all, unless you are a Mac Addict and Iphone nerd) different from the Iphone-8.   Apparently, the millennial generation (well, probably everyone….) has some heartburn paying $1000 for a Iphone-X (43% costlier) that offers enhancements and improvements over the Iphone-8 of basically zero.   The press and analysts are questioning Apple’s business decision, and the stock is down.  (This is not an Iphone review, so…)

Let’s take a look at some charts:

You will see that the SP 500 index is indeed “overextended some”, a term popular with the financial media, describing when the index departs from its 50-day moving average and other trend-lines.   Note that it still remains above the 50-day, which is approximately 2730.   2730 is an important level.  Any close below 2730 is cause for some alarm.   

In regards to the weak US Dollar and its impact on stocks, ask 20 economists about this and you will get 20 answers.  The theory that “a weak dollar makes international stocks go up” is questionable.  Many believe the weak dollar is a result of international stocks moving higher first, as money goes into overseas investments and non-dollar currencies, causing the dollar to fall.   “Moving to I-Fund because the dollar is weak” probably should be opened up a little more to include consideration of other factors.  My opinion.  Just remember the dollar is a currency, the stock funds are stocks, two different animals.  Keep in mind the world markets are just that:  global in nature.  Toyota (Japan), Samsung (South Korea), Airbus (France), have factories and subcontractors all over the world, and sell to customers all over the world.   The “Japanese” Nissan Titan pickup truck ?  Built in America and sold in America.  Korean Samsung TVs?  Sold in Mexico.  If Toyota Camry’s suddenly fell apart after 1 week of ownership or had a series of gas tank explosions, Toyota stock would go down, weak dollar or not.  Toyota is a Japanese company- Japanese stocks represent 24% of the MSCI-EAFE Index, which is what the I-Fund is based on.  The point here is that the US Dollar, alone and by itself, is not what causes the I-Fund to move up or down, in my view.  Strong Corporate/company performance, quality products, and solving problems are typically the companies whose stock prices go up, no matter what country the HQ is located in.  Some have different interpretations and view things via a different lens, that is fine, I am sharing my opinion, nothing more.

If interest rates rise this year, the US Dollar is expected to recover.   Also, Mr. Trump’s approach of de-regulation, tax reform, and bringing business back to US soil is an approach never seen in history; the resulting effect on the US Dollar is not known, nor will it be seen for 6-12 months.  In basic terms, the US Dollar weakness is probably attributed to the belief that tax reform will result in reduced tax revenue to pay for government programs and financial obligations, thus impacting our economic health as a nation, and it is also weak due to investment taking place overseas.  Money leaves US stocks and currencies (USD) and goes elsewhere, in pursuit of higher returns, especially in China.  China, the world’s factory, does pretty good when the world is doing good.   In the end, our American Greenback has fallen in value.  I am not running a FOREX site or economic think-tank (both are beyond my expertise) so I will stop there.

The main driver, in my opinion, of market panic is the expected interest rate hikes.  However I believe that the multiple efforts by the current administration, on all fronts, to stimulate business growth and effect tax reforms, will mute any negative impact that rising rates will have.

In summary, let’s monitor things but I see last week’s action as panic driven.   I also feel we are in a never-seen-before environment of pro-business politicians, tax reform, and de-regulation.  All economic indicators appear positive.  I feel very confident about 2018.   Let’s keep an eye on SP-500 level of 2730, any close below that, well maybe multiple closes, and I will start to stay up at night.

My TSP Allocation/Contributions remain unchanged.

Thanks for reading….talk to you soon….

-Bill Pritchard


Government Shutdown – Market Impact


Good Evening Everybody

I have received quite a few messages in regards to how the government shutdown will impact the TSP and the market.  As we know, TSP performance is largely dependent on the US stock markets.  It is my opinion that there will be minimal negative market impact.

Going back 20 years, we have had three shutdowns:

  1. Sept-30 to Oct-17, 2013
  2. Dec-15 1995 to Jan-6, 1996
  3. Nov-14 to Nov-19, 1995

The 2013 shutdown witnessed a slight hiccup in the markets, although it is not known if this was indeed triggered by the shutdown.  The markets rallied the rest of the year, resulting in my conclusion that the 2013 shutdown had little impact on the stock markets.   The “background action” included a strong, uptrending stock market.  See chart:

It should be noted that the 1995/1996 shutdown witnessed the NASDAQ (flashback to AOL, NetScape, AskJeeves) bull market in it’s infancy, and had absolutely no negative impact to the markets.  See chart:

Like today, these shutdowns were due to the inability to reach agreements, and like today, in the “background” existed a strong and healthy stock market.

As we sit today, 2018, the market is arguably healthier than it has ever been.   We are arriving to another shutdown scenario, however based on historical behavior (nothing is guaranteed, but history tends to repeat…), and the strong market in the background, I expect minimal negative market impact.   Note that Monday and Friday tend to be “emotional days”, we may see some panic selling, the world-is-ending, action on Monday.  It is my opinion that this should be disregarded (if it even happens) and instead let’s allow the market to find its footing later in the week.

Please anticipate another post at the end of the month, or early February, discussing January 2018 market action, as the markets “set the tone” for the rest of the year.  All the stock funds are doing well, we are very fortunate.   If your choice is international exposure, domestic large caps, or domestic small caps, whatever your preference, you are being rewarded.   The year has begun very well.

Thank you and take care

-Bill Pritchard


Merry Christmas Message and last post of 2017


Good Afternoon Readers

First, Merry Christmas and Happy New Year.  2017 indeed has been an exciting year, on many fronts, and our TSP is no exception.   Let’s take a look at some of my personal TSP moves.  You may recall my January 13, 2017 post regarding the January Barometer.  I shared my opinion that based on market action in January, that 2017 was setting up to be a strong year.   I am pleased to report that this analysis was indeed correct:  2017 witnessed the SP 500 return 20%, and the NASDAQ return 29%.

Note that both Year to Date and Last 12-months data reflects that the top two funds were the C-Fund, and I-Fund, in 2017.  See graphic:

Further note that I was 100% S-Fund, under the valid belief that small business would benefit most from the variety of economic incentives being advocated by President Trump, however my crystal ball apparently needed calibration as the S-Fund slightly underperformed the C-Fund in 2017.    Additionally, the “international scene”, plagued by 2015 and 2016’s terrorism and North Korea fears, caused me to be gun-shy (no pun intended) on international investments.  It could be said that my TSP reflected an “America First” allocation.  I did shift to 50/50 C-Fund and I-Fund mid-year, believing that was the correct allocation to capture the best performers for the rest of the year.  This analysis, like my January Barometer analysis, was correct:   those two funds were 2017’s top performers.

Finally, in December, I switched to 50/50 S-Fund and C-Fund, my current allocation.   Again, the is performance based, when a new young Quarterback is improving each game and showing promise, I tend to pay attention to him.  This is not some sort of witchcraft, tea leaves, mumbo-jumbo, or reading the past to predict the future, etc (all of which some naysayers claim this site does…).   It is really quite simple.  It is what it is:   Being heads-up and alert and responding to the threats/opportunities in front of you.  Thinking ahead.  Situational Awareness.   Retreating to cover and concealment when required.  Jeff Cooper.  All of the above but applied to our TSP.

Let’s collectively wish for a great 2018.   Merry Christmas and Happy New Year.    God Bless our nation’s public safety, law enforcement, intelligence, and military professionals so that the rest of America remains safe.

Merry Christmas !!!

-Bill Pritchard


Dow futures up 200 points, my TSP Allocation Changes


Hello Folks

On Saturday December 2, at approximately 2AM, the Senate passed their version of the proposed tax bill, which has some slight differences from the House version.   However for the first time in a long time, we are seeing progress forward, and the US market futures have responded enthusiastically.   Please see chart below of E-Mini Dow Jones Futures, which begins trading on Sunday afternoons:

The Dow Jones futures are “trading up” 200 points as of 7:30 PM Central Time, a very positive sign.  Unless sentiment shifts, this should result in a very positive Monday in the US stock markets, which will benefit the S-Fund and C-Fund.   As such, and after an over-abundance of caution and “wait and see” over the prior months, I will be moving my personal TSP allocation to 50% C-Fund and 50% S-Fund.   This reflects a change from my prior allocation of C-Fund and I-Fund, which was fine:  both Last 12-Months data and YTD data reflect those were the two top performing funds:

The fact that my prior personal TSP allocation had been in the top two performing funds, out of ten total fund choices, was not by happenstance, it was the result of careful analysis and monitoring of the markets.  I have said before, and I will repeat again, that one day panics are not reason to dive into G-Fund or run for cover.  I am looking at the overall trend, the structural integrity of the trend, and what stocks within that trend are performing best.  I am also watching for “tomorrow’s winners”- redwood trees don’t sprout overnight, they develop over time.  It is that same analysis that prompts me to change my personal TSP allocation to reflect C-Fund and S-Fund.   S-Fund has been outperforming I-Fund for the last 90 days, for a variety of reasons, and if the final tax bill can clear House and Senate, and get signed by President Trump, all business, large and small, are expected to benefit.  Anyone in a compliance-heavy (and who isn’t these days…) industry, in which more time is spent dotting “i’s” and crossing “t’s” and “getting ready for the next audit” versus spending it on the organization’s core mission of selling widgets, or creating solutions for customers, is expected to benefit from the tax bill and future deregulation initiatives from President Trump.

Let’s take a look at the Gold chart to see if any prior selloffs have resulted in a move into Gold, the standard safe-haven currency:

As can be seen, Gold has been relatively “flat” since October, even in light of recent North Korea flare-ups and recent headlines from Washington.  This reinforces my belief that prior selloffs were indeed panic driven versus representative of structural cracks in the foundation of the uptrend.

Note that the Christmas break for Congress is December 15, 2017 to January 2, 2018.   With that said, Congress has two major to-do items, the Tax Bill, and passing a short-term Continuing Resolution (CR) as the current CR expires on December 8.   While the tax bill progress is positive news, nothing is done until it is done, and this week will be a busy one for Congress.  Note:  Not to be Debbie Downer but any Tax Bill failure (not a delay, but a hard-down, failure) will be a serious problem for the markets.  Ideally the new tax bill is signed before 2018, however a delay to tweak it is much preferred to a failure.

As an additional note, Dan Jamison of the FERS Guide has released another update, I strongly suggest going over to his site and subscribing to his newsletter.  He has some important benefits related information all federal employees could benefit from (no pun intended), so please take a look:   https://fersguide.com/

That is all I have for now, thanks for reading.  Please continue to share this site with your friends, coworkers, and colleagues.

Thank you….

-Bill Pritchard


Markets go down on Disagreement


Hello Folks

Well, it is about that time- Update Time, numerous folks have emailed me, WhatsApp’ed me, or just found me, and asked if the world is ending and why the market is going down.  Some of the concerns are valid, others are reflective of an “always goes up” market which quite frankly has lulled some of us into a comfort zone.   In this post I will attempt to explain what I believe is happening, and where I believe we are headed, at least near-term.    First, well not first but before I go further, my TSP Allocation and Contributions of  50 percent C-Fund, 50 percent I-Fund remains unchanged.

The markets right now are policy-driven, not economics driven-  I have said this numerous times on this site, and sadly I am being proven correct as we watch the markets decline.   Policy-driven, but more correctly, politics-driven.

Below are charts of the SP 500 Index, my standard barometer to determine market health:

Apparent in the above charts is that the markets were on a fairly intact uptrend prior to Nov-9.   Then what happened ?  Did a report come out indicating that personal bankruptcies are at all time highs ?   Huge unemployment numbers ?  Poor retail sales data ?  GDP data worsening ?   None of the above.  What happened, and is happening, is a lack of agreement in Congress.

On November 9, the Senate Finance Committee stated that the Tax Reform Plan would cut corporate tax rate to 20% no earlier than 2019, versus 2018, as originally believed.   The markets sold off on that news, which served as a reminder that “everything is not as it seems” and that agreement in Congress is clearly lacking.

On November 14, Senate Majority Leader Mitch McConnell announced that a revised tax plan is being proposed, a plan that includes a partial repeal of Obamacare.   If you want about a thousand search results on this topic, feel free to use Google and you will not be disappointed:  numerous theories exist as to what impact a repeal will have to the economy.  I will not attempt to dissect the approximate 1,000 opinions on the internet.   But I will state the obvious:  Yet again, we see discord in Congress.

A review of the charts above will reveal that sell-off volume is not super high, indeed some days it was above average, but we are not talking 50% or greater (150% normal) than average volume.  The SP 500 is still above its 50-day Moving Average, a useful trend identification tool.   Will the month close out with the index, and various TSP funds, in the negative ?   Yes, this is possible.

Should we worry ?   I am not worried, not yet.  A glance at the Gold Futures (Gold is historically a safe-haven investment for investment doomsayers) indicates that nobody is bailing out of stocks and into Gold.   Gold prices are mostly flat (sideways) since mid-October.   See chart:

My frequently broken crystal-ball predicts that our politicians will realize that lack of agreement is impacting both Wall Street and Main Street, and that an 80 percent solution is the best answer.   “I win, you lose” is a binary model that should go the way of the Cold War.   This approach needs to be abandoned in favor of  “You win [some] and I win [some] – everyone wins”.   My opinion.

Thanks for reading….

-Bill Pritchard


October closes out / historically positive phase Begins


Hello Folks

In true “no news is good news fashion”, I simply had no bad news to write about, or “warning signs” observed this month so far – this is my second October post, albeit at the end of the month.  As such, it will serve as my opinion based analysis on what happened, and what lies ahead.   Bottom Line Up Front:  My TSP Allocation and Contributions of  50% C-Fund, 50 % I-Fund remains unchanged, I will discuss that in a little while.

First, as reported by some of the Government Employee targeted websites out there (Federal News Radio, Government Executive, NARFE, etc):     The 2018 joint budget resolution was passed with no cuts to federal retirement, pay, or other benefits.

With that said, for deeper, more knowledgeable insight into the benefits related perspective and the respective proposed cuts, subscribe to retired FBI S/A and current CPA Dan Jamison’s FERS GUIDE.  A paid subscriber will get email access to Dan who will attempt to answer your questions.  Every couple of weeks Dan and I trade emails in regards to benefits and/or TSP, he is the expert in regards to retirement benefits knowledge.

As it stands, no cuts have occurred however we may see this topic rear its head again down the road.  My opinion is this “flare up” should serve as a gear/equipment check for the folks in the audience, take a look at your financial situation:  if you are eligible to retire now (or soon), then apply that risk-assessment we all do in our day jobs.  I don’t think anyone has the answer, but I think that “Already-Retired status” is more insulated from attempts to erode your benefits than not.

Moving forward,  and returning to the topic of this post, the markets performed very well in October.  My default, market health barometer, the SP 500 Index, made new highs, as did international stocks to include North Korea neighbors of South Korea KOSPI Index and the Japan Nikkei Index.  While the threats from North Korea are clearly a worrisome matter, the Asian markets have apparently discounted them and returned to regular programming-  the aforementioned Asia indexes are uptrending nicely.  See charts with comments:


Traveling back home, the US markets are doing very well.   Primary causal factor is the improving Gross Domestic Product (GDP).    GDP is important because it gives information about the size of the economy and how an economy is performing. The growth rate of real GDP is often used as an indicator of the general health of the economy. In broad terms, an increase in real GDP is interpreted as a sign that the economy is doing well.   Note that in July, FOMC Chairwoman Janet Yellen advised Congress that achieving 3% GDP would be difficult.  However recent GDP statistics from the Bureau of Economic Analysis indeed appear very positive, third quarter GDP of 3%, previous quarter of 3.1%.   See chart:

Remember, many believe (including me) that the markets are a leading indicator, in other words, they go up (and down), long before the general public understands why.  We saw this in the 2000 market crash, and the 2009 bull market, the market direction changed before most of the audience identified what was happening.  What does that mean for us ?  It means that the current uptrend may be indicative of a longer term bull cycle.  Indeed many have observed that “this never happened before” and believe that the current market is “ready for a pullback” but when in doubt, follow the market itself.   Let’s take a look at some SP 500 Charts:

As mentioned earlier, my TSP Allocation remains the same.   Varying my analysis from different look-back periods, 90 days, 30-days, to weekly, I find it difficult to make “performance tweaks” to my TSP-  all the funds are doing quite well.   Looking ahead, the following dates/events may be noteworthy in the coming weeks:

New pick for FOMC Chairperson:  Expected Oct-30 week

Ways and Means Chairman Kevin Brady introduces Tax Reform Bill:  Nov-1

POTUS Asia Tour:  Nov 3-14

Congress Thanksgiving Break:  Nov-18 to Nov-26

Note that it is my opinion that if the Tax Reform proposals pass, the stock markets will respond with enthusiasm.  Further note that historically, November thru April represents a historically positive phase/cycle, the markets are typically up every month during that time period.

Nothing further to report for now….please continue to share my website with your friends and colleagues, I find it quite rewarding that I am able to raise awareness and share my point of view in regards to the markets and the TSP in general.    Once again, go take a look at Dan Jamison’s site and make sure you subscribe to his newsletter.

Thanks for reading…..

-Bill Pritchard


Rare Positive September – Market uptrend Continues


Hello Everybody

My personal TSP Allocation remains 50% C-Fund and 50% I-Fund.

September, historically a “down month”, was indeed positive, with the last trading day resulting in an All Time High (ATH) attained by the SP 500 Index, reaching 2519.44

We have witnessed fairly decent accumulation since mid-September, likely the market’s positive response to President Trump’s tax and deregulation plans.  We are also witnessing an improvement of the global economy, which helps everybody.  The next event watched by the market is a possible change to the Federal Reserve Chairperson, reportedly this will be decided by the end of October, as President Trump is reportedly considering not to renew Chairwoman Janet Yellen.

While official TSP data is not in, we will likely see that the S-Fund was the top performer for the month, with the C-Fund and I-Fund lagging, however still positive.  My personal conviction that the ideal allocation of 50/50 C-Fund and I-fund may change, I will allow October to come and close out, and re-assess my allocation.  To be clear:  “All stock funds are doing great” and it is rather challenging to make performance tweaks to any combination of stock funds.     Note that the I-Fund is leading and C-Fund is next best performing, when considering both YTD and past 12-month performance.   Again, all stock funds are doing fine.   Observe that I am not in the G-Fund, as I see no warning signs ahead or speed-bumps in the road, and thus feel the protection of the G-Fund is not needed for my TSP right now.

Let’s take a look at some charts, both of the SP 500 Index and of the SPY Exchange Traded Fund (ETF), which is useful to monitor volume action.

Evident in the charts is the clear up-trend, again, a rare event in September, a historically negative month.   Also apparent is “more up days than down days” a rather Basic-101 analysis device however sometimes basic is better than not.

I sometimes get asked if I am concerned about the I-Fund being impacted by events in Asia.   This is a great question, but if we look at the South Korea KOSPI Index (“their SP 500”) and Japan’s Nikkei Index (the largest Asian stock market is in Tokyo, Japan…also the country whose airspace was penetrated by North Korea missiles…)-  their markets do not seem too worried.   Lets take a look:

No major downturns or sell-offs in those markets, both next door to North Korea.

As such, I remain in I-Fund and personally am not too worried about things in North Korea, as they relate to my TSP.

With that said, I have no other news to report….I am very pleased with the September performance and as stated above, my TSP remains the same.   I typically re-assess my allocation every 90-days, we are past that point now.   I prefer to let October come and close prior to making any changes, remember I look at things on a 60-90 day cycle (typically…not always…) versus fret over daily volatility.

Hope everyone is doing well…I will post another update when warranted, for now let’s step back and watch how October plays out.

Thanks for reading….

-Bill Pritchard